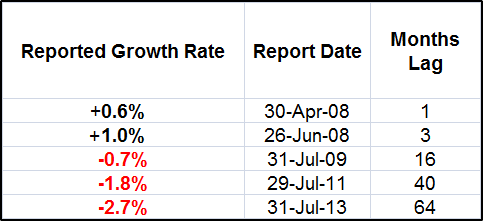
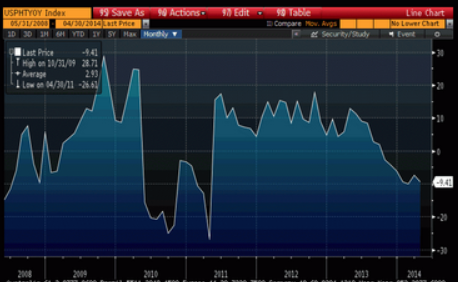
Still doesn’t look all that exciting…
Full size image

So my narrative is:
The Federal budget deficit is too small to support growth given the current ‘credit environment’- maybe $400b less net spending in 2014. The automatic fiscal stabilizers are ‘aggressive’, as they materially and continually reduce the deficit it all turns south. The demand leakages are relentless, including expanding pension type assets, corporate/insurance accumulations, foreign CB $ accumulation, etc. etc.
The Jan 2013 FICA hike and subsequent sequesters took maybe 2% off of GDP as they flattened the prior growth rates of housing, cars, retail sales, etc. etc. Q3/Q4 GDP was suspect due to inventory building, a net export ‘surge’, and a ‘surge’ in year end construction spending/cap ex etc. I suspected these would ‘revert’ in H1 2014. It was a very cold winter that slowed things down, followed by a ‘make up’ period. The question now is where it all goes from there. For every component growing slower than last year, another has to be growing faster for the total to increase.
The monthly growth rate of durable goods orders fell off during the cold snaps and the worked it’s way back up, though still not all the way back yet, and the ‘ex transportation’ growth rate was bit lower:
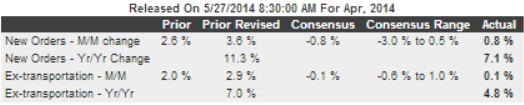
And of note:
Investment in equipment eased after a robust March. Nondefense capital goods orders excluding aircraft dipped 1.2 percent, following a 4.7 percent jump in March. Shipments for this series slipped 0.4 percent after gaining 2.1 percent the prior month.
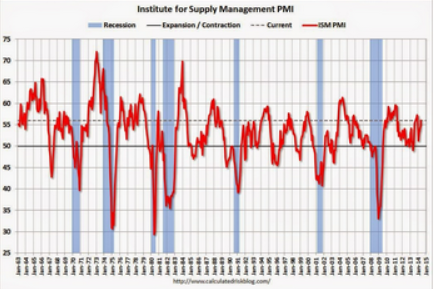
In general the manufacturing surveys were firm.
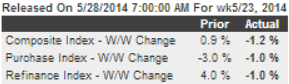
Mortgage purchase applications continued to come in substantially below last year, even with the expanded, more representative survey:
According to the MBA, the unadjusted purchase index is down about 15% from a year ago.
MBA Mortgage Applications
Highlights
Mortgage applications for home purchases remain flat, down 1.0 percent in the May 23 week to signal weakness for underlying home sales. Refinancing applications, which had been showing life in prior weeks tied to the dip underway in mortgage rates, also slipped 1.0 percent in the week. Mortgage rates continue to edge lower, down 2 basis points for 30-year conforming loans ($417,000 or less) to 4.31 percent and the lowest average since June last year.
And then there was the Q1 revised GDP release:

What drove it negative was a decline in inventories, net exports, and construction/cap ex:
The largest revisions to the headline number were from inventories (revised downward by -1.05%) and imports (down -0.36%), and although exports improved somewhat from the prior report, they still subtracted -0.83% from the headline. Fixed investments in both equipment and residential construction continued to contract.
PCE growth was revised up to +3.1% (adding 2.09% to GDP) but seems over 1% of that came from ACA (Obamacare) related and other non discretionary expenditures like heating expenses, etc. The question then is whether the increases will continue at that rate and whether the increased ACA related expenses will eat into other, discretionary expenditures.
The contribution made by consumer services spending remained essentially the same at 1.93% (up 0.36% from the 1.57% in the prior quarter). As mentioned last month, the increased spending was primarily for non-discretionary healthcare, housing, utilities and financial services – i.e., increased expenses that stress households without providing any perceived improvement to their quality of life.
And seems this Chart is consistent with my narrative:
And not that it matters, but just an interesting observation:
And lastly, for this report the BEA assumed annualized net aggregate inflation of 1.28%. During the first quarter (i.e., from January through March) the growth rate of the seasonally adjusted CPI-U index published by the Bureau of Labor Statistics (BLS) was over a half percent higher at a 1.80% (annualized) rate, and the price index reported by the Billion Prices Project (BPP – which arguably reflected the real experiences of American households while recording sharply increasing consumer prices during the first quarter) was over two and a half percent higher at 3.91%. Under reported inflation will result in overly optimistic growth data, and if the BEA’s numbers were corrected for inflation using the BLS CPI-U the economy would be reported to be contracting at a -1.52% annualized rate. If we were to use the BPP data to adjust for inflation, the first quarter’s contraction rate would have been a staggering -3.64%.
And looks like this will be limiting the next quarter:
Real per-capita annual disposable income grew by $95 during the quarter (a 1.03% annualized rate). But that number is down a material -$227 per year from the fourth quarter of 2012 (before the FICA rates normalized) and it is up only about 1% in total ($359 per year) since the second quarter of 2008 – some 23 quarters ago.
And remember this?
So the question is, how strong will the Q2 recovery be, and where does it go from there?
Again, looks to me like the deficit is having trouble keeping up with the demand leakages, and it keeps getting harder with time?
Jobless claims continue to work their way lower, but they are a bit of a lagging indicator and even with 0 claims there aren’t necessarily any new hires, either, for example.
And there’s another couple of issues at work here.
First, 1.2 million people lost benefits at year end, and it’s expected up to half of them will find ‘menial’ jobs during H1. However, corporations don’t add to head count just because unskilled workers lose benefits, so the employment numbers may thus be ‘front loaded’ with higher numbers of hires in H1, followed by fewer hires in H2.
Second, seems the new jobs don’t pay a whole lot, and a lot of higher paying jobs continue to be lost, so the increased employment isn’t associated with the kind of subsequent growth multipliers of past cycles.
Corporate profits were down over 10% in the Q1 GDP report, and mainly in the smaller companies as the S&P earnings saw a modest increase. Hence the small caps under performing, for example? Not mention earnings also tend to up and down with the Federal deficit:
This year over year pending home sales chart speaks for itself:
Another series following the pattern- down for the winter weather, then back up some, and this time then backing off some:

Highlights
Personal income & spending, up 0.3 percent and down 0.1 percent, fell back in April following especially strong gains in March. Wages & salaries slowed to plus 0.2 percent vs a 0.6 percent surge in March while spending on durables, reflecting a pause in auto sales, fell 0.5 percent vs gains of 3.6 and 1.3 percent in the prior two months. Spending on services, however, also fell, down 0.2 percent on a decline in utilities and healthcare after a 0.5 percent rise in March. In real terms, spending fell 0.3 percent following the prior month’s 0.8 percent surge. Price data remain muted, up 0.2 percent overall and up 0.2 percent ex-food and energy. Year-on-year price rates are at plus 1.6 percent and 1.4 percent for the core.
And again, the ACA and other non discretionaries added about 1% in Q1. So, again, it’s down for the winter, then up and this time back down to begin Q2 (with the growth of healthcare expenses backing off some):
Ice Farm Weekly Summary
By: Michael W. Green
Cochrane Monetary Policy with Interest on Reserves
Dear Warren,
Sorry not to respond more quickly; but I’ve been swamped with work!
However, I did a cursory reading of Cochrane’s paper which is extremely interesting. For a moment I thought that you must have been coaching him! What is amazing is that these people seem to be completely tribal and never look outside of their own clan or, if one were to be a bit more severe in one’s criticism, they are very much aware of what many of us say but they are just too afraid to cite us because that will then discredit them in the eyes of the mainstream. Hence, this is why he starts off with Friedman, Sargent & Wallace, et al. and seems to suggest that the monetary system has changed because of technological change leading to a diffusion of interest-paying electronic money and now interest on “base” money. All of this is nonsense because we could trace some of these same ideas literally to the nineteenth century within heterodox circles. Hence, to say that the gold standard was a fiscal policy commitment is hardly new and you could probably pull it out of someone as disparate as Karl Polanyi and, yet, it would seem that they are now rediscovering America!
But it is very interesting that he is saying many of the same things that we have been saying for quite some time. On the question of monetary policy, as you know, here we have been paying interest on “reserves” (or more correctly “settlement balances” in Canada, which is actually a more correct vocabulary than “reserves” … since the latter is perhaps suggestive of these “reserves” backing “inside” money, which is nonsense!) for over two decades, and this institutional change in the early 1990s was hardly because of technological change! It was to conduct more efficiently monetary policy when they realized that the control of monetary aggregates was completely futile. In much the same way, the whole issue of controlling the price level via fiscal policy is pure Abba Lerner!!
Hence, I’m really delighted to see that Cochrane is seeing the “light” and seems to understand reasonably well what he describes as the “political economy” concern of his findings. However, it is so depressing to see how “autistic” these people could be. There is not even one mention or reference to MMT or Chartalism, or Post Keynesianism, or anything of the sort! All these changes are merely a natural extension of Friedman 1969, which has been driven by changes in the monetary/technological landscape. That is just so phony and quite irritating to us who know better!
Thanks for the reference. I was unaware of the paper!
Best regards,
Mario
From the NAR: Pending Home Sales Edge Up in April
The Pending Home Sales Index, a forward-looking indicator based on contract signings, increased 0.4 percent to 97.8 in April from 97.4 in March, but is 9.2 percent below April 2013 when it was 107.7.
The PHSI in the Northeast increased 0.6 percent to 79.3 in April, but is 12.0 percent below a year ago. In the Midwest the index rose 5.0 percent to 99.2 in April, but is 6.9 percent below April 2013. Pending home sales in the South slipped 0.6 percent to an index of 111.9 in April, and are 6.4 percent below a year ago. The index in the West declined 2.9 percent in April to 88.4, and is 15.0 percent below April 2013.
Note: Contract signings usually lead sales by about 45 to 60 days, so this would usually be for closed sales in May and June.
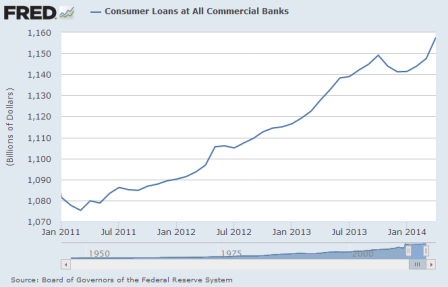
Beware charts showing only the last bit of this chart that suggest consumer lending is accelerating.
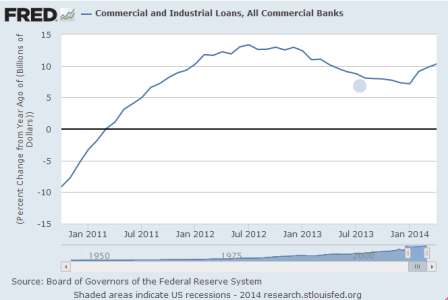
I suggest you go back at least 5 years with any charts to put them in perspective, all of which looks to me like there is no ‘acceleration’, at least not yet. And corporate bond issuance and, recently, which may be contributing to some loan growth:
Consumer loans, all commercial banks:
Commercial and Industrial loans, All commercial banks, % change from a year ago:
Lower rates fail to boost mortgage activity
May 28 (CNBC) — Applications to purchase a home—an indicator of future home sales—fell 1 percent on week, but the year-ago comparison continues to widen. Two weeks ago purchase applications were down 11 percent on year; last week the annual drop increased to 15 percent.
Got HAMP? Mortgage payments will increase
By Polyana da Costa
(Bankrate.com) — Monthly house payments will go up soon for homeowners who received government-sponsored loan modifications after the financial crisis.
The first wave of rate and payment increases will begin this year, affecting about 30,000 homeowners who modified their mortgages in 2009 through the Home Affordable Modification Program, or HAMP. Next year, more than 290,000 homeowners will see their rates reset. Eventually, the majority of homeowners who have received a HAMP refinance will pay more for their mortgages.