The week so far

First, thanks to all for contributing to the record $41 million raised this year for Dana Farber by the PMC!!!

This all directly funds the discretionary research that makes Dana Farber what they are- the best!

If you are looking for good news on the economy don’t read the rest…

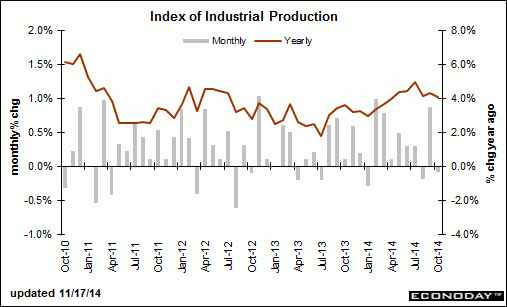
Industrial Production

ip-table-2

ip-oct

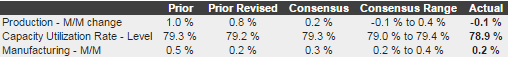
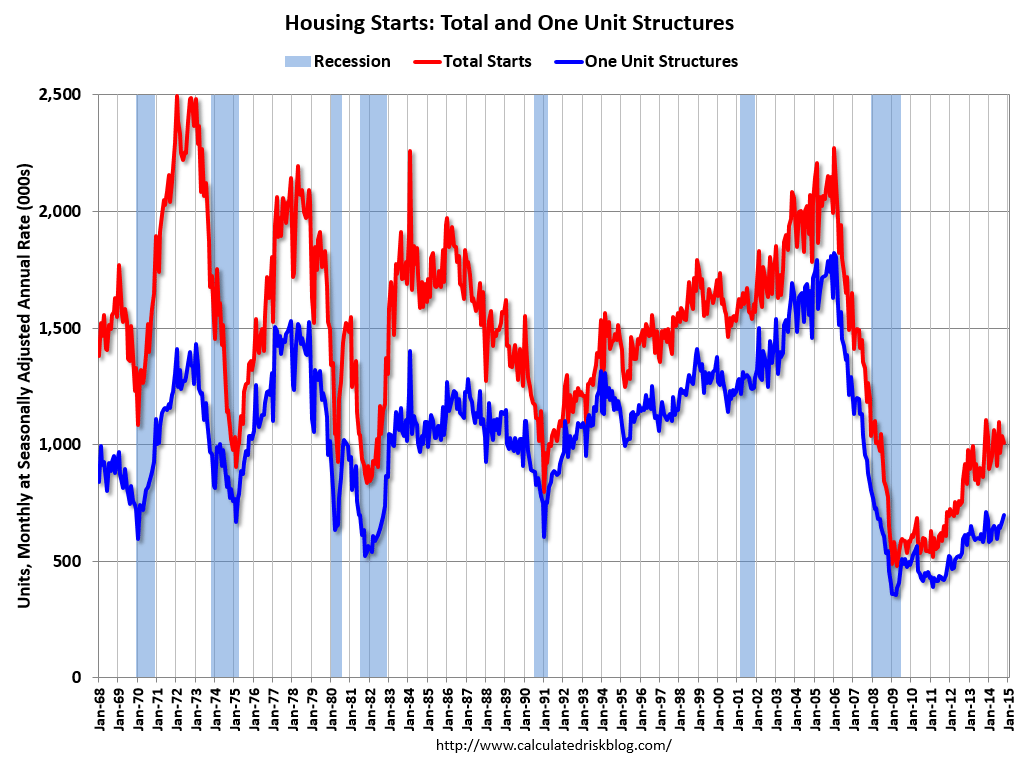
The builders may be a bit more optimistic than before, and there are fewer of them, but housing starts and sales remain weak a about half the usual rate for this point in the cycle,
and a higher % are the smaller/cheaper multifamily units:

Housing Market Index
hm-index

Housing Starts
housing-starts-oct

housing-starts-oct-graph

StartsOct2014
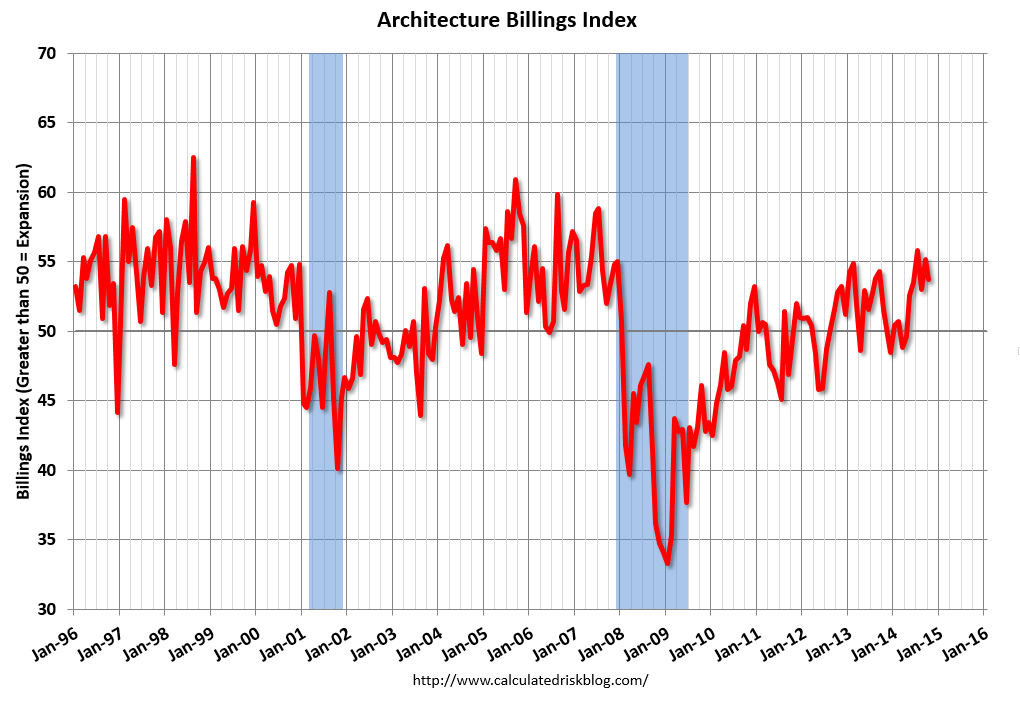
The architectural index slowed some and remains at relative weak levels:
ABIOct2014

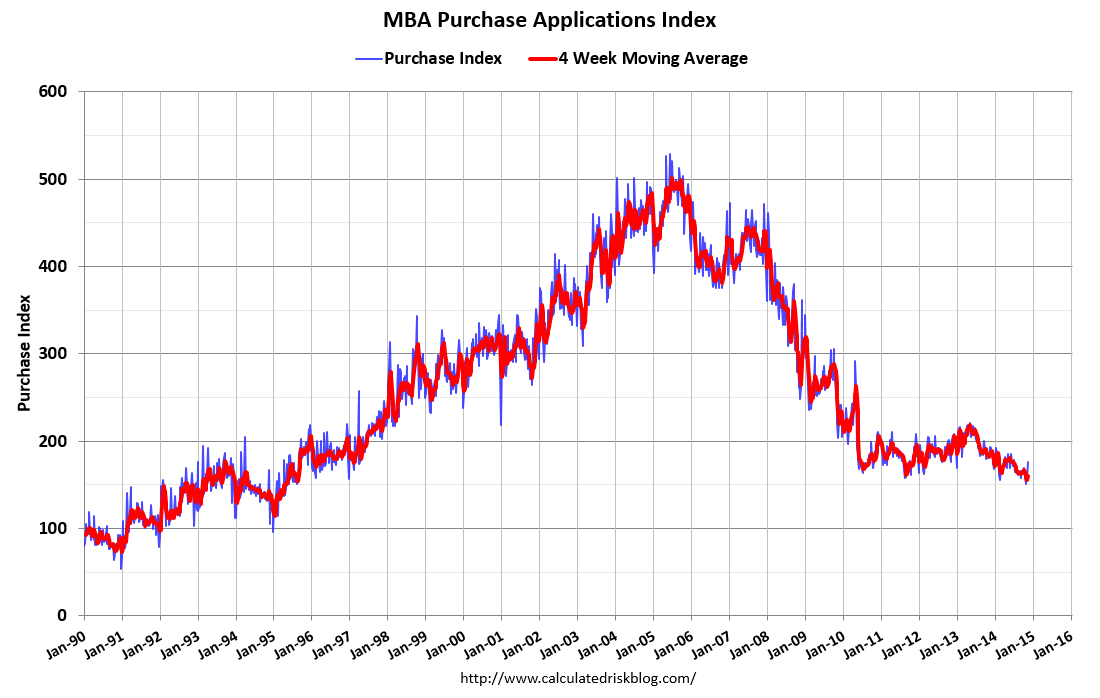
And mtg purchase apps were up some due to seasonal adjustments but remain down 6% year over year:

MBANov192014

Again, seems nothing is growing faster this year vs last year, which as a point of logic means overall growth is less than last year.

And reports of capital spending cuts on energy related investments continue to be reported, while money saved by consumers at the pump is not yet
translating into spending elsewhere.

Exports remain under pressure as well, including reports of containers for export at Long Beach way down, etc.

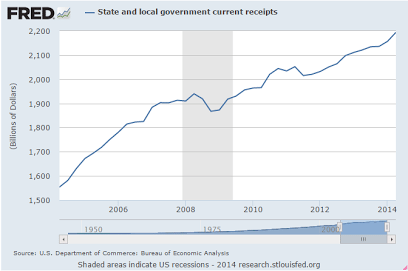
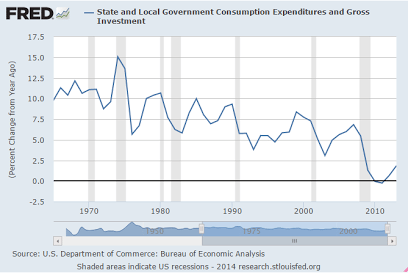
Q3 GDP had two ‘suspect’ prints that added 2% to Q3’s 3.5% GDP print- an outsized export increase and an outsized govt spending increase, both of which historically ‘mean revert’ with the subsequent report. So excluding those two, Q3 would have only grown by 1.5%, and Q4, if anything, is so far slowing some since Q3. So if the two suspect releases do revert, Q4 could easily be negative.

Small bus optimism index, wholesale inventories and trade

Going nowhere as it struggles to maintain what were the recession lows of prior cycles:

NFIBOct2014

Wholesale Trade
wholesale-trade
Highlights
Wholesale inventories, up 0.3 percent in September, held steady relative to sales at only a slightly elevated level. Wholesale sales rose only 0.2 percent in the month, keeping the stock-to-sales ratio in the sector unchanged at 1.19, a reading that is at the high end of recent trend.

Wholesale auto inventories, which rose heavily relative to sales in August, fell back slightly, to a ratio of 1.58 from 1.59. Unit vehicle sales, released last week by manufacturers, firmed slightly in September which suggests that wholesale auto inventories may be a little on the light side right now which is good news for manufacturers.

Apparel wholesale inventories also lightened up as did hardware inventories. But there are sectors showing unwanted builds including computers, machinery, drugs, and paper products.

Data released last week in the factory orders report showed no unwanted inventory pressures for manufacturers in September. The missing piece for September inventories, retail inventories, will be released Friday with the business inventories report. Lean levels of inventories may be a negative for GDP calculations but are a plus for the production and employment outlooks.

mortgage purchase apps

Up 1% for the week, but down 11% vs same week last year.

Back to where we were some 20 years ago when the economy was bad and the population was a whole lot lower…

MBA Purchase Applications
mba-11-12
Highlights
Low mortgage rates have yet to give much of a lift to purchase applications for home mortgages. The purchase index rose only 1.0 percent in the November 7 week and is down 11 percent from a year ago. The year-on-year rate is little changed from September when rates started to move lower. The refinancing index did move higher earlier but has been in retreat in recent weeks, down a sharp 11.0 percent from the prior week. The average rate for 30-year conforming mortgages ($417,000 or less) rose 2 basis points in the week to 4.19 percent.

MBANov122014

State and local govt charts


The bulk of the boost is coming from state and municipal governments. After tightening their budgets for three years following the end of the recession, they began stepping up spending in 2013 and continued to do so this year

Except state taxes are growing faster, a headwind for the private sector.

But income taxes down- not sure why.

state-local-govt-1

Not sure what this is about either:

state-local-govt-2

Total tax collections still rising:

state-local-govt-3

state-local-govt-4

Up some but still historically low:

state-local-govt-5

Very minor increases here:

state-local-govt-6

state-local-govt-7

Overall the states are still running deficits and are motivated eliminate them:

state-local-govt-8

Obama- small govt conservative champion!

Also interesting: For the first time since 2008, the public sector will add jobs in 2014.  State and local governments started adding a few jobs last year, but austerity has been ongoing at the Federal level.  According to the WSJ The Federal Government Now Employs the Fewest People Since 1966

Not since July 1966 has the federal government’s workforce been so small. … But that’s only the raw numbers! As a share of the total workforce … data going back to 1939 would show no point where the federal government’s share of employment was so low.

In the last 75 years (when the BLS started tracking the data), the public sector (non-military) shed jobs in 12 years. Three of those years were at the end of WWII, two in the early ’80s, and the last five consecutive years (unprecedented streak since the Great Depression).

capital expenditures

With energy investment now in decline due to the Saudi price cuts look for this component of GDP to head south, as yet another ‘borrowing to spend’ generator fails to sustain its growth rate and odds of negative Q4 GDP growth increase dramatically.

cap-ex-1

cap-ex-2

Shale Drillers Idle Rigs From Texas to Utah Amid Oil Rout

By Lynn Doan

Nov 7 (Bloomberg) — The shale-oil drilling boom in the U.S. is showing early signs of cracking.

Rigs targeting oil sank by 14 to 1,568 this week, the lowest since Aug. 22, Baker Hughes Inc. (BHI) said yesterday. The Eagle Ford shale formation in south Texas lost the most, dropping nine to 197. The nation’s oil rig count is down from a peak of 1,609 on Oct. 10.

Posted in Oil

Credit check- more deceleration

For the economy to grow more this year than last year, on average the ‘pieces’ need to grow at higher rates, which isn’t happening as previously discussed.

And underneath it all, for every agent that spends less than his income (demand leakages) another has to spend more than his income, or the output doesn’t get sold.

For all practical purposes, ‘spending more than income’ comes down to ‘borrowing to spend’ rather than depleting ‘savings accounts’ to spend.

And with the largest agent that spends more than its income- government deficit spending- on the decline, we need ‘borrowing to spend’ to increase that much more to sustain positive GDP growth.

Unfortunately the growth rate of credit expansion looks to be going the wrong way.

Bank lending:
cc-1

cc-2

cc-3

cc-4

cc-5

cc-6

cc-7

cc-8