Housing, unemployment claims, durable goods orders, corporate profits, inventories, commodities

Another hint at a cooling housing market:

Nearly double pre covid levels indicating a lot of people are still losing jobs every week:

This chart is not adjusted for inflation. On an inflation adjusted basis it remains way below previous cycle highs:


Profits seem to have flattened again:


Inventories are growing/being restored from covid related disruptions:


This is only through April:


Covid disruption/dip followed by recovery that seems to be running its course:

CPI, lumber

A rise in prices from an external shock can result in a slowdown of consumption, but to date fiscal transfers have worked to sustain incomes that support consumption. Expiring federal unemployment comp will remove some of that support, and we have a backdrop of a Fed 0 rate policy which itself is a deflationary bias:

Lumber price made the news a lot more when they were going up than when they started going down:

Expiring unemployment benefits, mtg purchase apps, trade, cpi

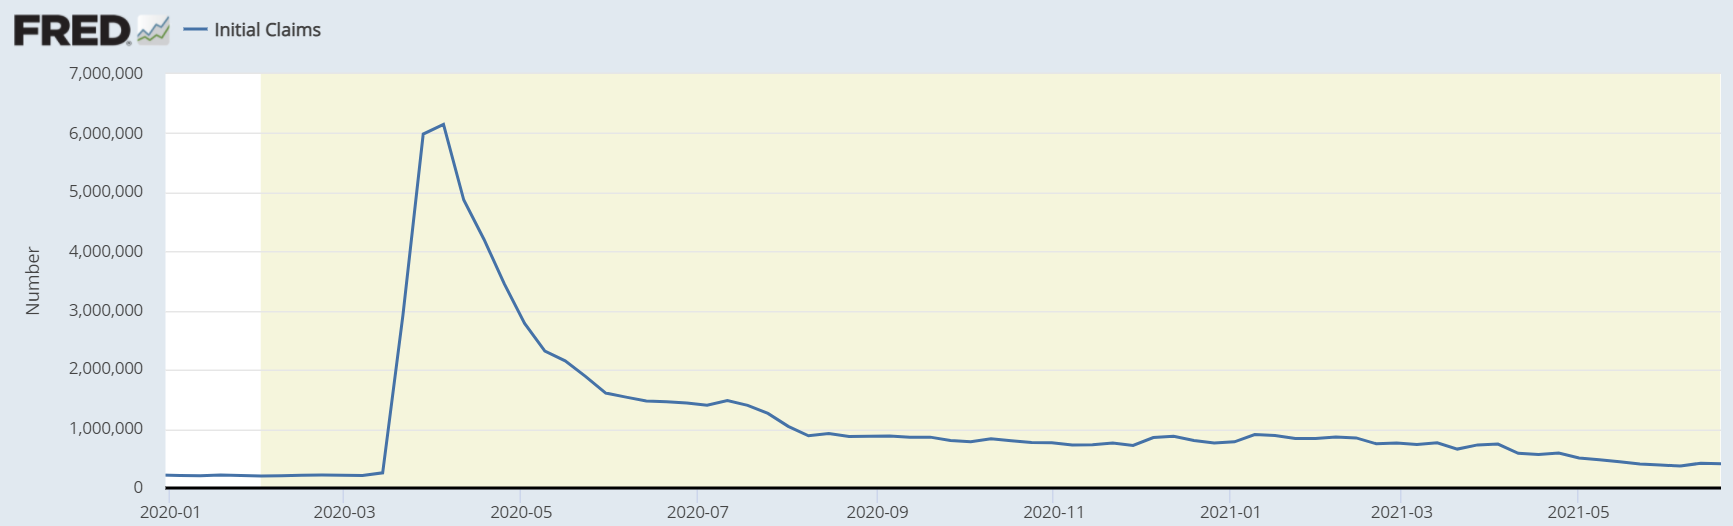
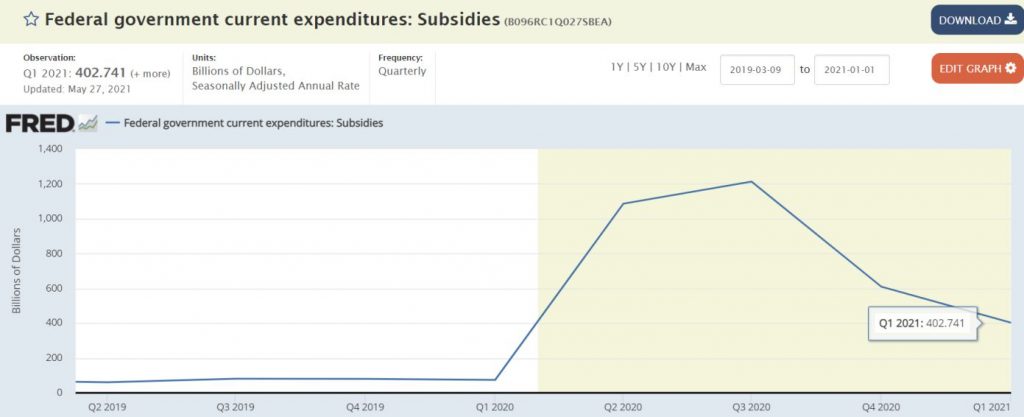
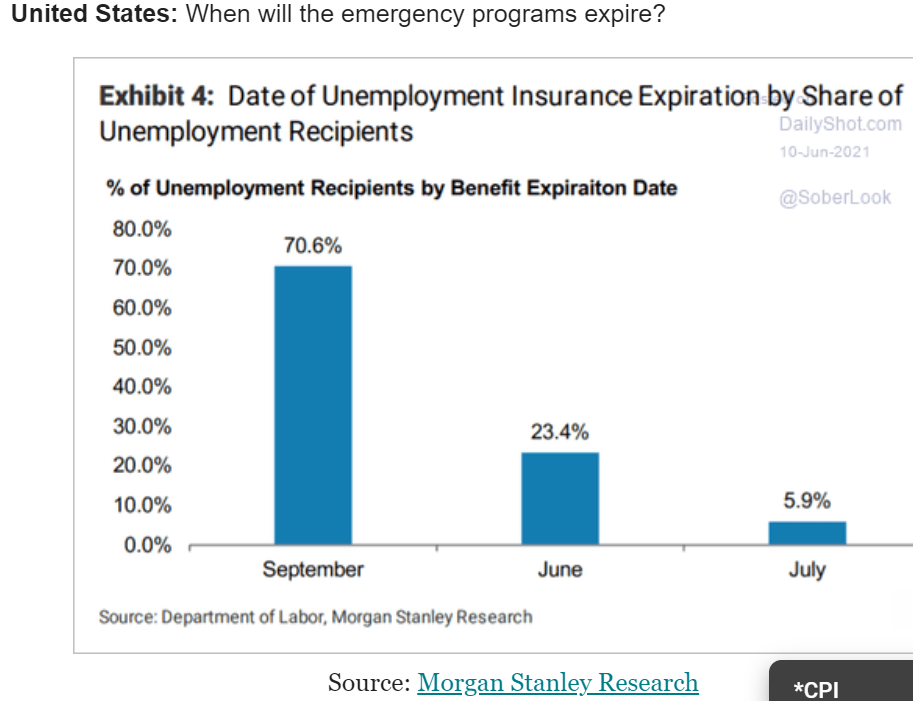
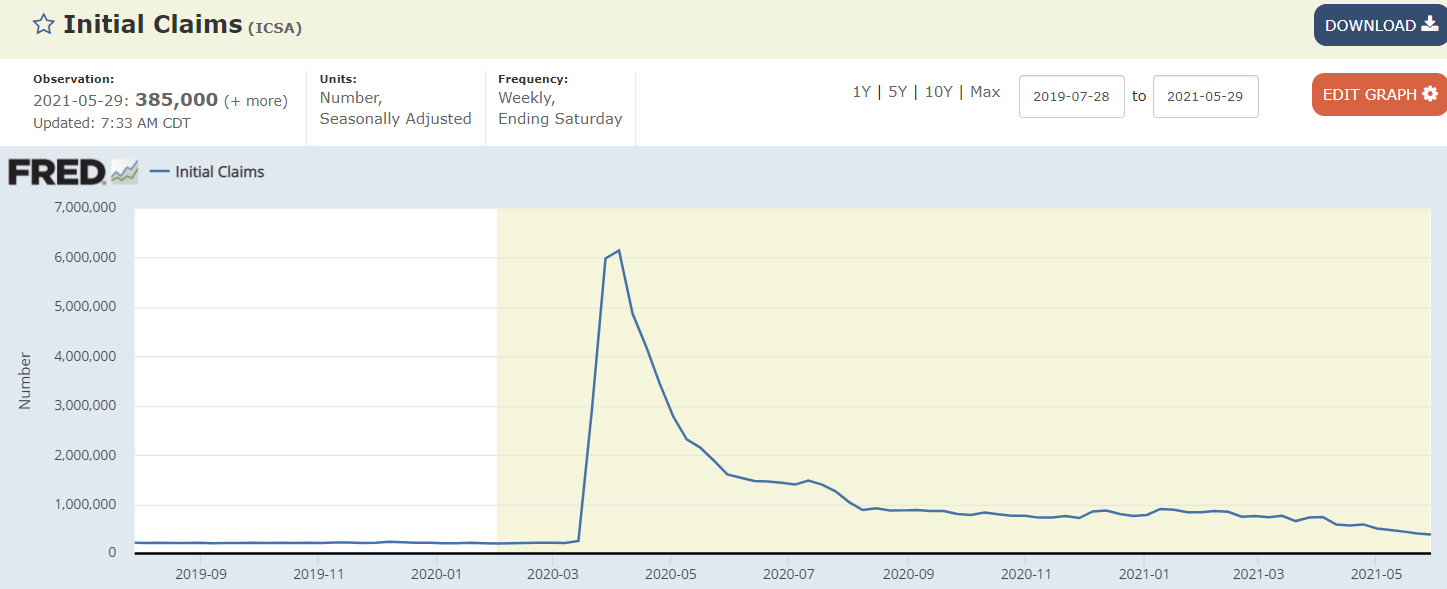
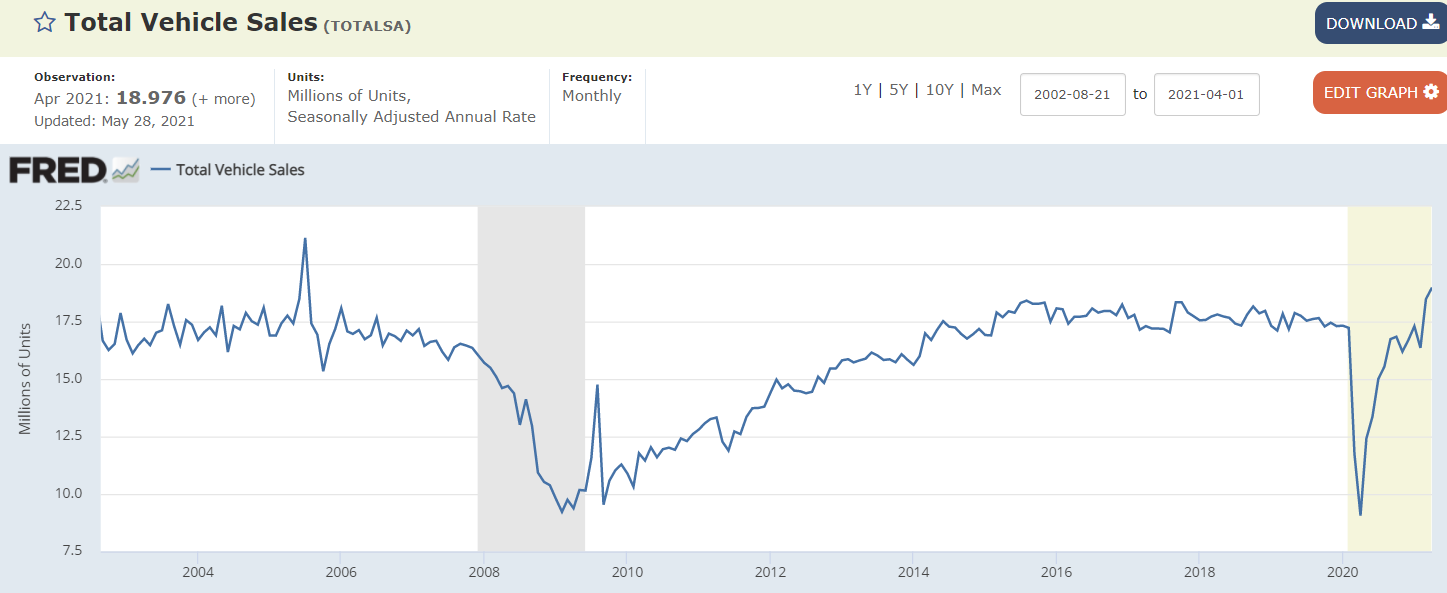
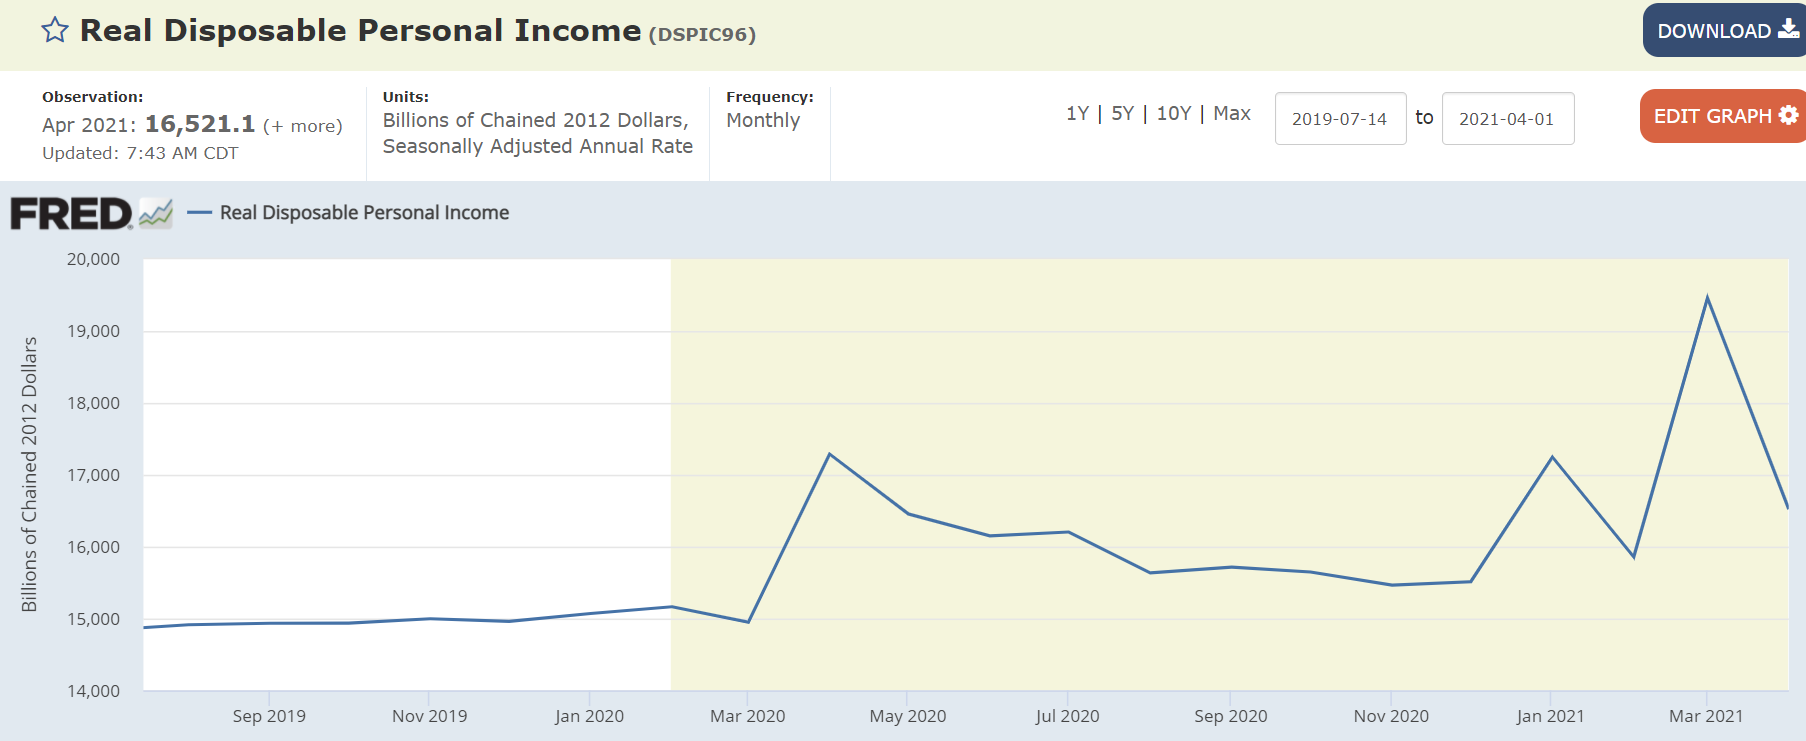
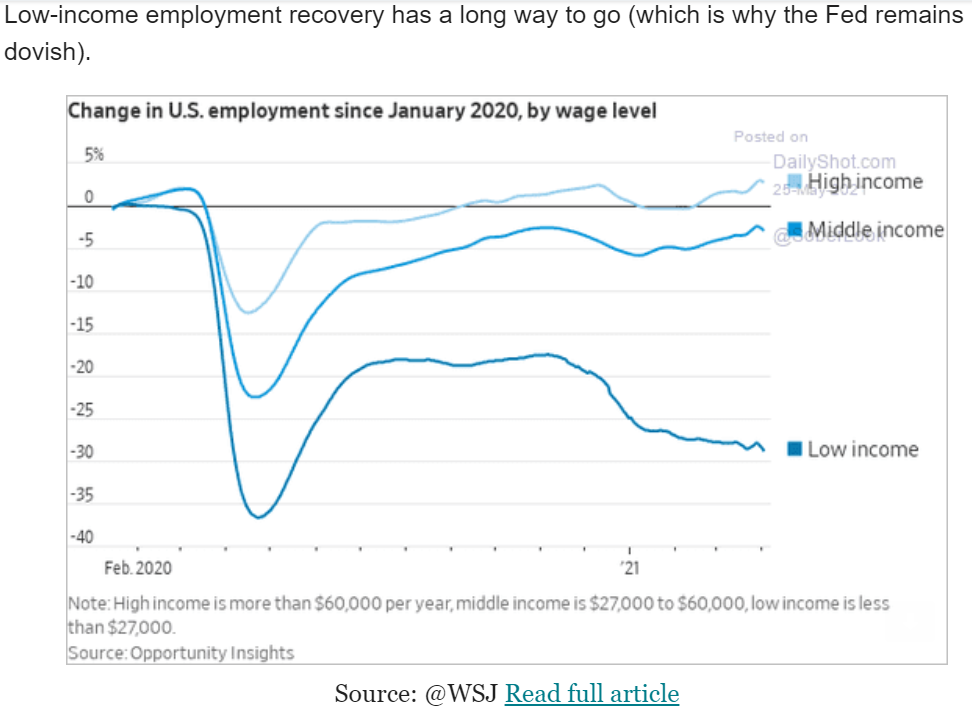
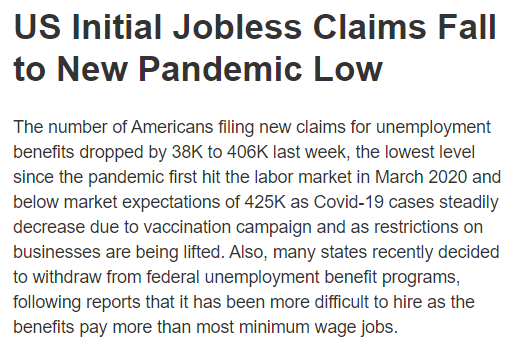
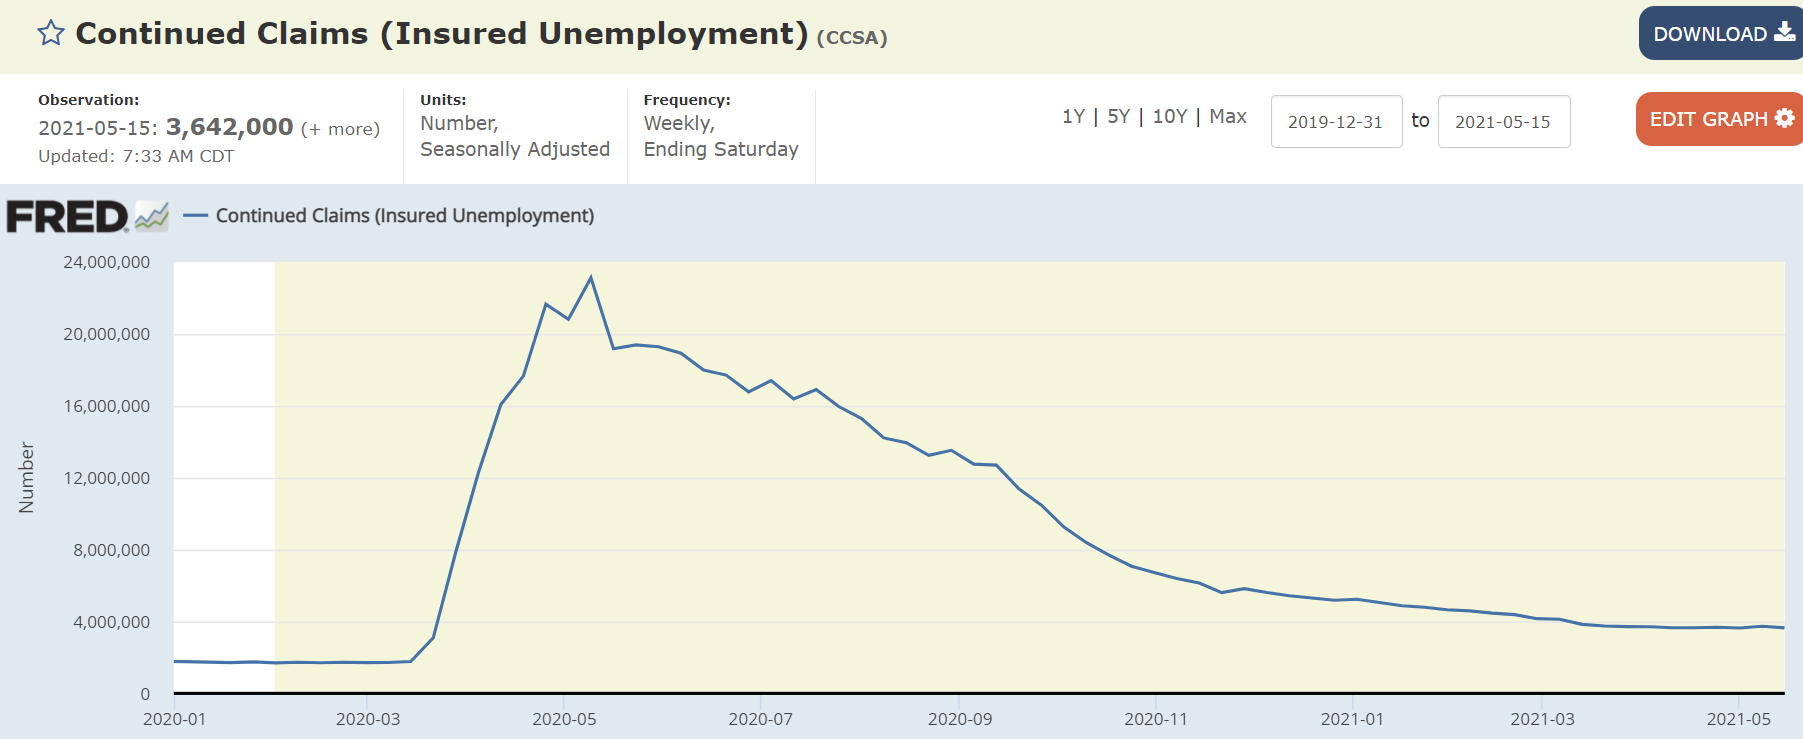
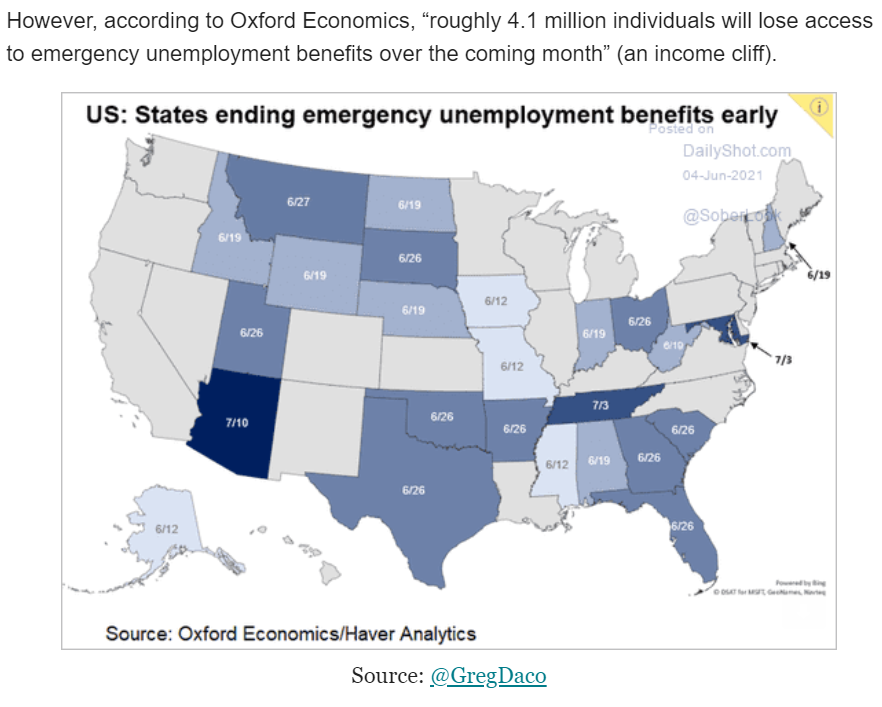
Soft spot in progress, and all federal unemployment benefits expire Labor Day:


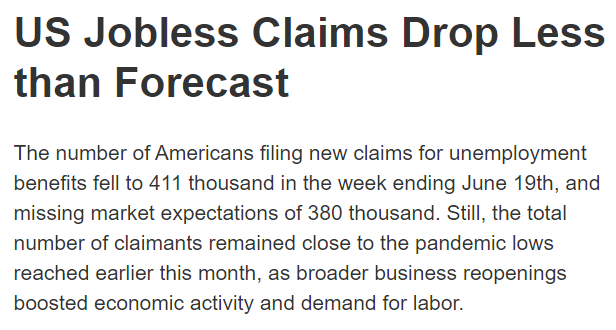
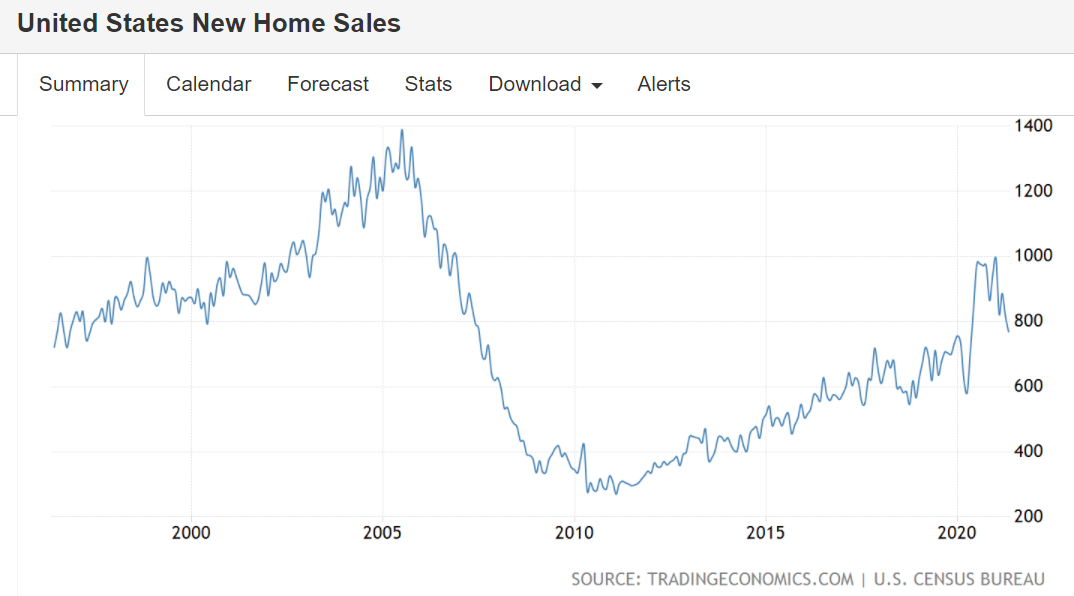
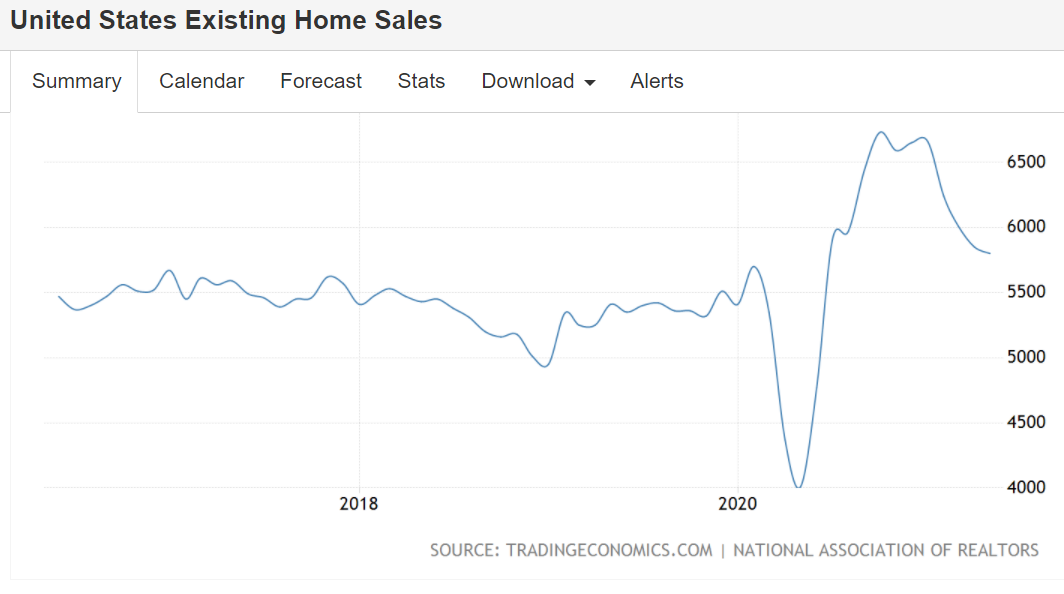
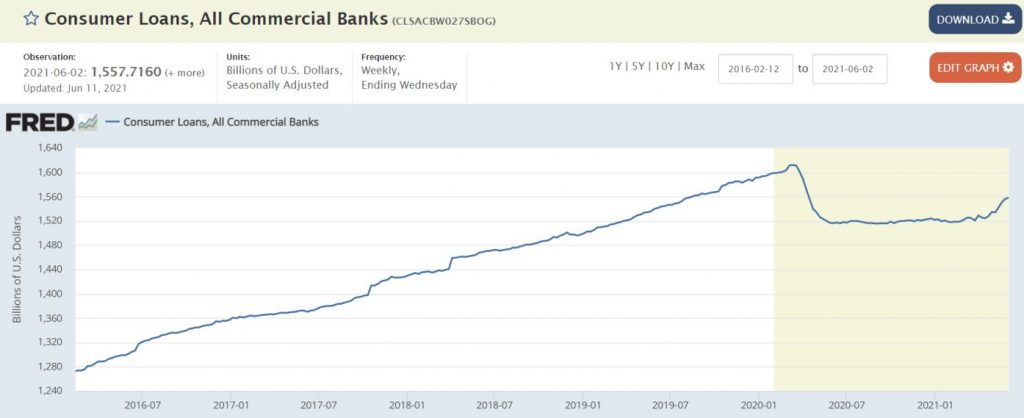
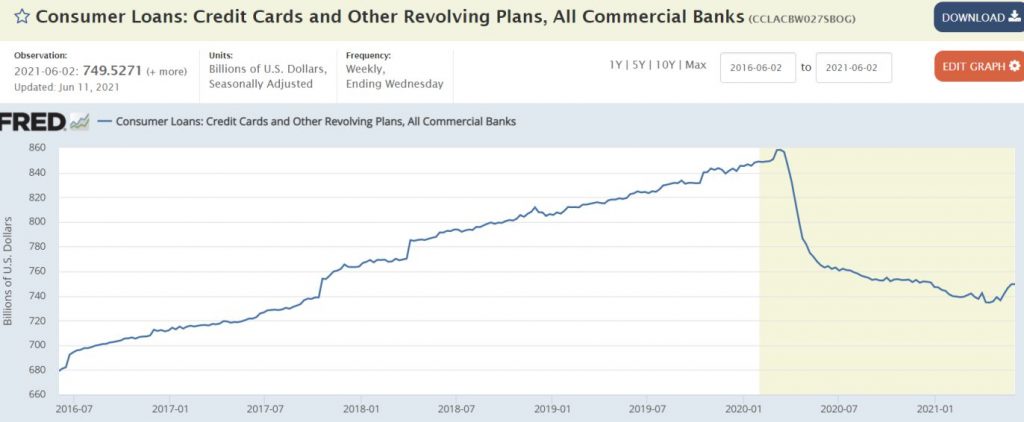
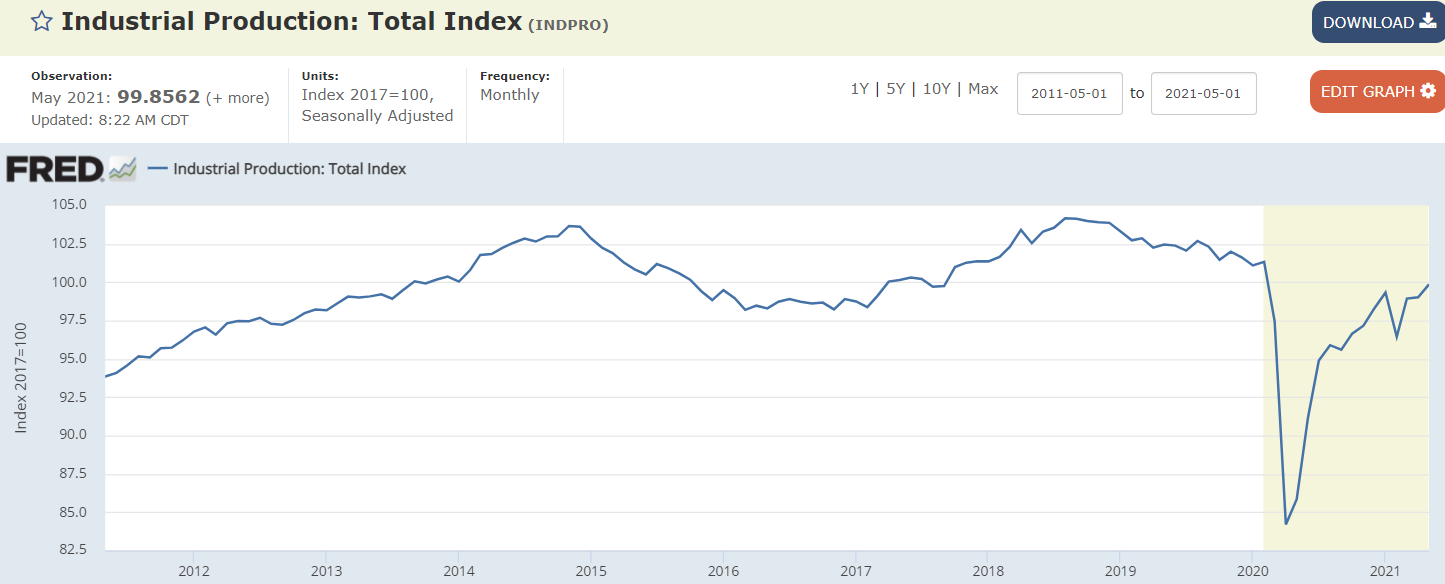
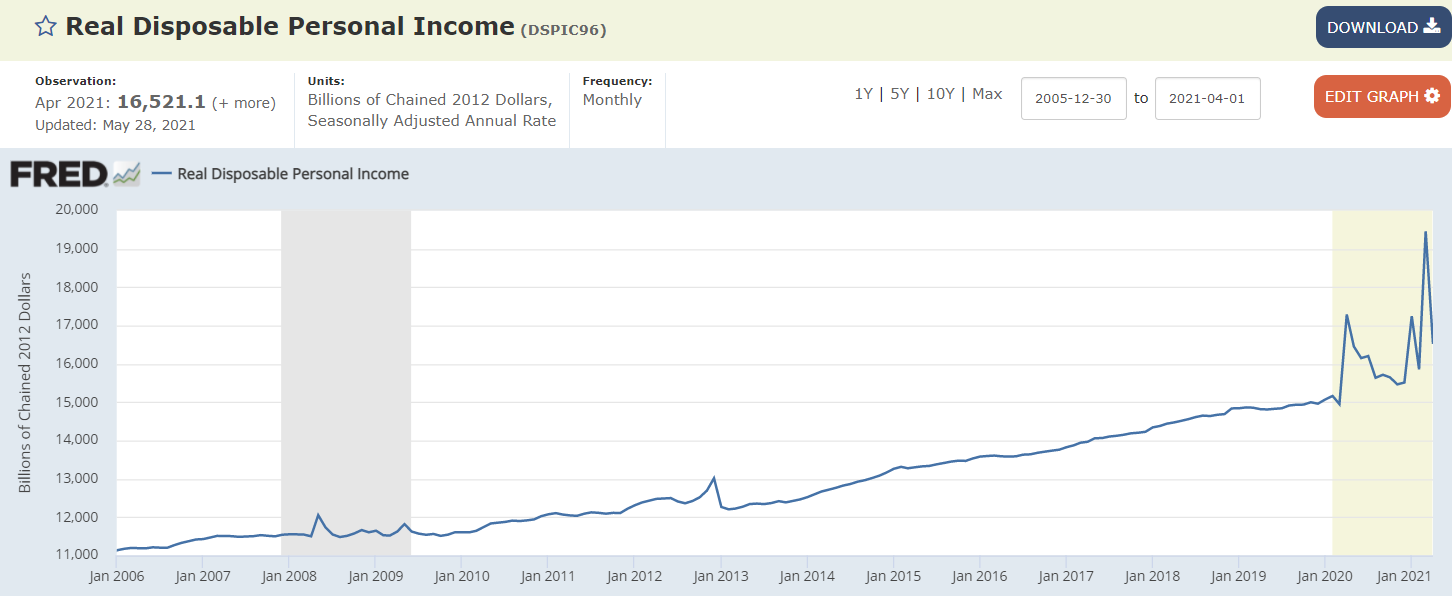
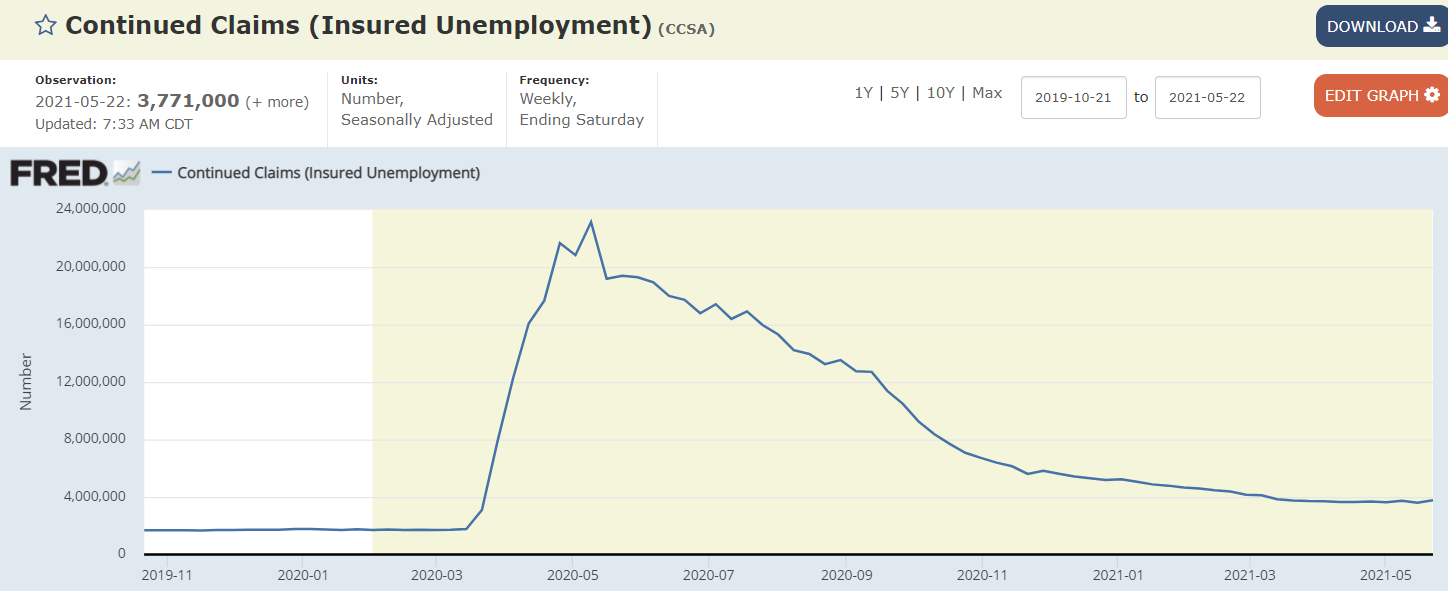
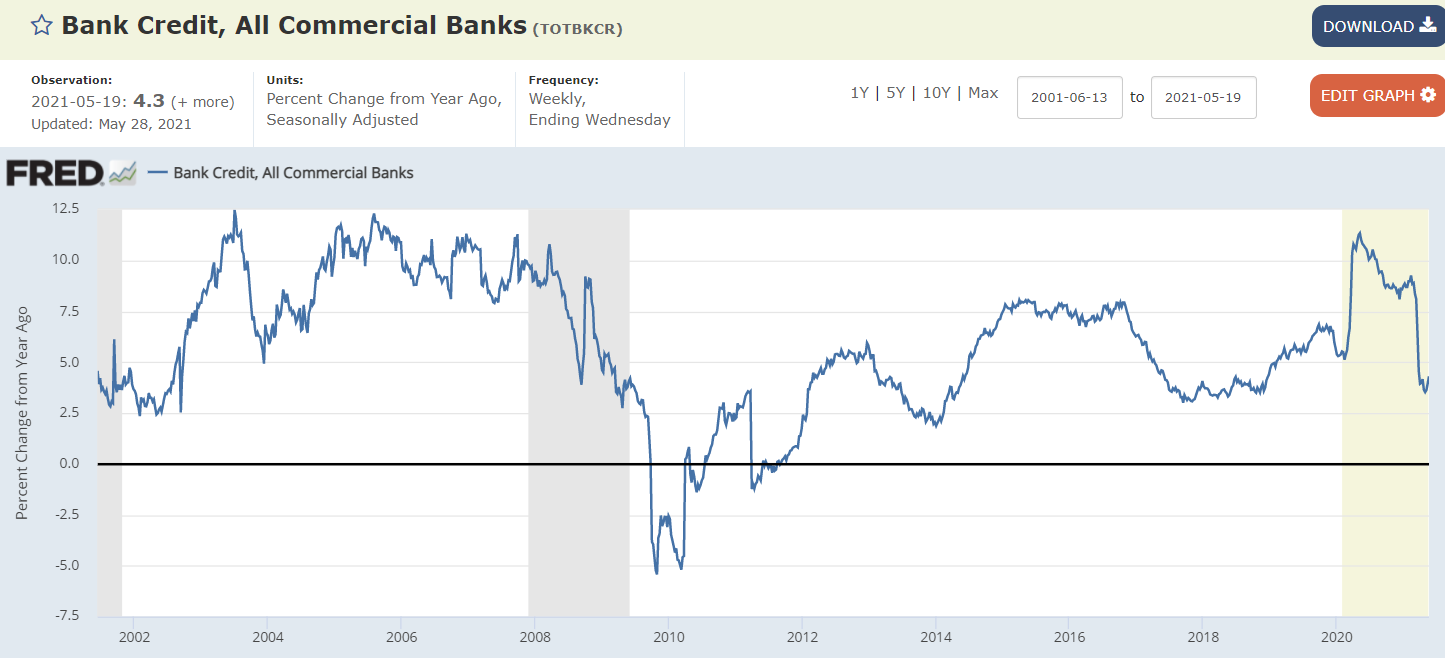
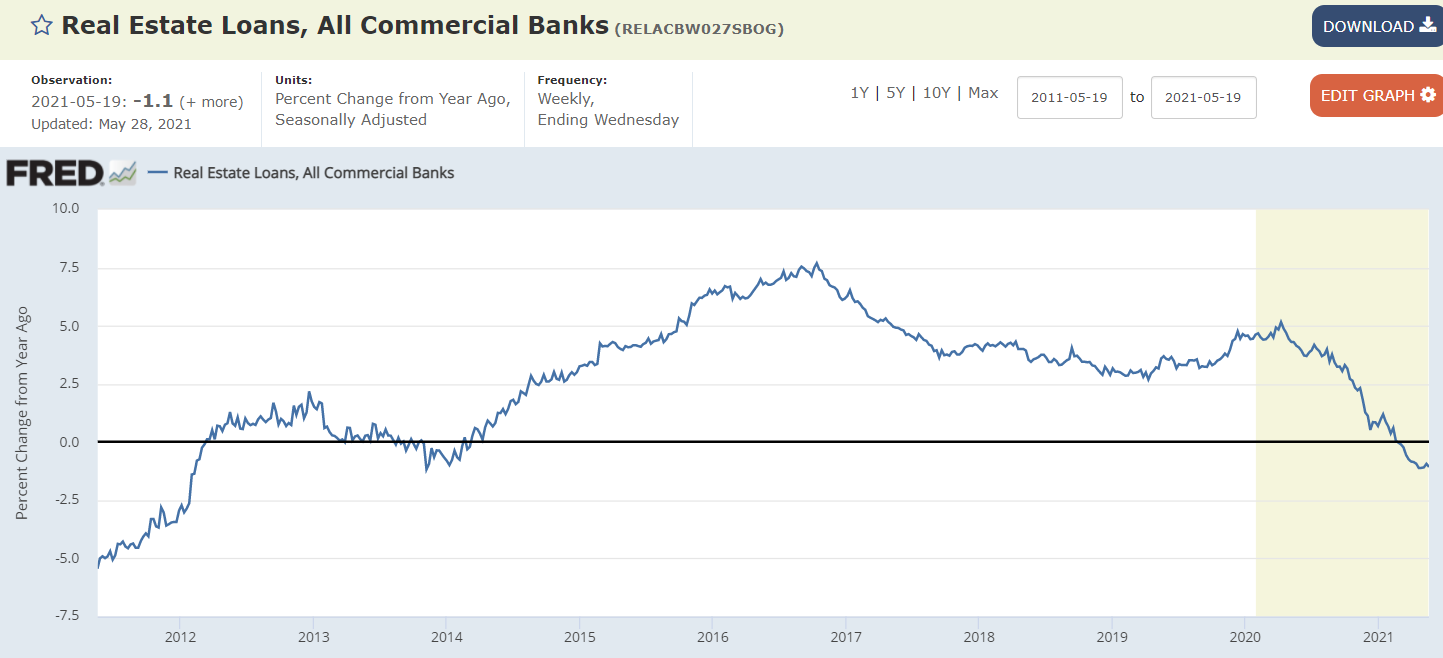
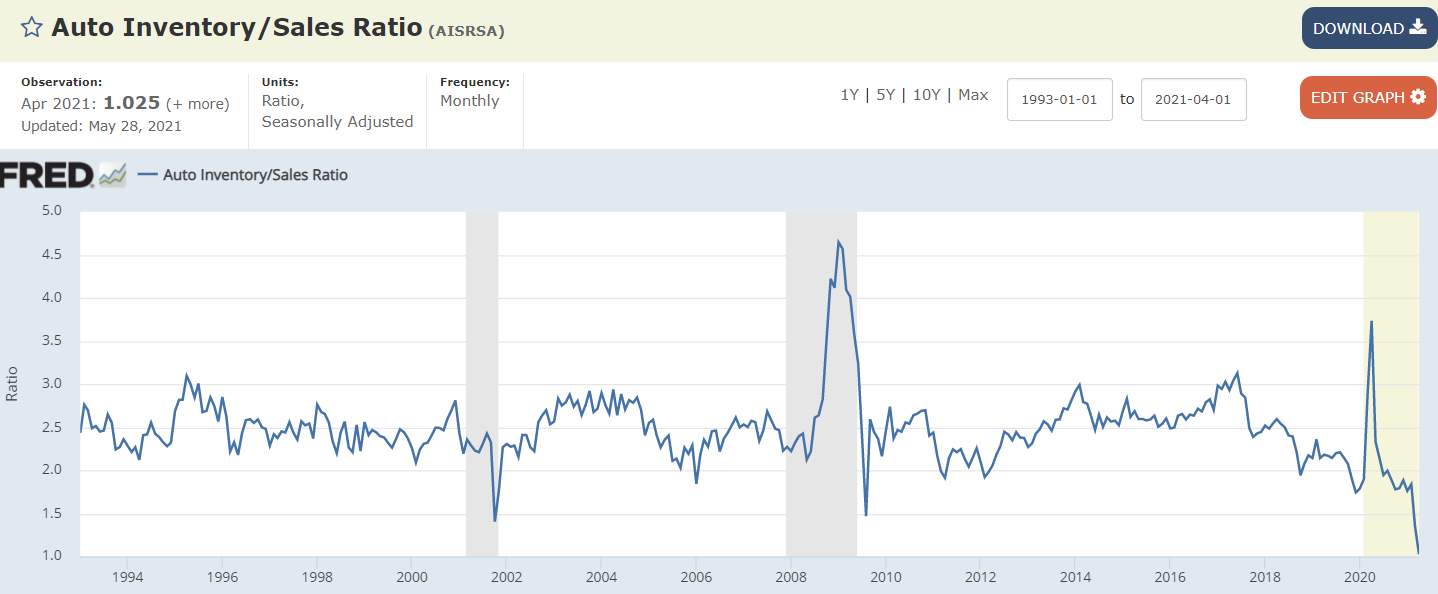
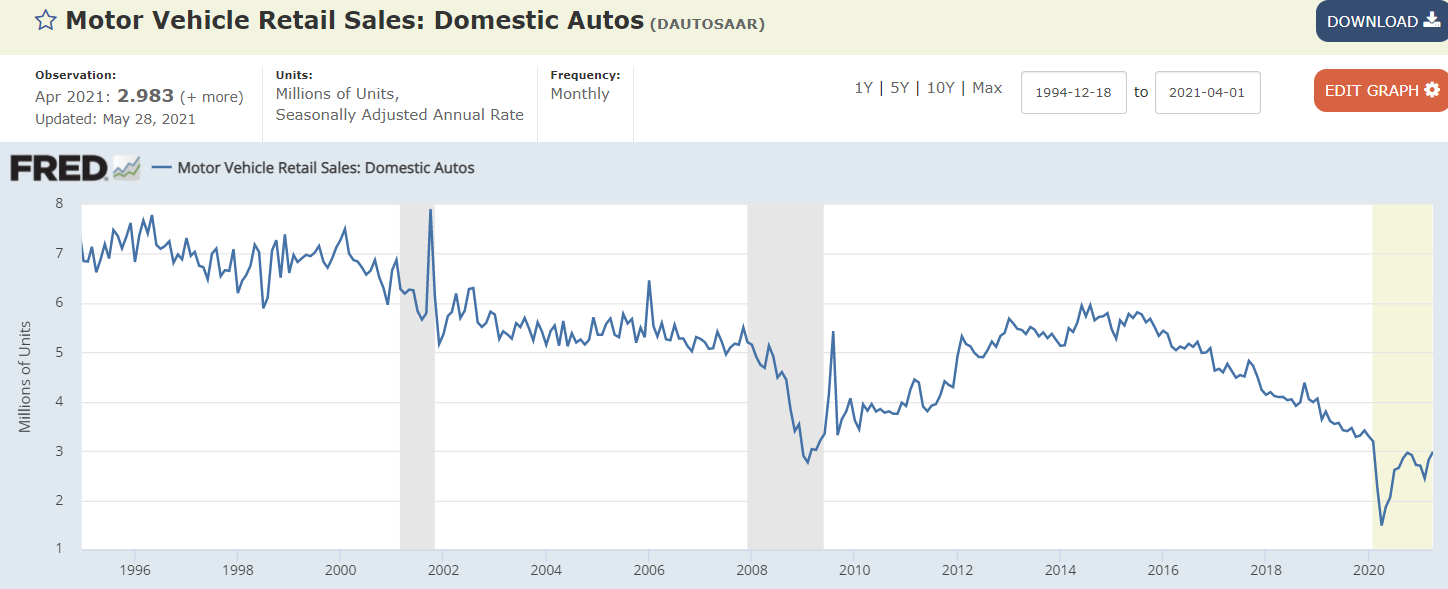
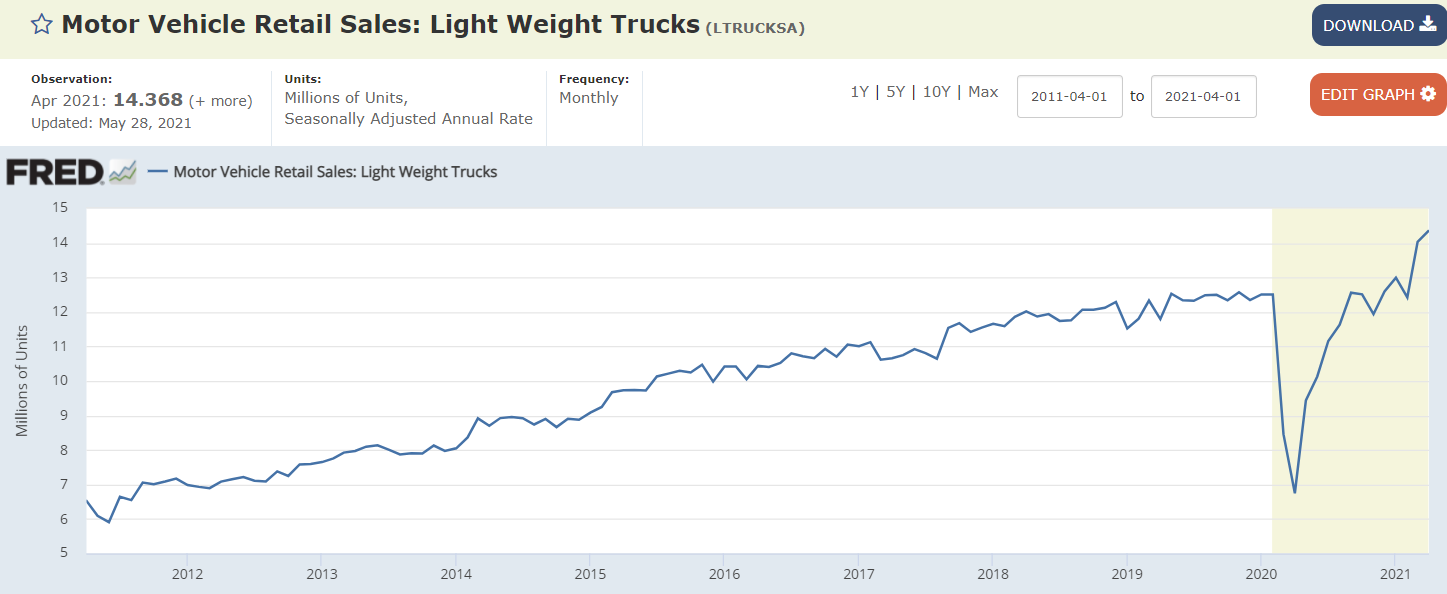
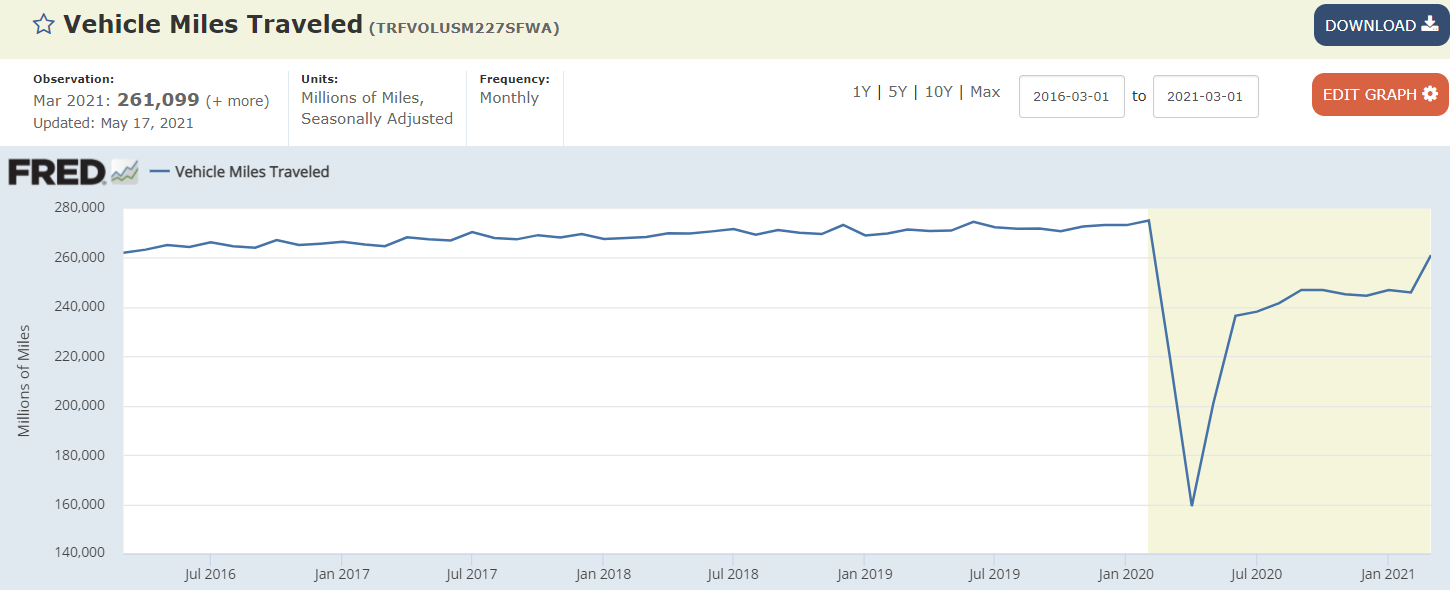
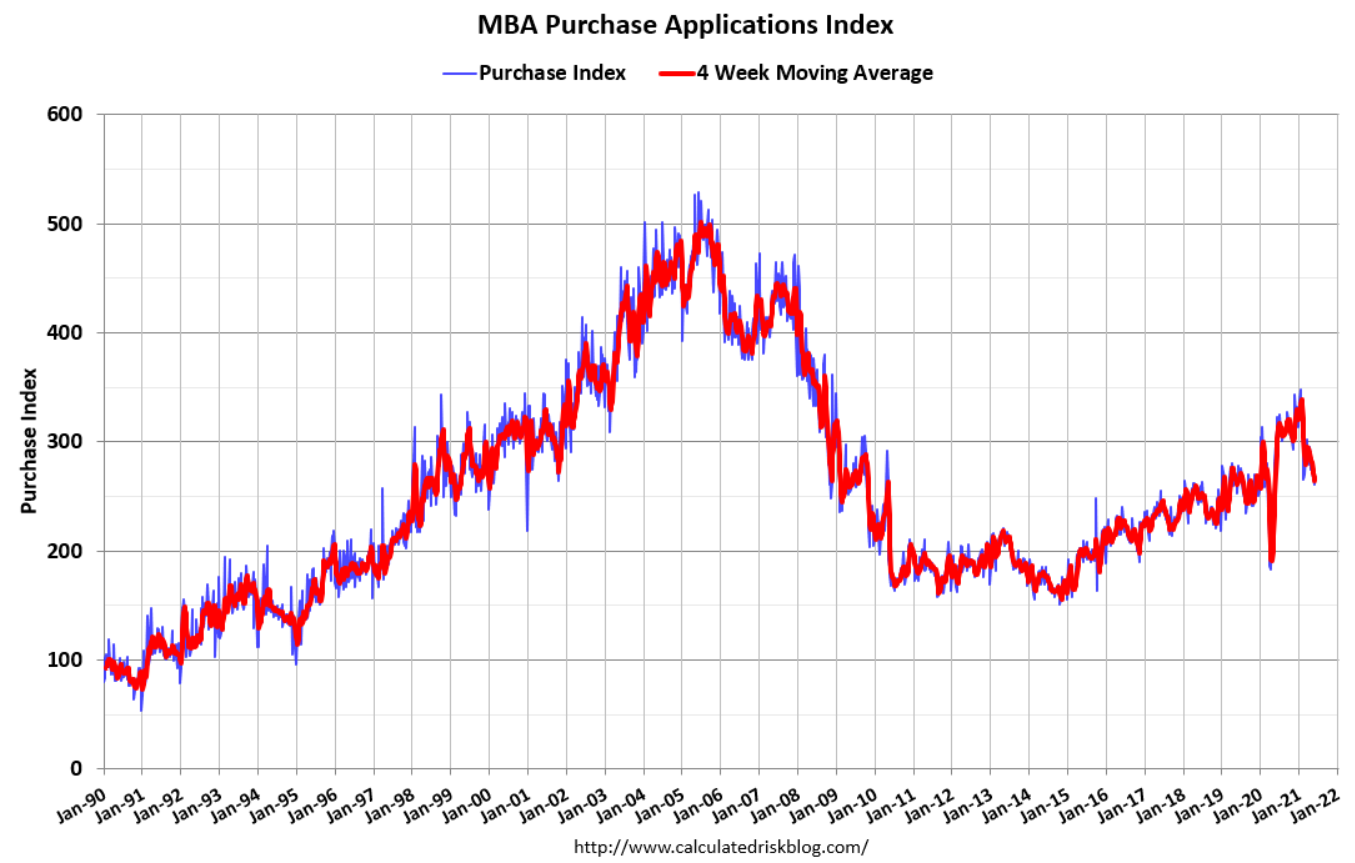
Still seems to be weakening:


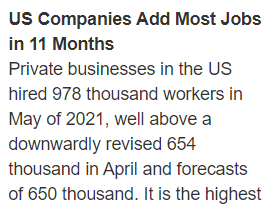
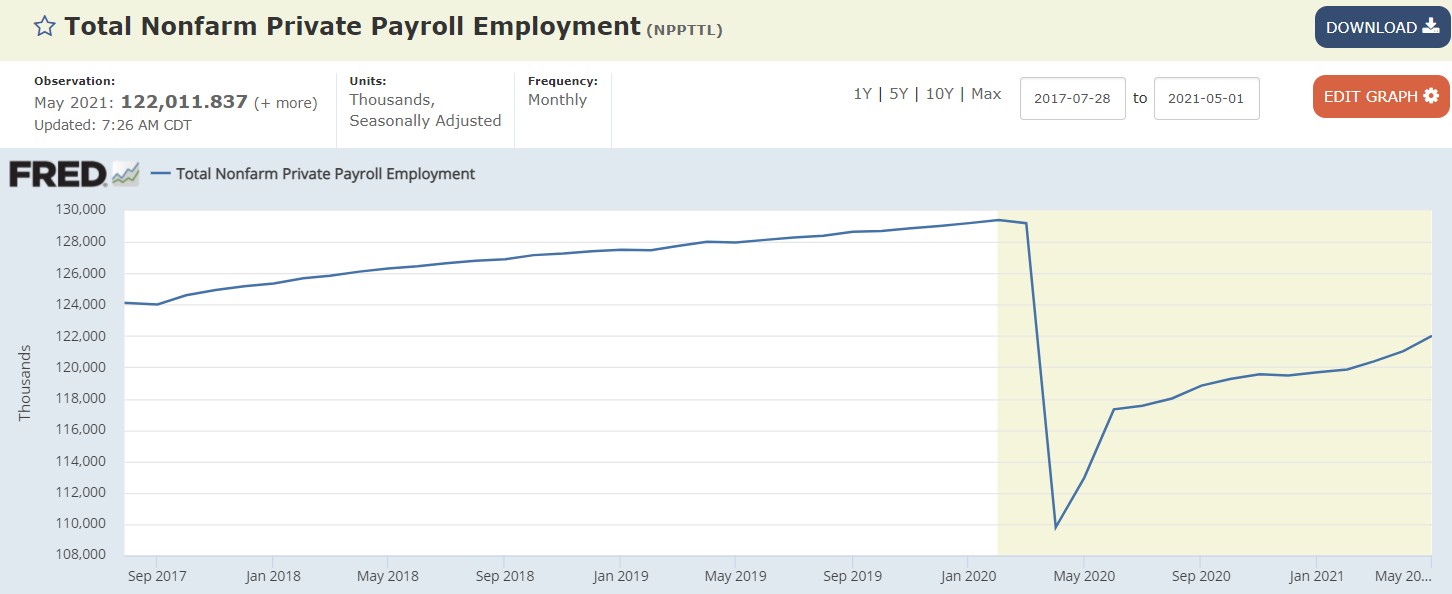
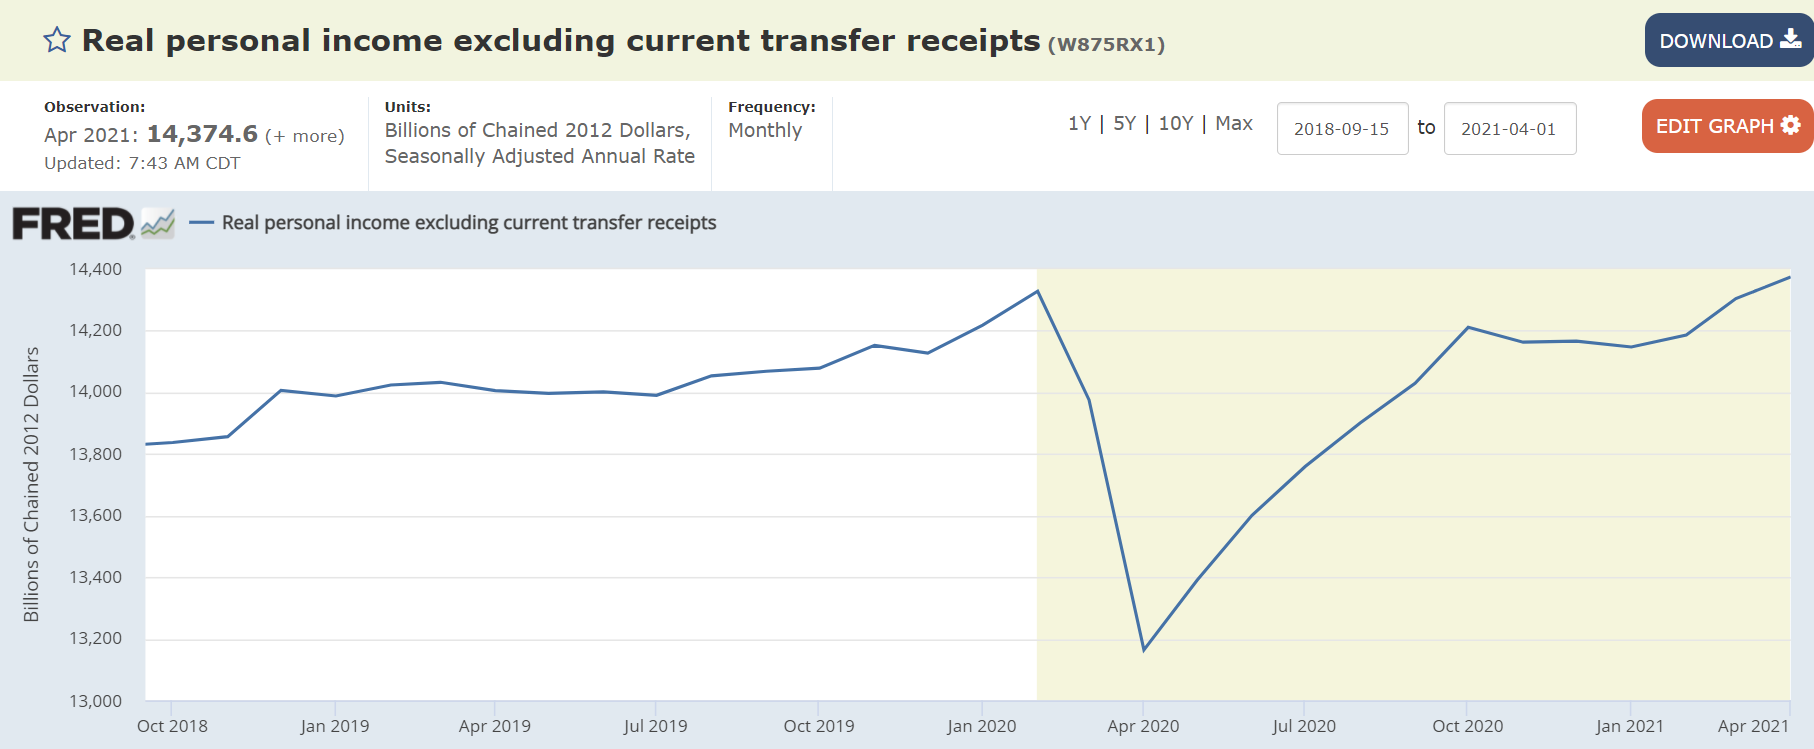
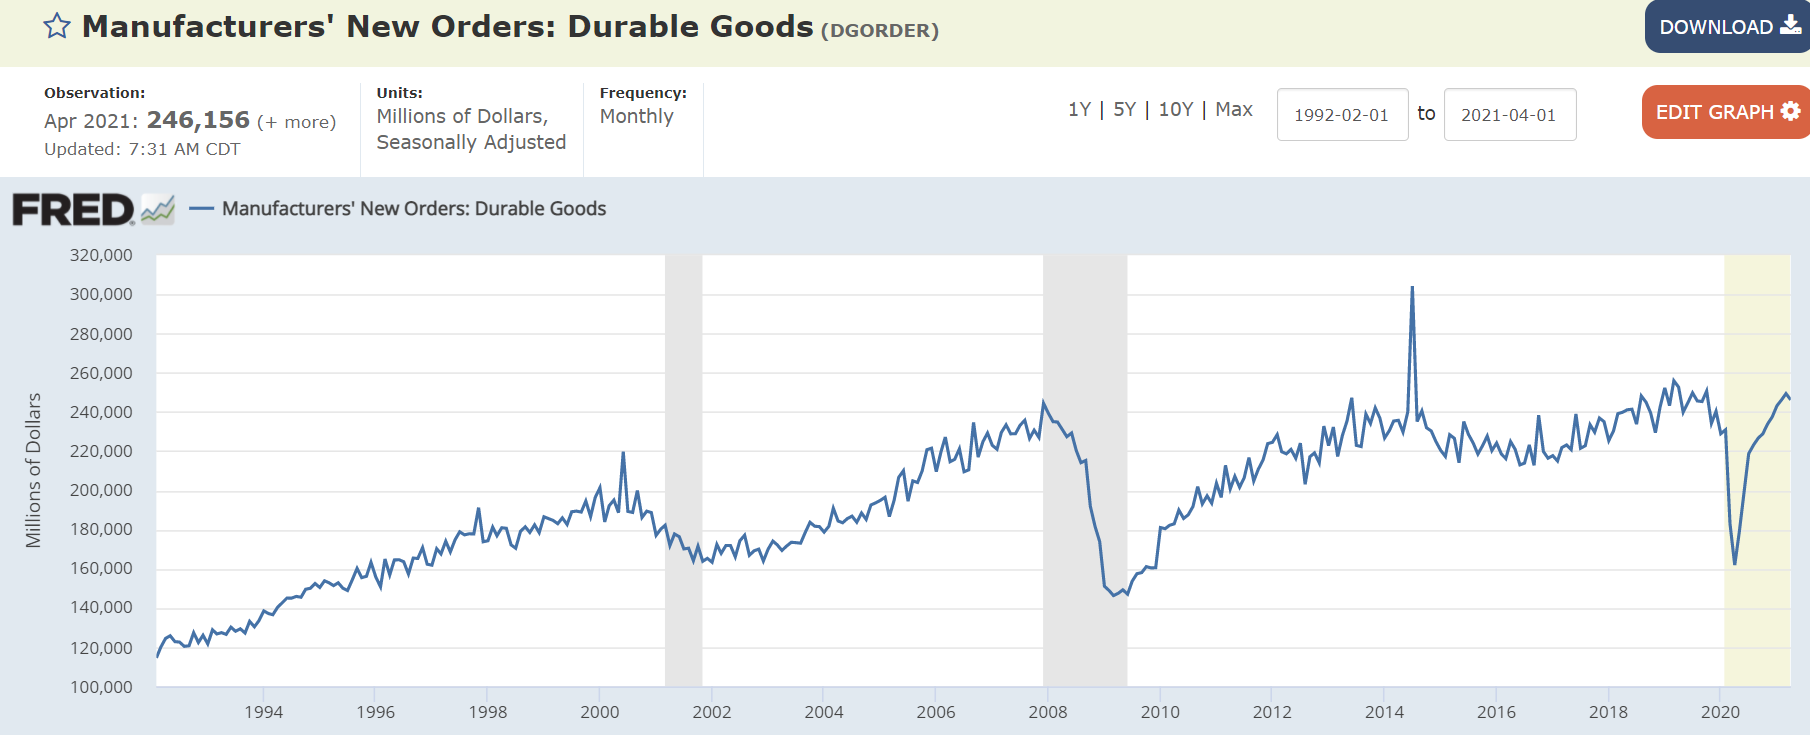
Job openings offsetting the prior dip as covid restrictions are relaxed. Hirings coming back as well, though not as quickly:

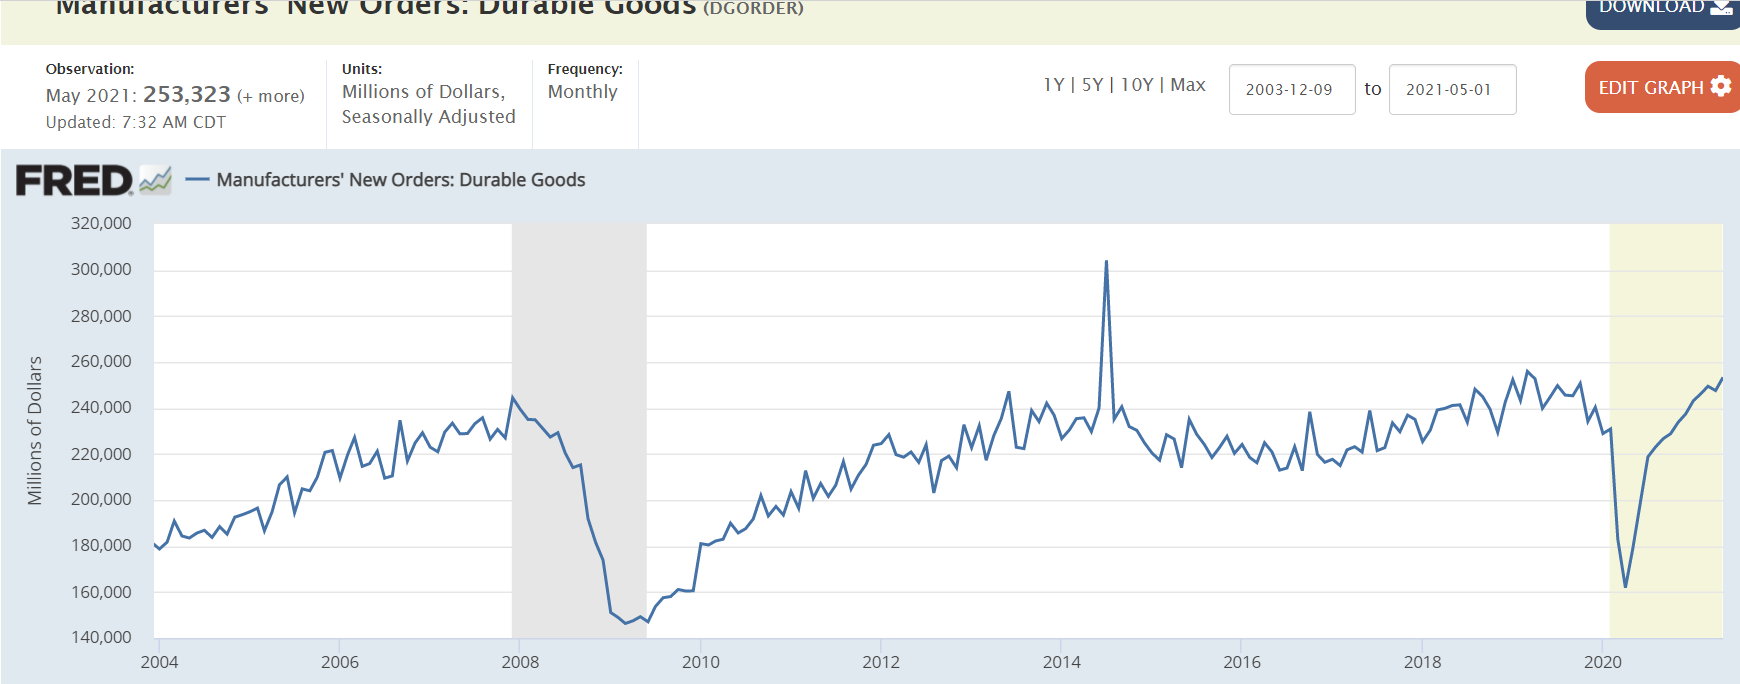
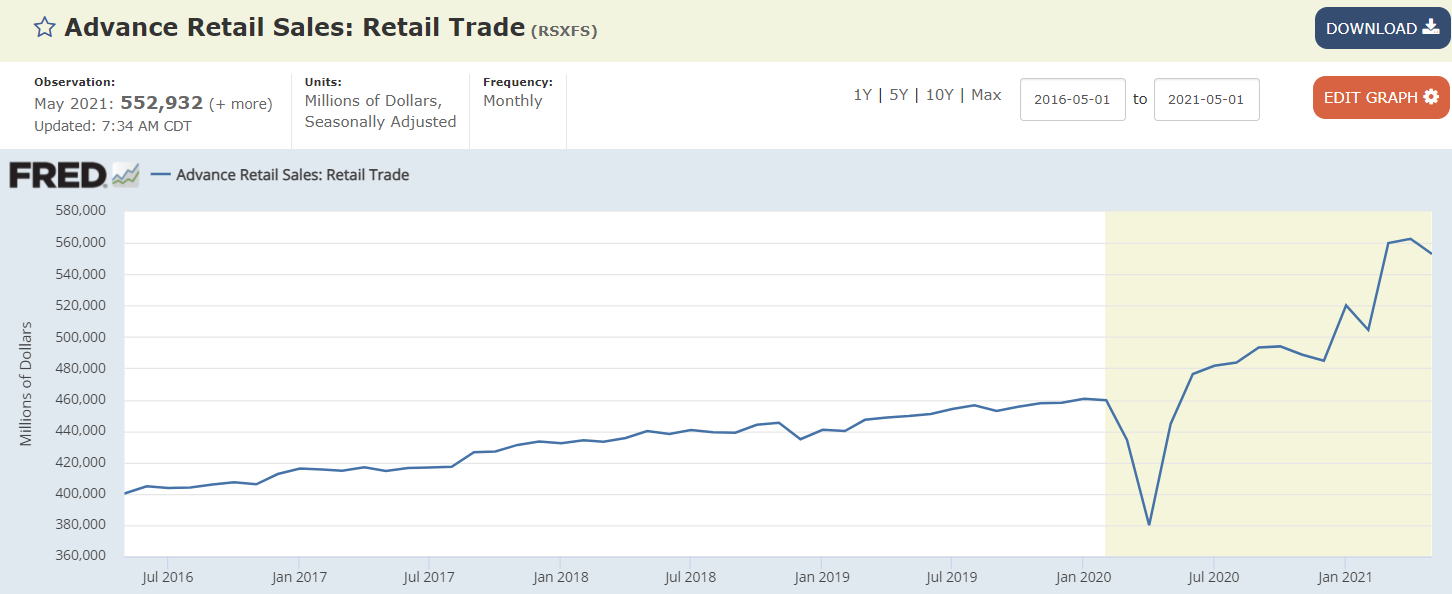
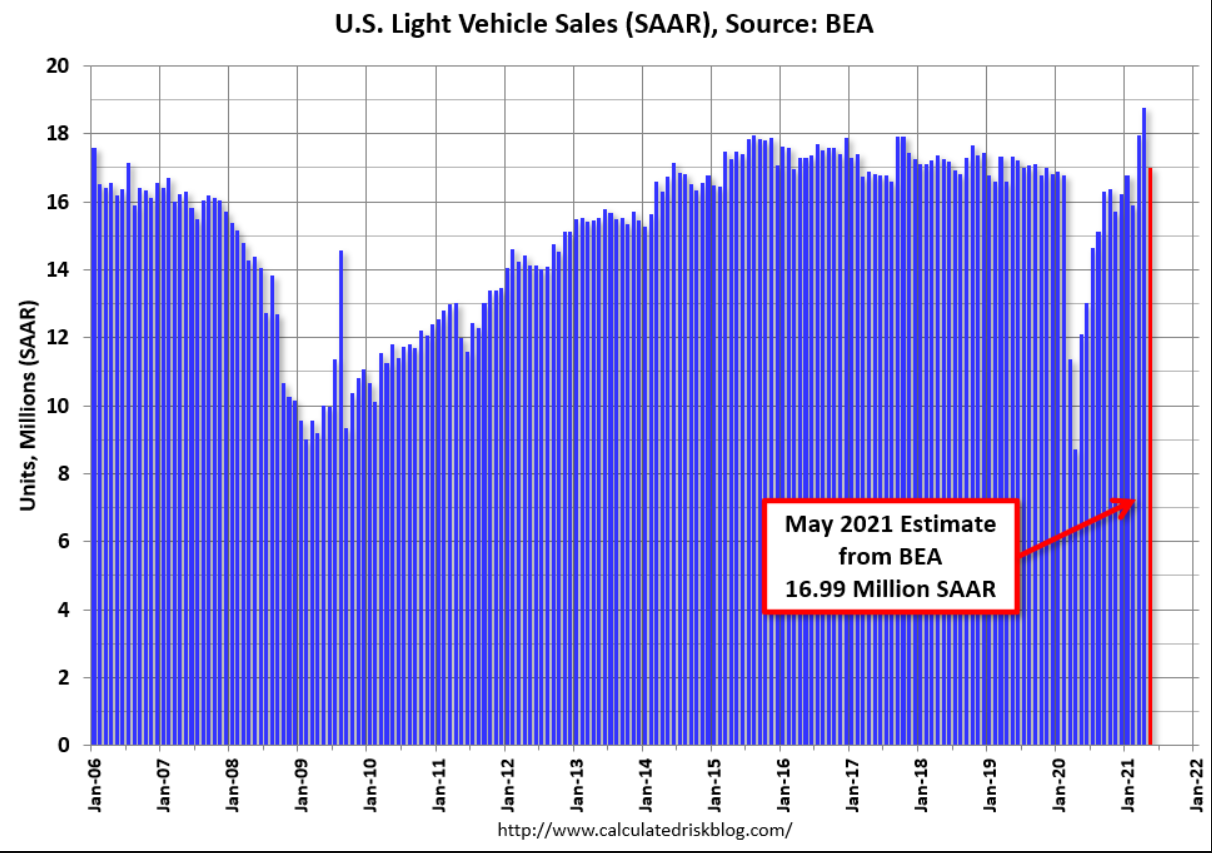
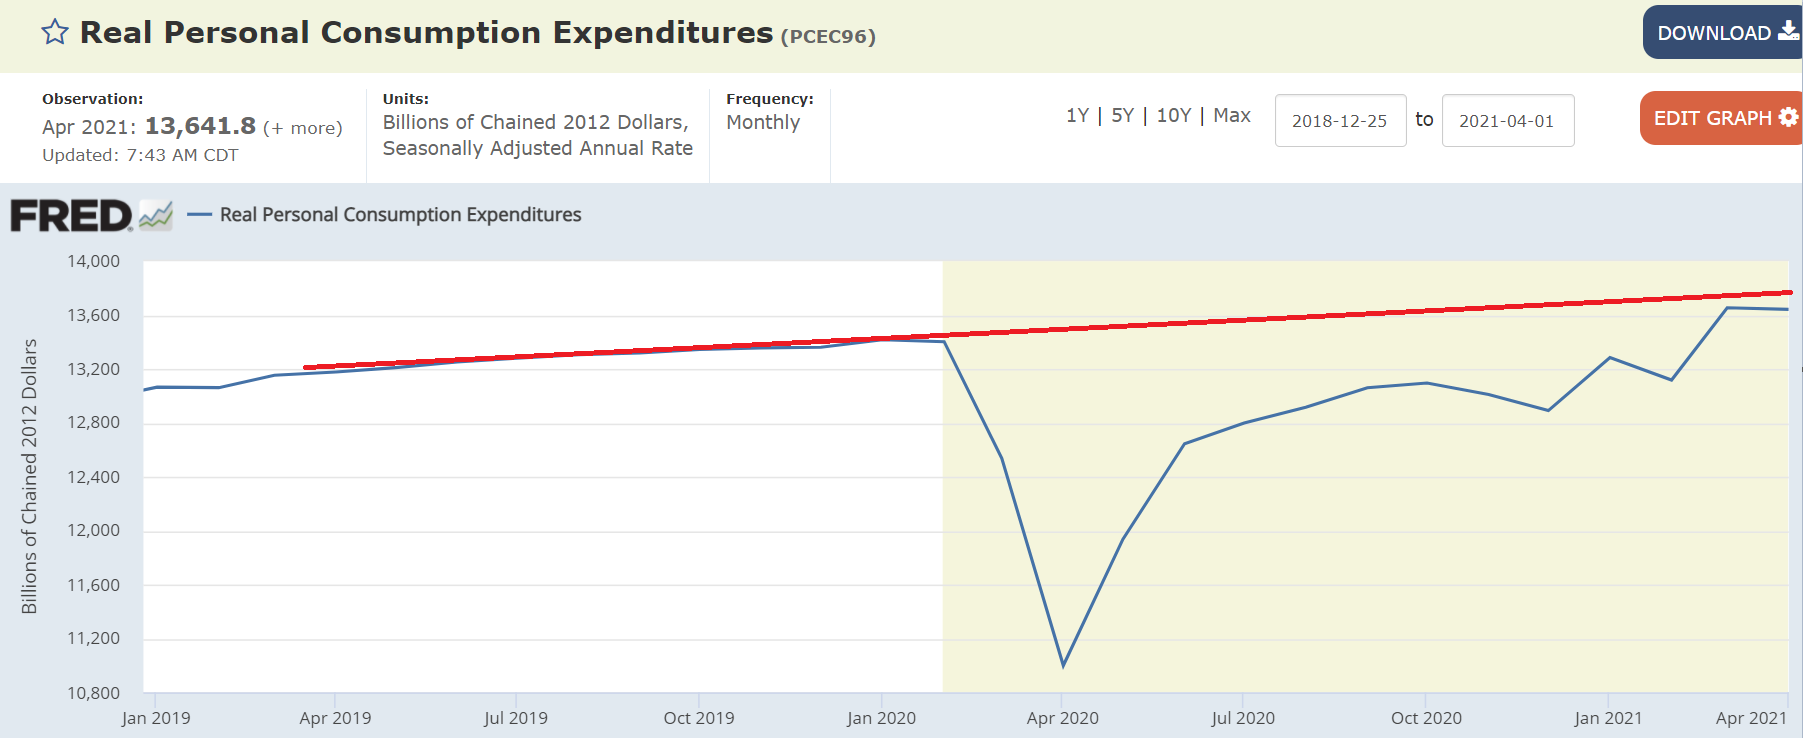
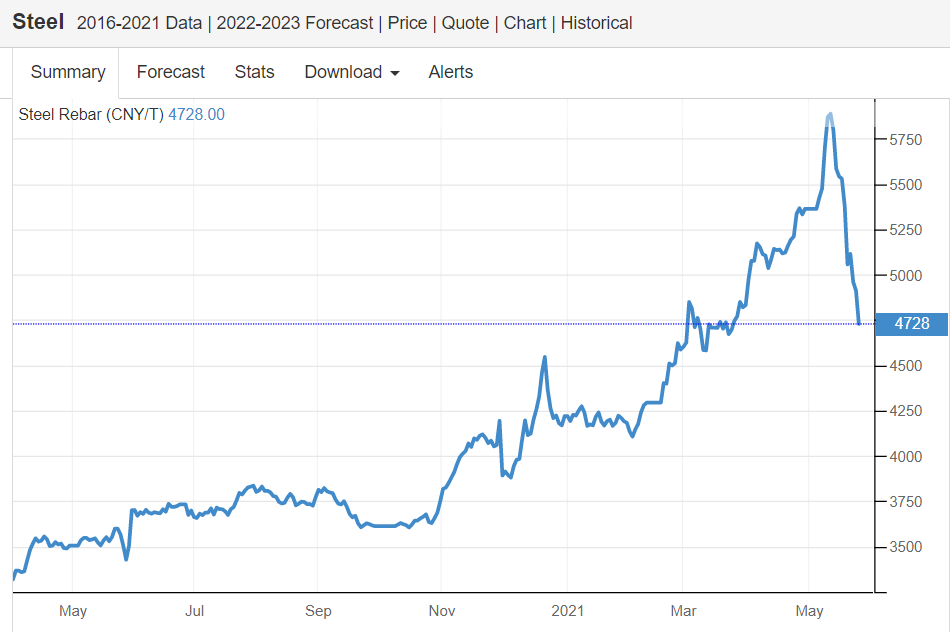
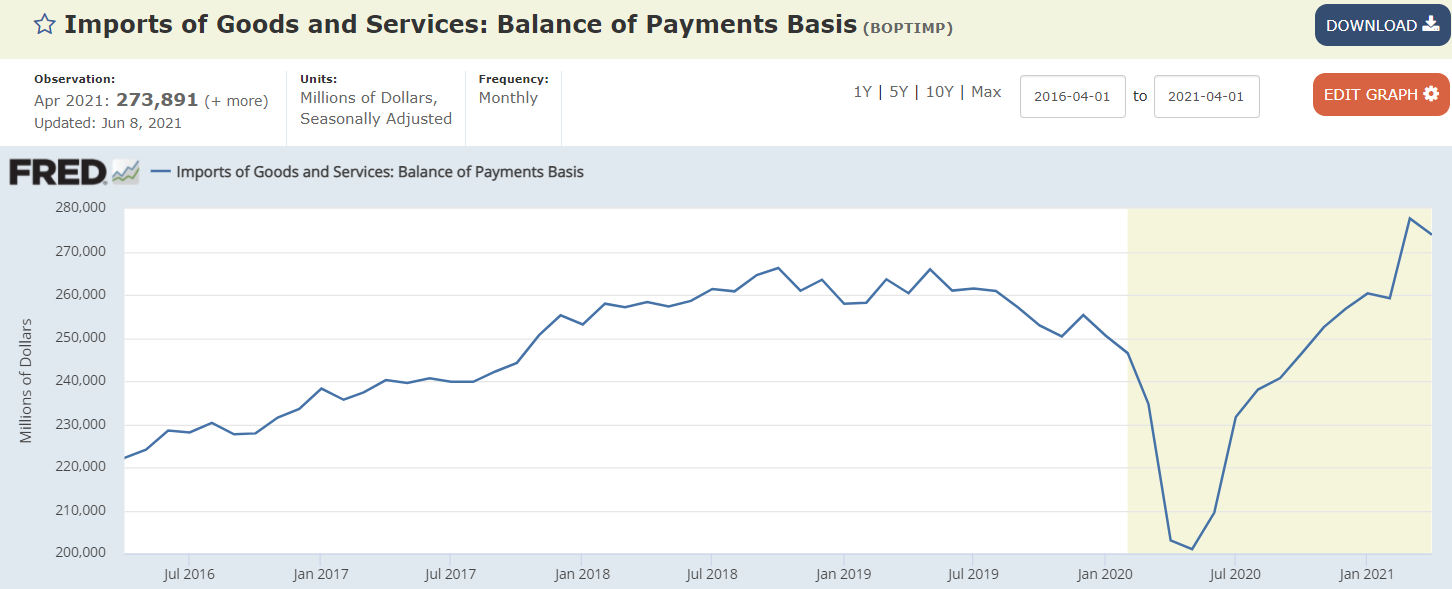
The drop in imports could possibly be a sign of weakness as well:

From the Department of Commerce reported:

The U.S. Census Bureau and the U.S. Bureau of Economic Analysis announced today that the goods and services deficit was $68.9 billion in April, down $6.1 billion from $75.0 billion in March, revised.

April exports were $205.0 billion, $2.3 billion more than March exports. April imports were $273.9 billion, $3.8 billion less than March imports.

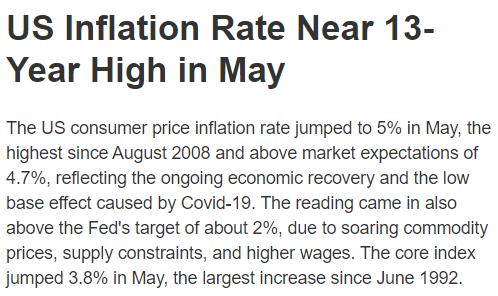
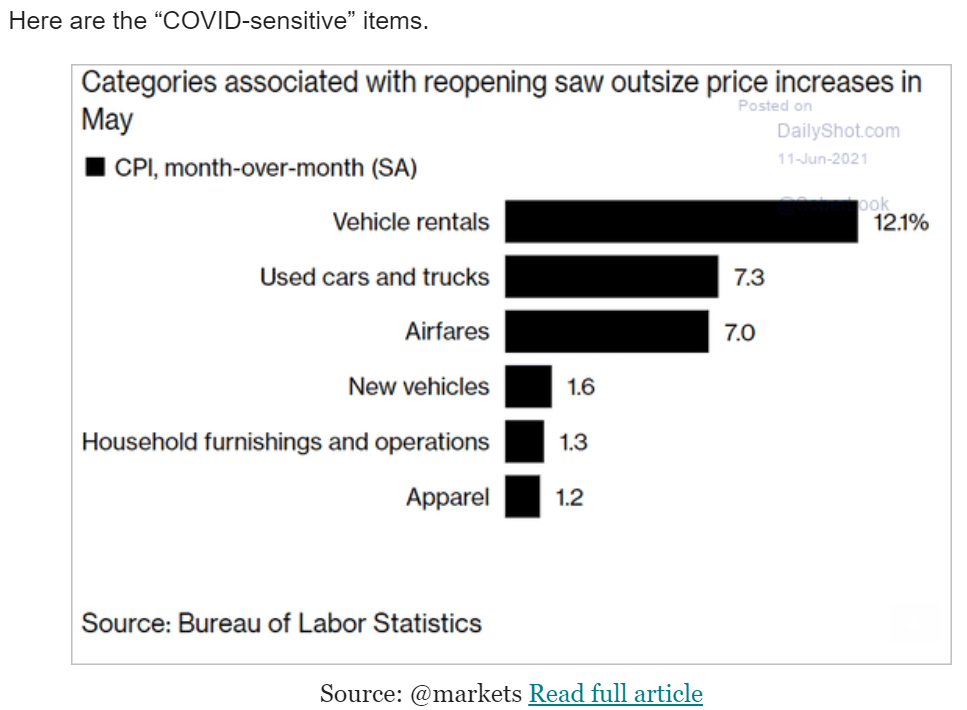
“The strength in the top line indices was driven largely by categories that have been heavily disrupted by COVID and remain under pressure from supply chain disruptions,” wrote Eric Wingorad, senior economist at Alliance Bernstein. “The more persistent categories of inflation — the ones that do a better job of capturing the sustainable trend—are significantly more subdued. That means that the details of today’s print continue to support the idea that the spike in inflation is transitory, even if it is more intense than most forecasters (myself included) would originally have anticipated.”

Employment by wage level, claims, durable goods, pending home sales, steel prices


Claims continue to drift lower but are still about double what they were pre covid:


Continued claims are also about double pre covid levels:


Fell back some and still below pre covid highs.
This chart is not adjusted for inflation:


Same pattern of recent weakness:

Pending home sales in the US surged 51.7 percent year-on-year in April of 2021, the biggest increase ever amid a low base effect from last year when sales sank at a record pace because of the pandemic. All four US regions recorded year-over-year increases. On a monthly basis however, pending home sales dropped 4.4 percent, compared to forecasts of a 0.8 percent rise, with only the Midwest witnessing month-over-month gains. “Contract signings are approaching pre-pandemic levels after the big surge due to the lack of sufficient supply of affordable homes,” said Lawrence Yun, NAR’s chief economist. “The upper-end market is still moving sharply as inventory is more plentiful there”. Yun anticipates housing supply to improve as a whole as soon as autumn. He points to an increase in the comfortability of those listing, as well as a rise in sellers after the conclusion of the eviction moratorium or as they exit forbearance. source: National Association of Realtors