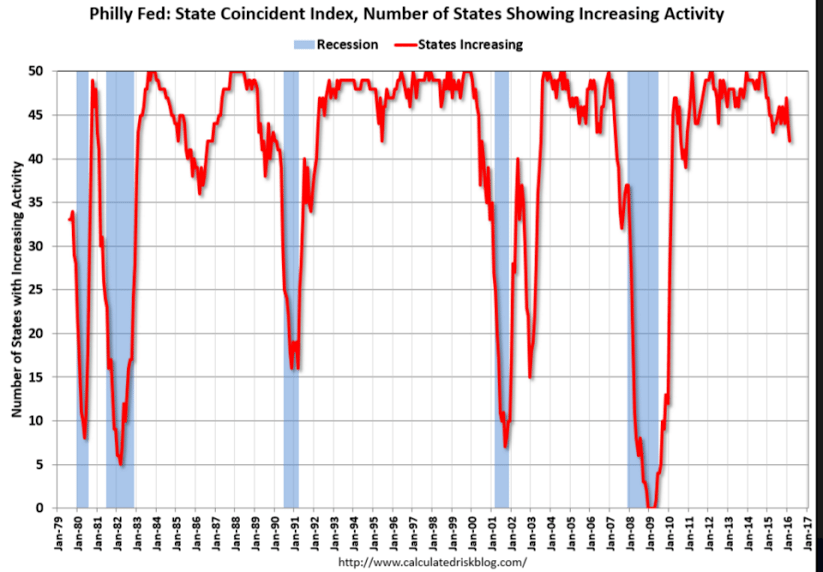
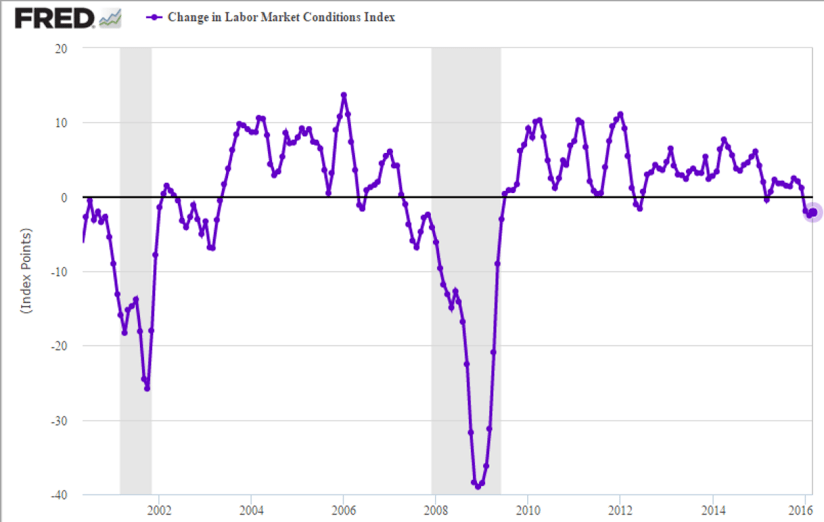
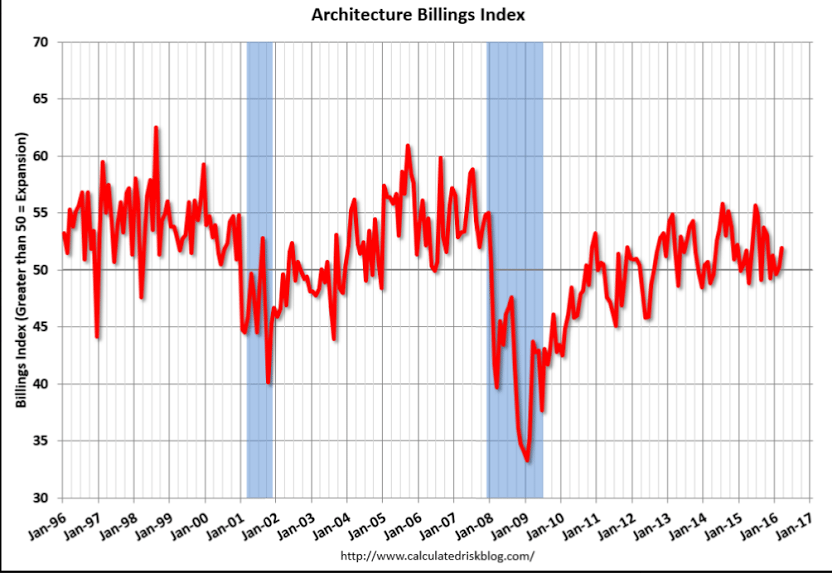
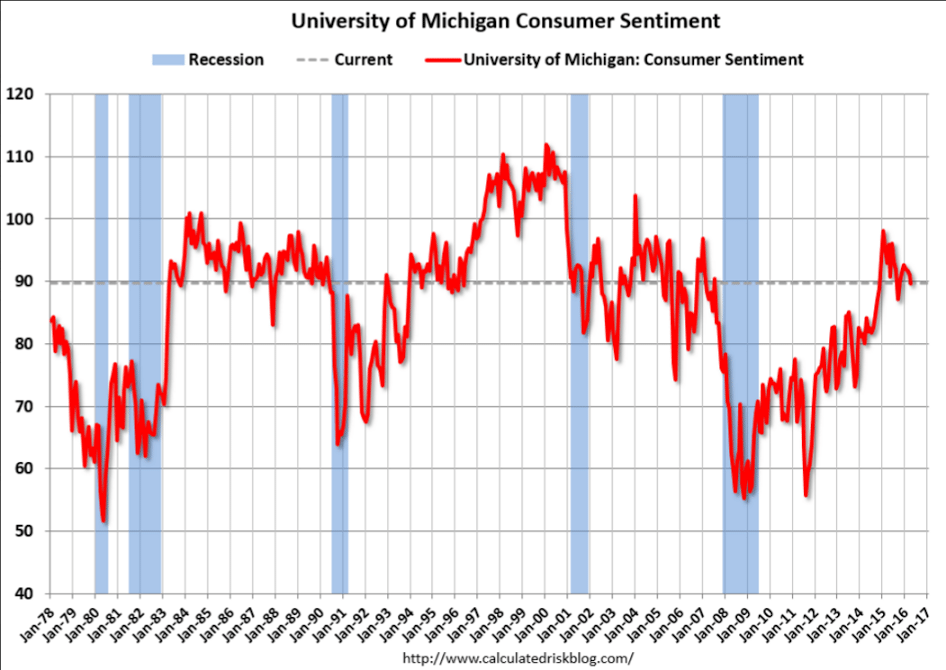
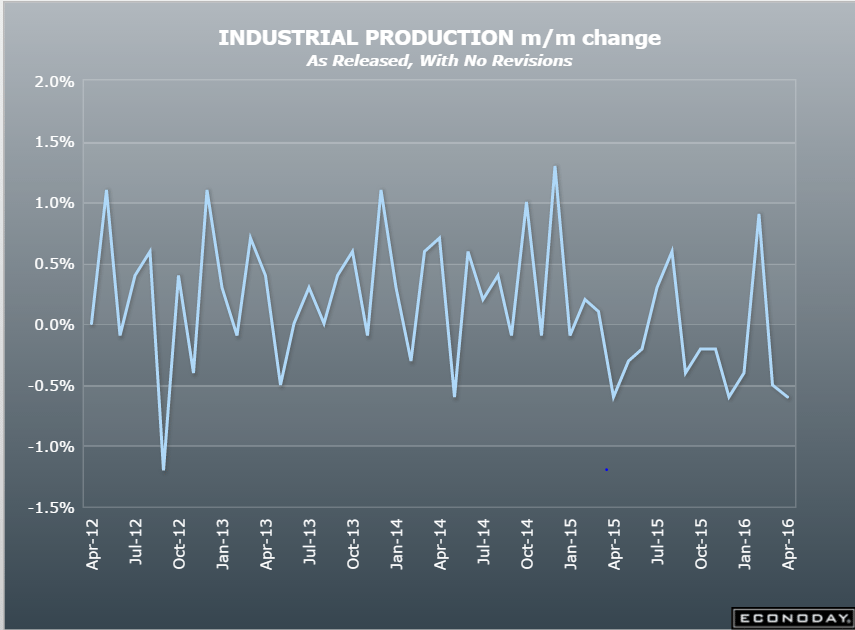
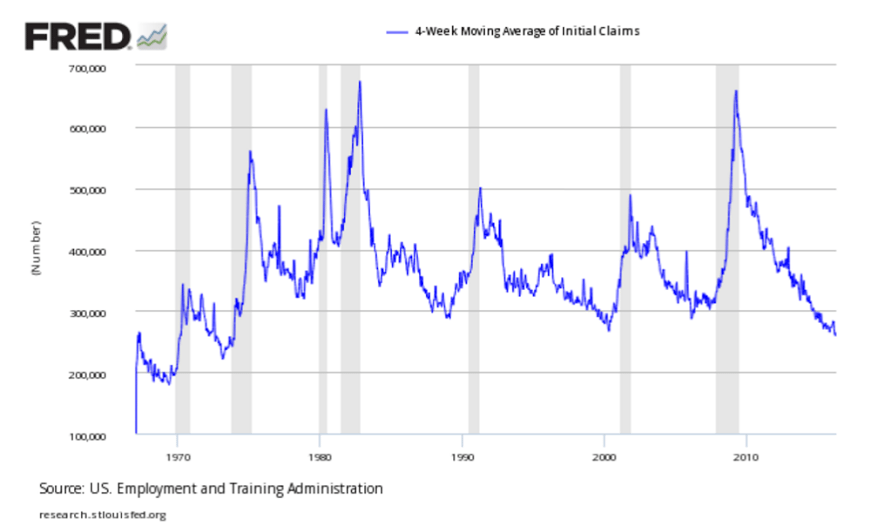
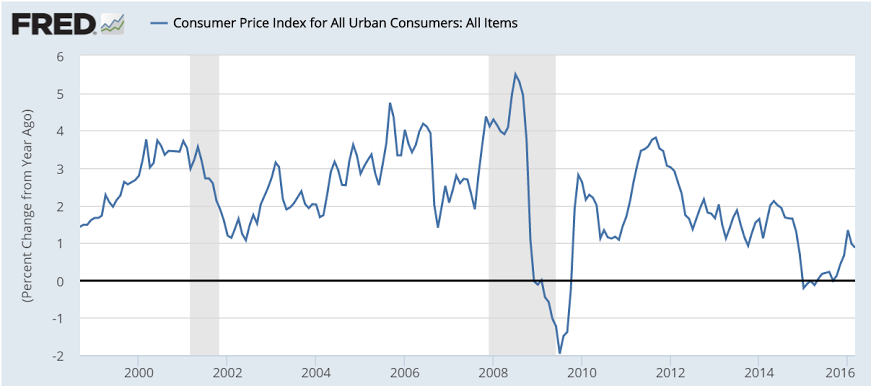
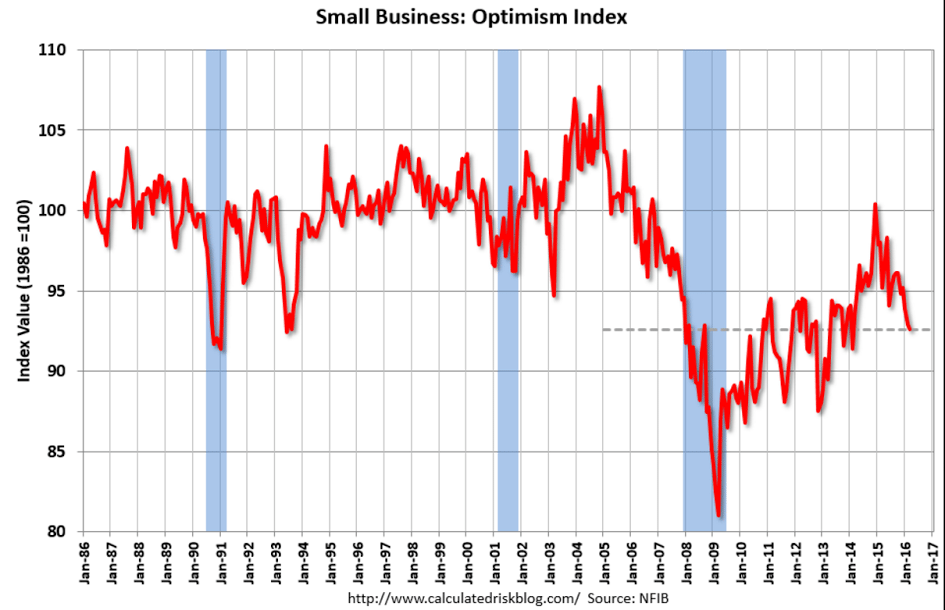
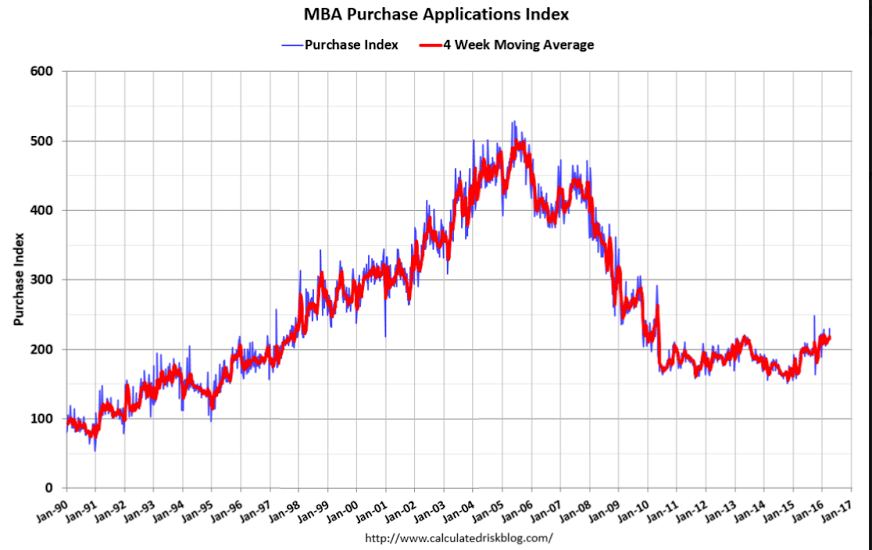
A bit of an increase after a dip, but still low and still depressed, as per the chart.
And spikes up like this have most often subsequently reversed:
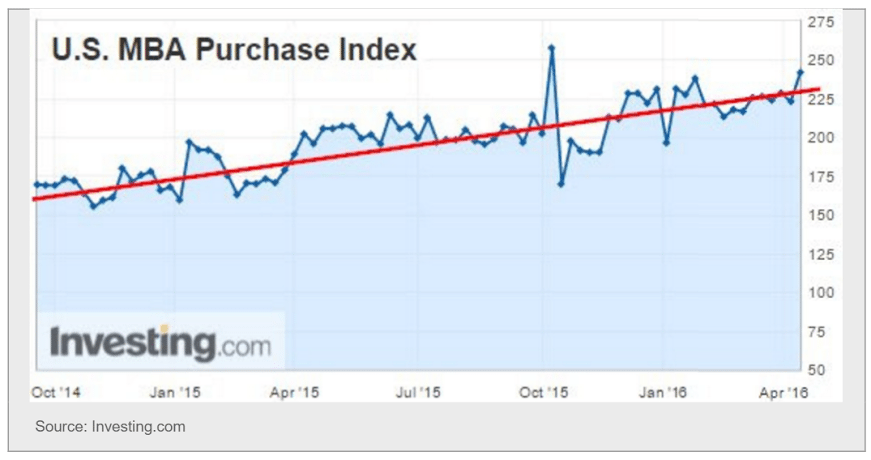
MBA Mortgage Applications
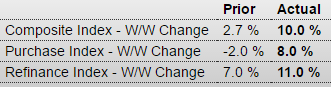
Highlights
Driven by falling interest rates, mortgage application activity was brisk in the April 8 week both for home purchases, up 8.0 percent, and refinancing, up 11.0 percent from the previous week. Purchase applications are up a striking 24 percent from this time last year, attaining the second highest level since May 2010. Mortgage rates fell to the lowest level since January 2015, with the average 30-year fixed rate for conforming mortgages ($417,000 or less) down 4 basis points from the prior week at 3.82 percent.
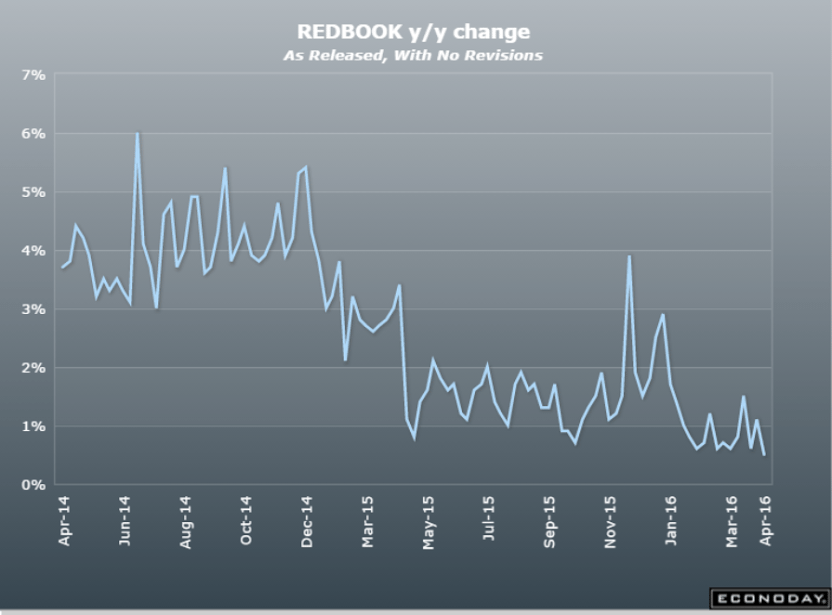
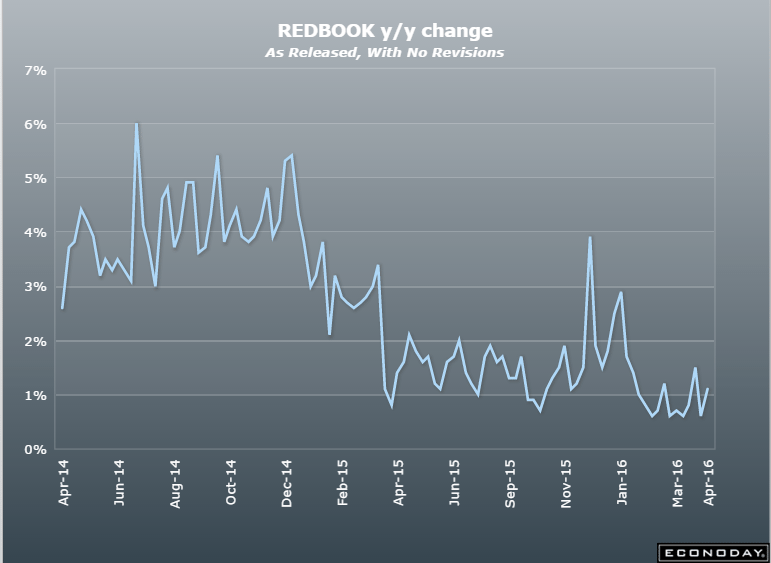
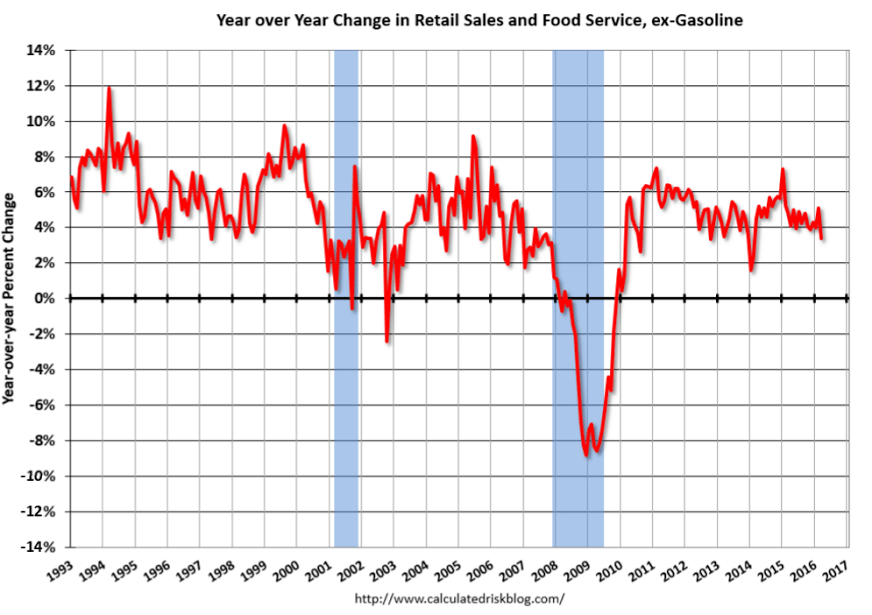
Bad one here, and not to forget sales = income:
Retail Sales
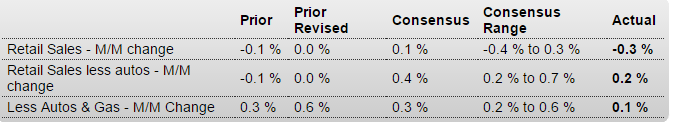
Highlights
Retail sales, down a disappointing 0.3 percent in March, were pulled lower by auto sales but unfortunately do show wider weakness. Auto sales fell a very steep 2.1 percent in March and last posted a monthly gain way back in November. This is the biggest drop for vehicle sales since February last year.
In an offset, gasoline sales, boosted by higher prices at the pump, jumped 0.9 percent. Excluding just gasoline — which offers a very telling reading on consumer demand — retail sales fell 0.4 percent. Excluding both autos and gasoline, sales rose 0.1 percent which is 2 tenths below expectations.
A look at year-on-year rates helps to clarify trends in the data. Overall retail sales are up only 1.7 percent, well down from 3.7 percent in February. Excluding autos, sales are up only 1.8 percent. The best reading comes from ex-auto ex-gas which is at plus 3.9 percent for, however, a 9 tenths decline from February. The reading of the greatest concern, however, is once again excluding only gasoline where year-on-year sales slowed to plus 3.3 percent from February’s 5.4 percent.
A sign of the month’s weakness is contraction at restaurants, which like autos is a discretionary category and which fell a very sharp 0.8 percent in the month. A plus is building materials which rose a very strong 1.4 percent for a second month in gains that point to extending strength for residential investment. Other components include a sharp decline for apparel and for department stores, offset by a second straight strong gain for health & personal care.
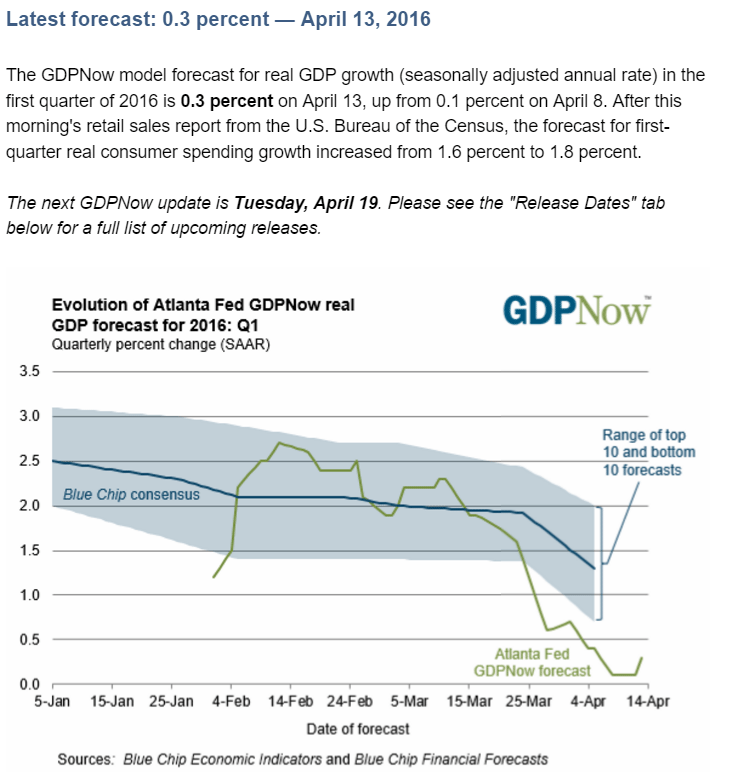
There are upward revisions to February but they definitely do not offset weakness, despite whatever uncertainties over Easter adjustments, in the immediate month of March. This report, especially the stubborn weakness for auto sales, raises key questions over the health of the consumer, who is benefiting from low unemployment but not from wage strength. The report especially raises questions over the outlook for overall economic growth.
And more bad:
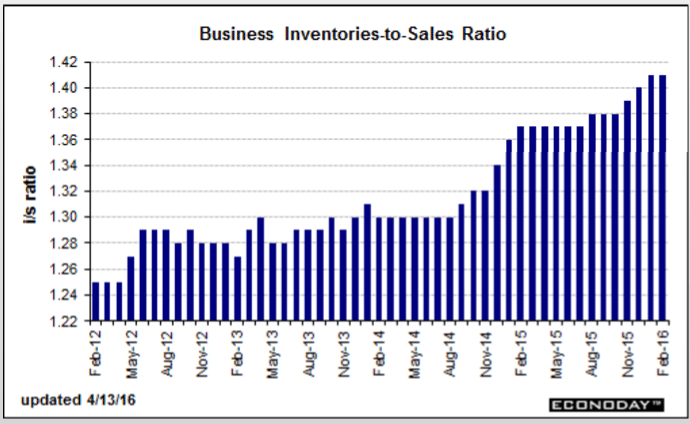
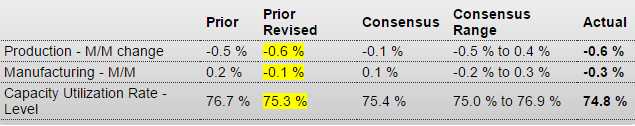
Business Inventories

Highlights
Sales are falling but fortunately so are inventories which fell 0.1 percent in February vs a 0.4 percent decline for sales. The combination keeps the inventory-to-sales ratio, which has been trending higher, at 1.41.
Retail inventories rose a very steep 0.6 percent in February especially against a 0.2 percent decline for sales. Retail inventories of autos, where sales have been weak, rose 1.3 percent in the month to swell the inventory-to-sales ratio to 2.14 from 2.12. Inventories at both manufacturers and wholesalers fell in the month to keep ratios for these readings stable.
Retail inventories, given this morning’s weak retail sales report for March, may be a risk to the nation’s inventory outlook, especially for autos where inventory backup also points to trouble for factory production. Lower down the supply chain, however, sales and inventories are balanced, at least for now.