2008-09-11 USER


[Skip to the end]


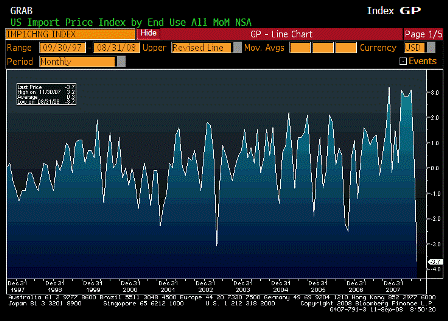
Import Price Index MoM (Aug)

Survey -1.8%
Actual -3.7%
Prior 1.7%
Revised 0.2%

 
A welcome drop, thanks to Mike Masters!

Like the goldman drop of Aug 2006.
[top][end]

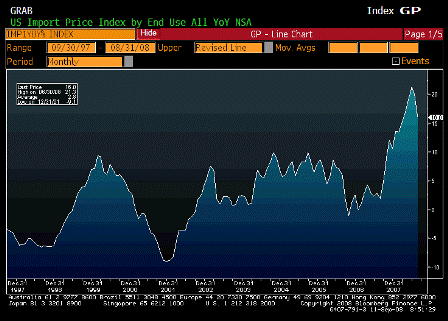
Import Price Index YoY (Aug)

Survey 20.2%
Actual 16.0%
Prior 21.6%
Revised 20.1%

 
Lower than expected, though still up big year over year, which most influences core CPI.
[top][end]

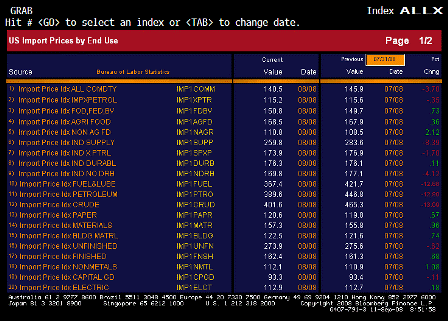
Import Price Index ALLX 1 (Aug)

 
Interesting details this month.
[top][end]

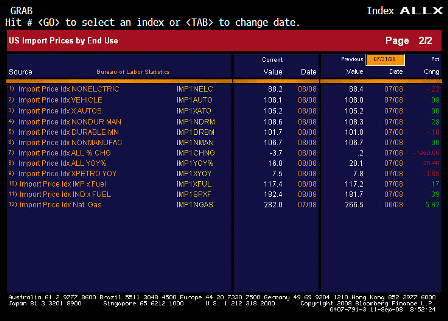
Import Price Index ALLX 2 (Aug)

[top][end]


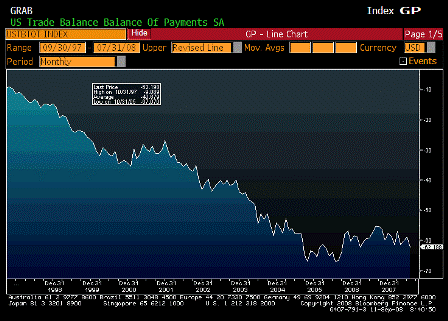
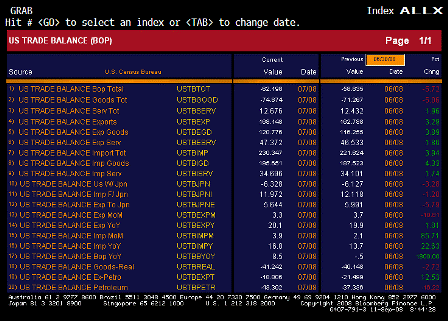
Trade Balance (Jul)

Survey -$58.0B
Actual -$62.2B
Prior -$56.8B
Revised -$58.8B

 
Deficit higher than expected, due to July oil prices. This should more than reverse in August and, so far, September as sharply lower oil prices reduce the cost of imports.
[top][end]

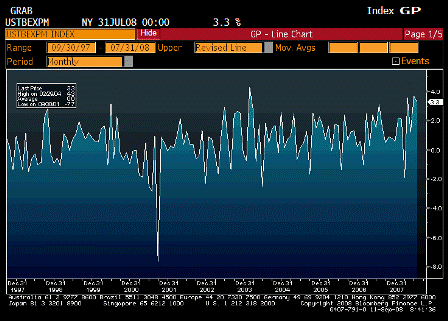
Exports MoM (Jul)

Survey n/a
Actual 3.3
Prior 3.7
Revised n/a

 
Still increasing, though at a slightly lower rate.
[top][end]

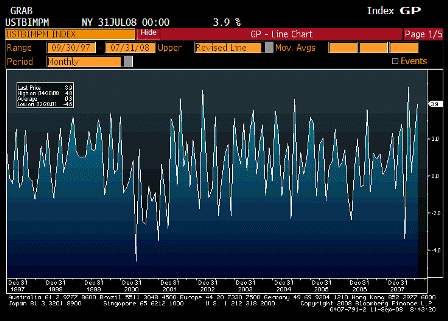
Imports MoM (Jul)

Survey n/a
Actual 3.9
Prior 2.1
Revised n/a

 
This should drop next month with lower oil prices.
[top][end]

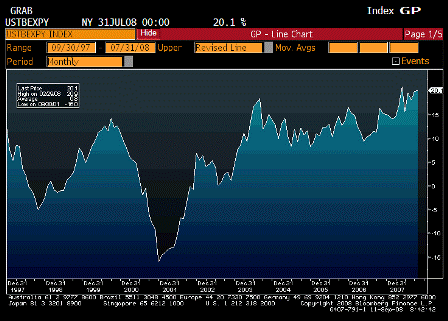
Exports YoY (Jul)

Survey n/a
Actual 20.1
Prior 19.9
Revised n/a

 
Still climbing rapidly. next month’s numbers will indicate effects of any global slowdown.
[top][end]

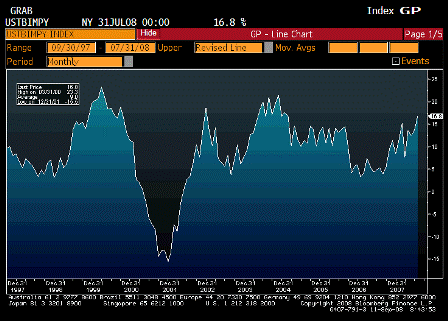
Imports YoY (Jul)

Survey n/a
Actual 16.8
Prior 13.7
Revised n/a

 
Still up big, falling oil prices should cut this down.
[top][end]

Trade Balance ALLX (Jul)

 
Worth reading through these.
[top][end]


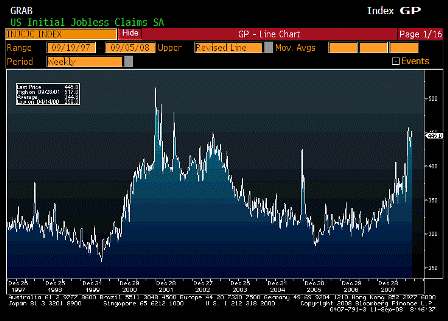
Initial Jobless Claims (Sep 6)

Survey 440K
Actual 445K
Prior 444K
Revised 451K

 
Holding steady at higher levels, and getting closer to recession levels.
[top][end]

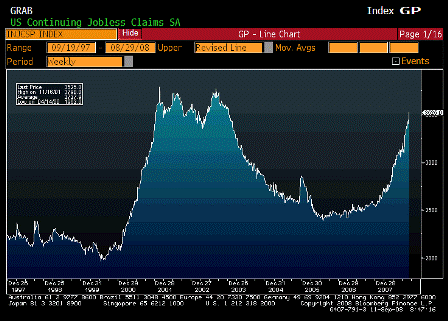
Continuing Jobless Claims (Aug 30)

Survey 3460K
Actual 3525K
Prior 3435K
Revised 3403K

 
This continues to move up and is getting closer to recession levels.

Not clear how much new extended benefit.
[top][end]

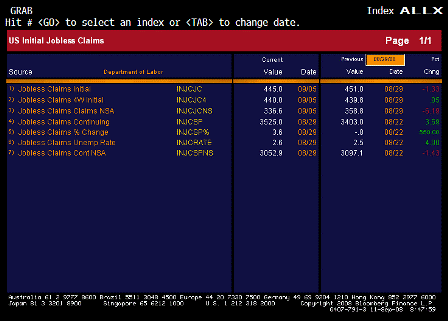
Jobless Claims ALLX (Aug 30)

 
Interesting that claims were only 336,600 before the seasonal adjustment.
With seasonals this large improvement is more likely to show up when they reverse.
[top][end]

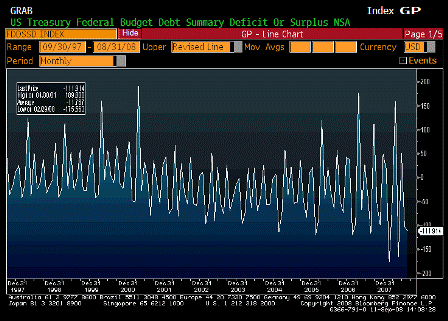
Monthly Budget Statement (Aug)

Survey -$108.0B
Actual -$111.9B
Prior -$117.0B
Revised

 
A bit higher than expected, receipts falling some, but nothing serious yet.
[top][end]

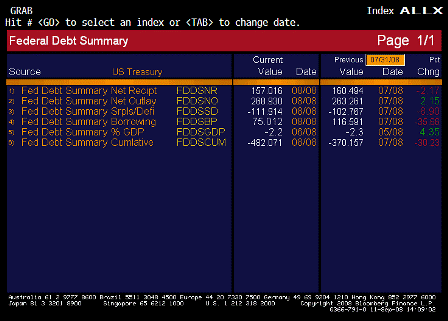
Monthly Budget Statement ALLX (Aug)


[top]

2008-08-12 US Economic Releases


[Skip to the end]


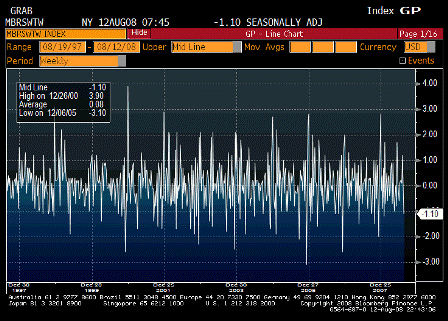
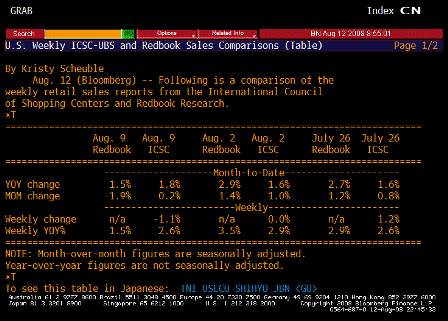
ICSC-UBS Store Sales WoW (Aug 12)

Survey n/a
Actual -1.1%
Prior 0.0%
Revised n/a

[top][end]

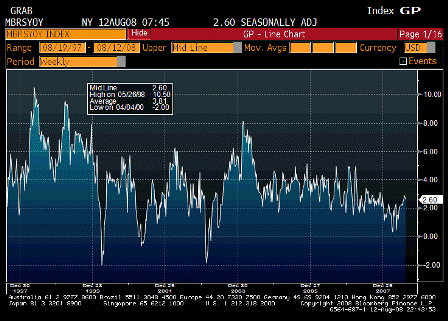
ICSC-UBS Store Sales YoY (Aug 12)

Survey n/a
Actual 2.6%
Prior 2.9%
Revised n/a

Year over year looking fine.

[top][end]

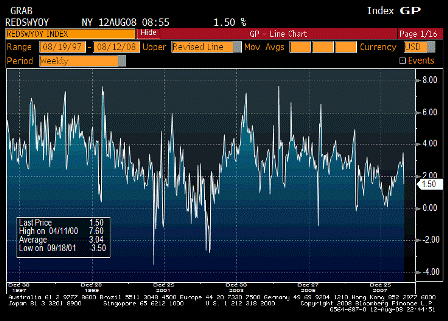
Redbook Store Sales Weekly YoY (Aug 12)

Survey n/a
Actual 1.5%
Prior 3.5%
Revised n/a

Softer but no collapse.

[top][end]

ICSC-UBS Redbook Comparisson TABLE (Aug 12)

[top][end]


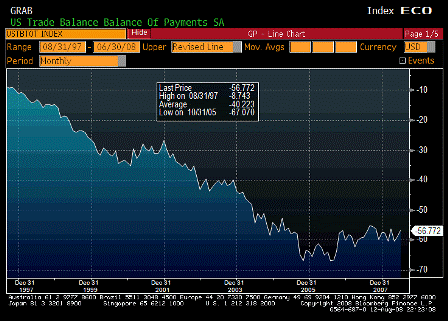
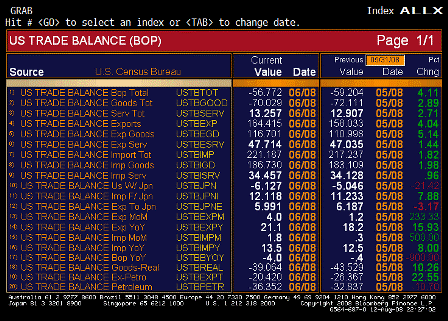
Trade Balance (Jun)

Survey -$62.0B
Actual -$56.8B
Prior -$59.8B
Revised -$59.2B

Lower than expected and moving lower even with crude prices up in June.

I still think last months number was too high which is part of the reason for the June drop.

[top][end]

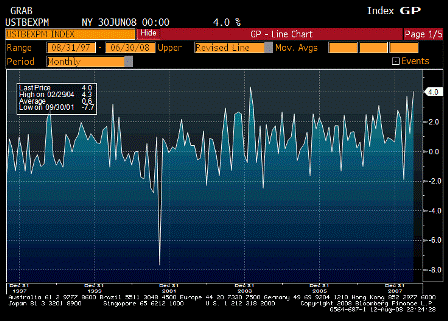
Exports MoM (Jun)

Survey n/a
Actual 4.0%
Prior 1.2%
Revised n/a

Government and exports continue to support GDP.

Q2 now looking to be revised to maybe north of 3%.

[top][end]

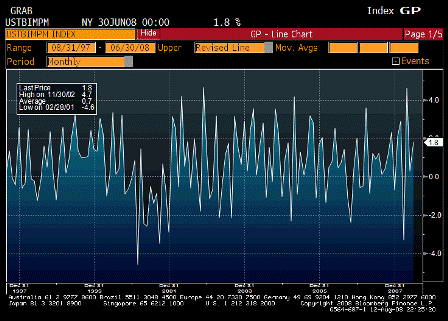
Imports MoM (Jun)

Survey n/a
Actual 1.8%
Prior 0.3%
Revised n/a

Up due to crude and gasoline prices.

[top][end]

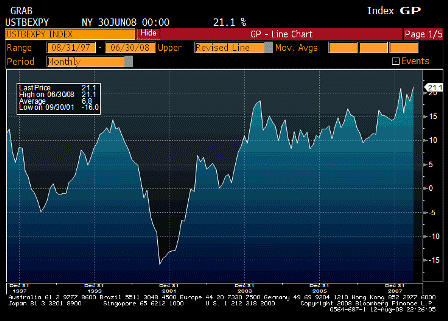
Exports YoY (Jun)

Survey n/a
Actual 21.1%
Prior 18.2%
Revised n/a

Looking more like an export economy every day. Weak domestic consumption and ok employment.

Workers earn enough to drive to work and eat, and the rest of their output gets exported to someone else.

[top][end]

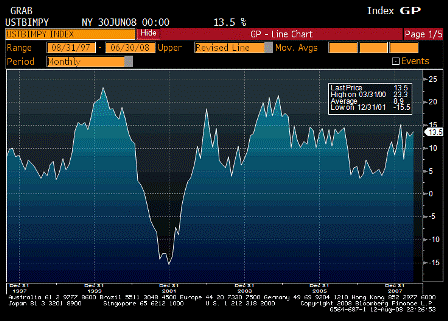
Imports YoY (Jun)

Survey n/a
Actual 13.5%
Prior 12.5%
Revised n/a

Mostly petro and product prices.

Other imports are down.

[top][end]

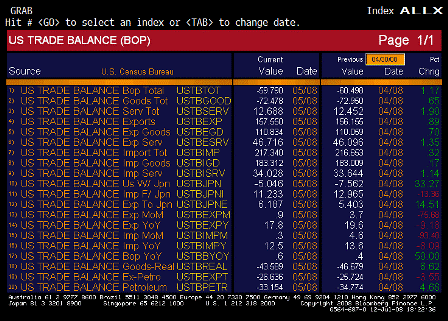
Trade Balance ALLX (Jun)

Ex petro down to about 20 billion.

[top][end]


IBD-TIPP Economic Optimism (Aug)

Survey 39.0
Actual 42.8
Prior 37.4
Revised n/a

Up some, but less than expected.

[top][end]


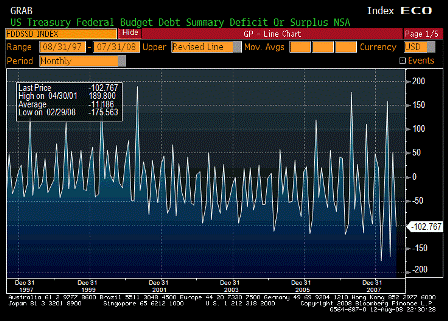
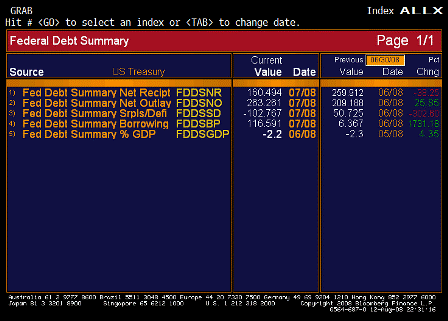
Monthly Budget Statement (Jul)

Survey -$95.0B
Actual -$102.8B
Prior -$36.4B
Revised n/a

Government spending and exports supporting GDP more than most anticipate.

[top][end]

Monthly Budget Statement ALLX (Jul)

[top][end]


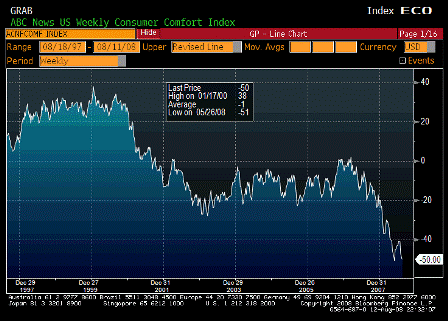
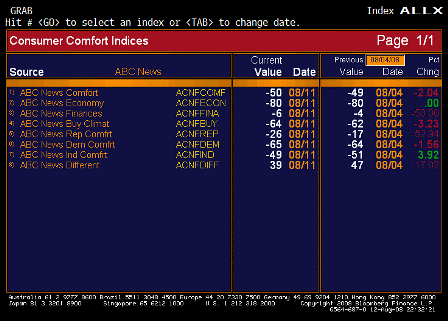
ABC Consumer Confidence (Aug 10)

Survey n/a
Actual -50
Prior -49
Revised n/a

Bumping along the bottom.

Inflation hurting confidence as wages remain ‘well contained’.

[top][end]

ABC Consumer Confidence ALLX (Aug 10)


[top]
2008-07-11 US Economic Releases


[Skip to the end]


Trade Balance (May)

Survey -$62.5B
Actual -$59.8B
Prior -$60.9B
Revised -$60.5B

[top][end]

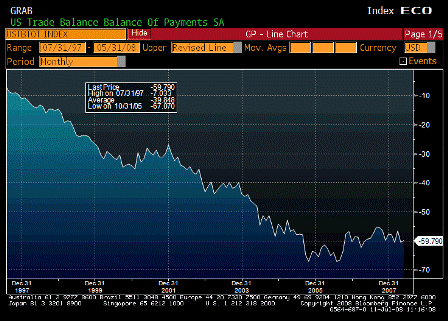
Trade Balance (May)

Seems to be working its way lower, but rising import prices are a moving target.
Without CBs and monetary authorities buying to help their exporters, I don’t think the rest of the world wants to accumulate $60 billion a month of financial assets, which means the USD will continue to fall and US prices will continue higher until the real trade gap falls to desired levels.

[top][end]


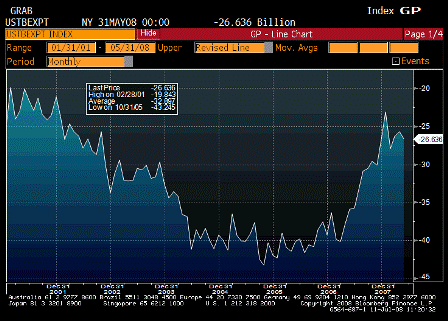
Trade Balance Ex Petroleum (May)

Survey n/a
Actual -$26.636B
Prior -$25.724B
Revised n/a

This has come down quite a bit and should continue to fall over time.

[top][end]


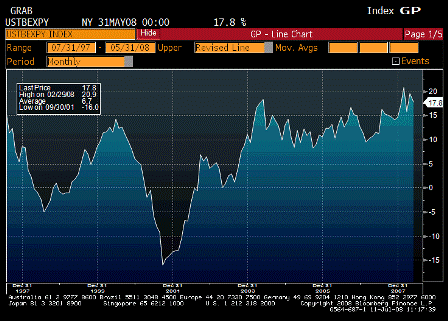
Exports YoY (May)

Survey n/a
Actual 17.8%
Prior 19.6%
Revised n/a

Booming!

[top][end]


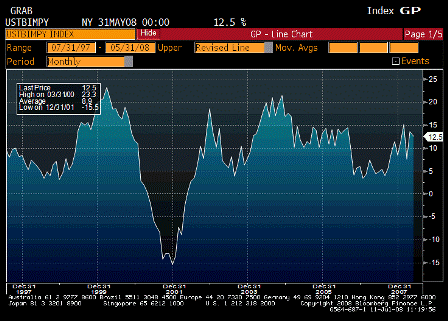
Imports YoY (May)

Survey n/a
Actual 12.5%
Prior 13.6%
Revised n/a

Working their way to lower rates of increase, even with energy prices rising.

[top][end]


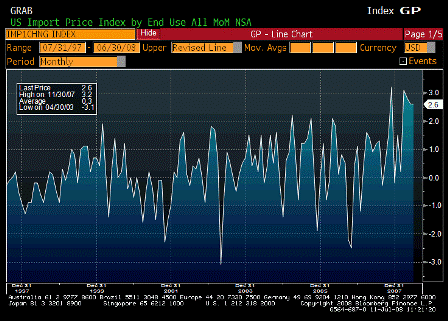
Import Price Index MoM (Jun)

Survey 2.0%
Actual 2.6%
Prior 2.3%
Revised 2.6%

‘Inflation’ pouring in through the open window.

[top][end]


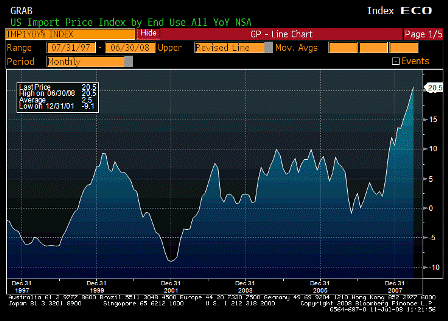
Import Price Index YoY (Jun)

Survey 18.6%
Actual 20.5%
Prior 17.8%
Revised 18.8%

Inflation pouring in through the open window.

[top][end]


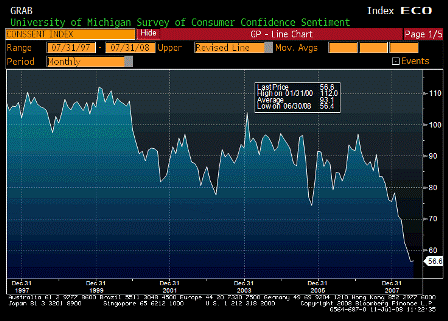
U. of Michigan Confidence (Jul P)

Survey 55.5
Actual 56.6
Prior 56.4
Revised

[top][end]

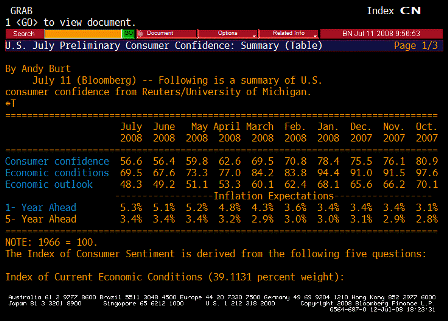
U. of Michigan Confidence TABLE (Jul P)

Inflation hurting confidence even as current conditions have improved some.

[top][end]


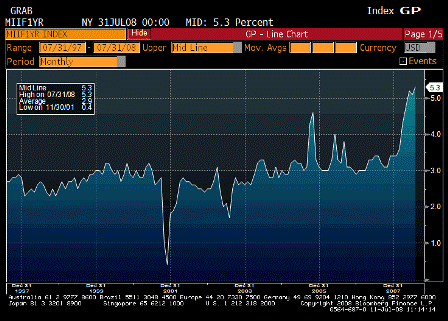
Inflation Expectations 1yr Fwd (Jul P)

Survey n/a
Actual 5.3%
Prior 5.1%
Revised n/a

Fed considers this reason for alarm.

[top][end]


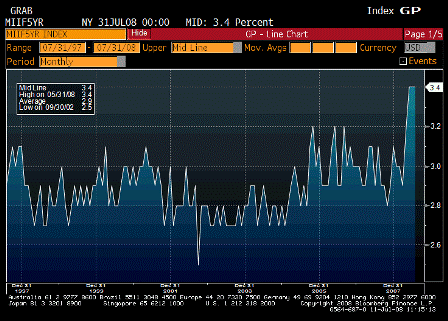
Inflation Expectations 5y Fwd (Jul P)

Survey n/a
Actual 3.4%
Prior 3.4%
Revised n/a

Way too high for the Fed and going the wrong way.

[top][end]


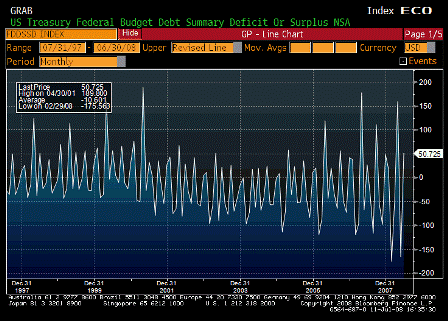
Monthly Budget Statement (Jun)

Survey $34.0B
Actual $50.7B
Prior $27.5B
Revised n/a

Haven’t seen the detail. This can be very volatile due to timing issues.


[top]
2008-06-11 US Economic Releases


[Skip to the end]


2008-06-11 MBAVPRCH Index

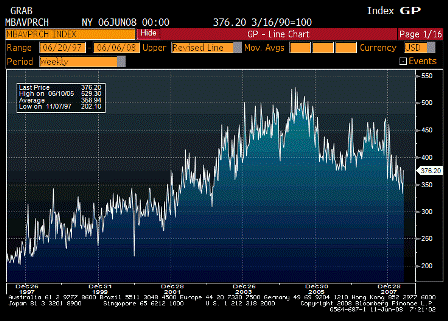
MBAVPRCH Index (Jun 6)

Survey n/a
Actual 376.2
Prior 333.6
Revised n/a

Moved up off the ‘bottom’ of the ‘new range’ and moving the same direction as pending home sales that surprised on the upside.

[top][end]


2008-06-11 MBAVREFI Index

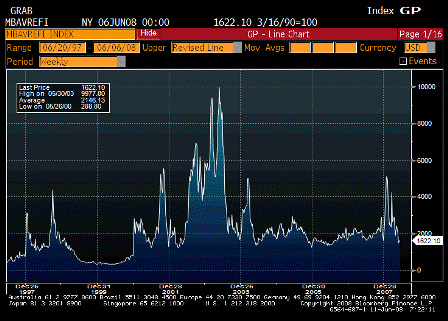
MBAVREFI Index (Jun 6)

Survey n/a
Actual 1622.1
Prior 1496.1
Revised n/a

Muddling through. Most of the resets have are now history.

[top][end]


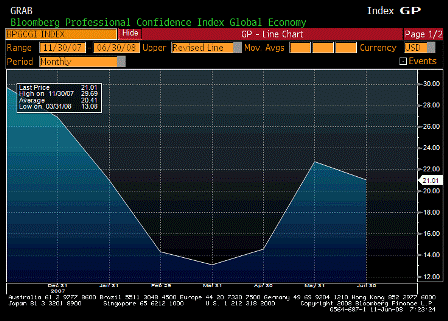
2008-06-11 Bloomberg Global Confidence

Bloomberg Global Confidence

Survey n/a
Actual 21.01
Prior 22.73
Revised n/a

Global inflation cutting into consumer buying plans.

In some ways this conflicts with expectations theory that theorizes that consumers will accelerate purchases if they expect higher prices.

[top][end]


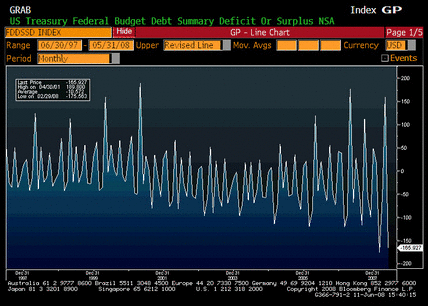
2008-06-11 Monthly Budget Statement

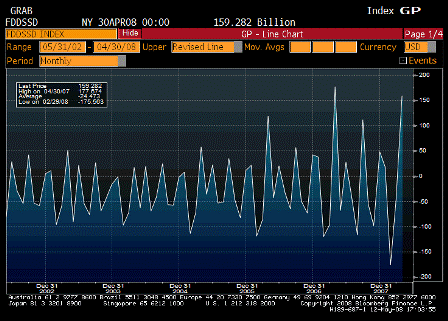
Monthly Budget Statement (May)

Survey -$164.5B
Actual -$165.9B
Prior -$67.7B
Revised n/a

[comments]

[top][end]


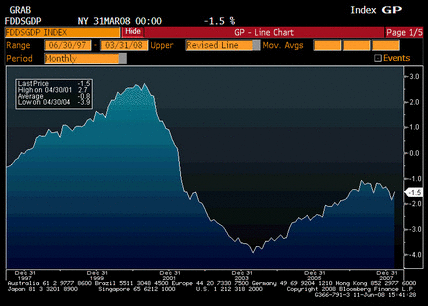
2008-06-11 Federal Debt Percent GDP

Federal Debt Percent GDP


[top]
2008-04-10 US Economic Releases

2008-04-10 Trade Balance

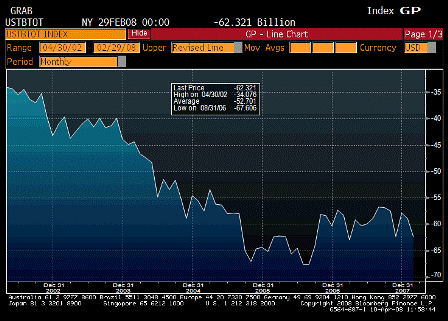
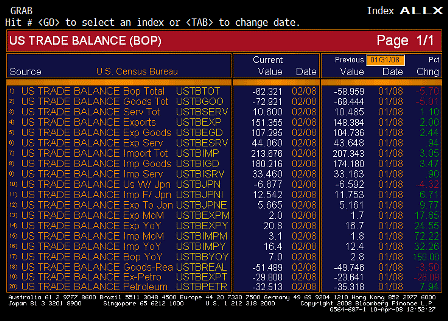
Trade Balance (Feb)

2008-04-10 Trade Balance TABLE

Trade Balance TABLE

Survey -$57.5B
Actual -$62.3B
Prior -$58.2B
Revised -$59.0B

Exports still accelerating- up 2% over last month, a 26%+ annual rate, and 20.8% year over year.

Looks like an anomaly with imports, up 3.1% month over month and petroleum imports down. Very odd for non petroleum imports to be up – look for adjustments with next month’s number.

While this February number means Q1 GDP will be revised lower, the March report is likely to more than reverse this.


2008-04-10 Initial Jobless Claims since 1998

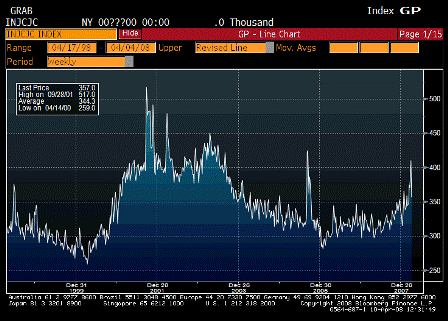
Initial Jobless Claims (Apr 5)

Survey 383K
Actual 357K
Prior 407K
Revised 410K

Back down but 4 week moving average still inching up some.

Not at recession levels yet.


2008-04-10 Continuing Claims since 1998

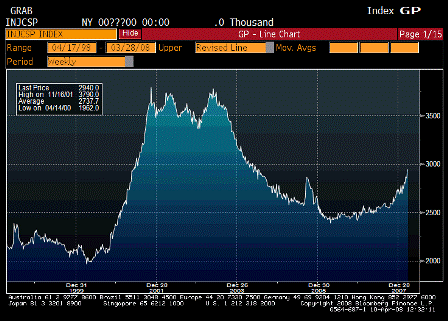
Continuing Claims (Mar 29)

Survey 2935K
Actual 2840K
Prior 2937K
Revised n/a

This lags a week. It has moved up over the last year, but still far from previous recession levels.


2008-04-10 ICSC Chaing Stores Sales YoY

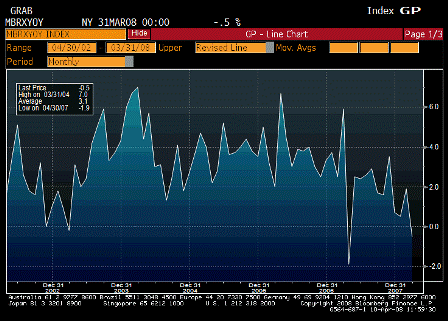
ICSC Chain Stores Sales YoY (Mar)

Survey 0.9%
Actual -0.5%
Prior 1.9%
Revised n/a

Consumer remained weak in March – that’s what an export economy looks like.


2008-04-10 Monthly Budget Statement

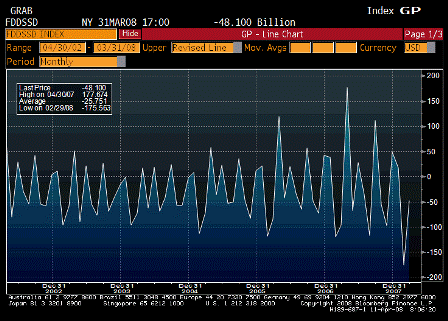
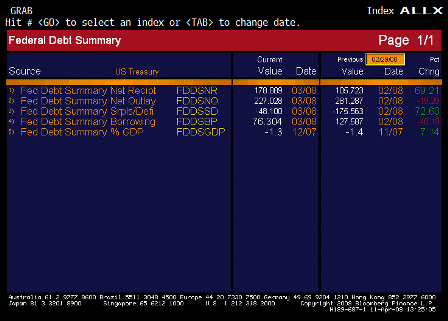
Monthly Budget Statement (Mar)

Survey -$70.0B
Actual -$48.1B
Prior -$96.3B
Revised n/a

2008-04-11 Monthly Budget Statement TABLE

Monthly Budget Statement TABLE

2008-01-11 US Economic Releases

2008-01-11 Trade Balance

Trade Balance (Nov)

Survey -$59.5B
Actual -$63.1B
Prior -$57.8B
Revised n/a

Exports holding up. Oil price jump and vol in aircraft shipments.

December exports are key for the quarter.


2008-01-11 Import Price Index MoM

Import Price Index MoM (Dec)

Survey 0.1%
Actual 0.0%
Prior 2.7%
Revised 3.3%

Went down continuously for years, now going up.

And with outsourcing, this represents what was previously unit labor costs.


2008-01-11 Import Price Index YoY

Import Prices YoY (Dec)

Survey 10.5%
Actual 10.9%
Prior 11.4%
Revised 12.1%

Now supporting ‘inflation’ as above.


2008-01-11 Monthly Budget Statement

Monthly Budget Statement (Dec)

Survey $50.0B
Actual $48.3B
Prior $42.0B
Revised n/a

Receipts holding up. This is a pretty good coincident indicator of GDP.


2007-12-12 US Economic Releases

2007-12-12 MBA Mortgage Applications

MBA Mortgage Applications (Dec 7)

Survey n/a
Actual 2.5%
Prior 22.5%
Revised n/a

2007-12-07 Mortgage Bankers Association Purchas Index SA

Mortgage Bankers Association Purchasing Index SA

Looking very firm. Possible evidence housing may have bottomed.

Affordability is up with prices flat to down, rates down, and nominal income growing.

Yes, I’ve heard the stories about multiple applications, but even if relevant it’s been the case for several months.


2007-12-12 Trade Balance

Trade Balance (Oct)

Survey -$58.4B
Actual -$57.8
Prior $-56.5B
Revised -$58.1B

Points to higher gross exports as oil prices were higher.


2007-12-12 Import Trade Index (MoM)

Import Trade Index MoM (Nov)

Survey 2.0%
Actual 2.7%
Prior 1.8%
Revised 1.4%

2007-12-12 Import Price Index (YoY)

Import Trade Index YoY (Nov)

Survey 11.0%
Actual 11.4%
Prior 9.6%
Revised 9.0%

First a series of very high inflation numbers coming this week.


2007-12-12 Monthly Budget Statement

Monthly Budget Statement

Survey -$95.0
Actual -$98.2
Prior -$75.0
Revised n/a

A 17 billion December 1 payment counted for November this year as it fell on a weekend; so, only about a 10 billion over last year. When this goes up in earnest, it is coincident with a slowdown. Watch this number closely!


♥