2009-01-30 USER


[Skip to the end]


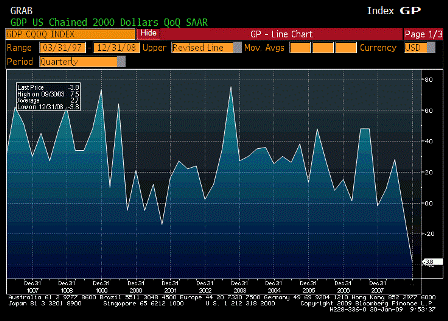
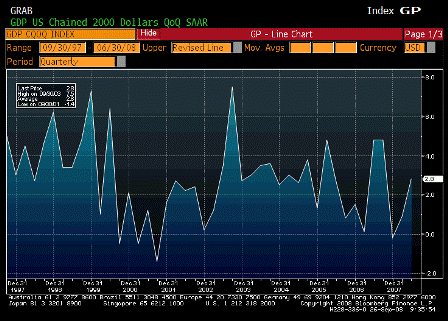
GDP QoQ Annualized (4Q A)

Survey -5.5%
Actual -3.8%
Prior -0.5%
Revised n/a

 
Karim writes:

Better than expected at -3.8% due to inventory build.

Here is the GDP math:

Private consumption (-2.5%) + Business Fixed Investment (-3.1%) + Government (+0.4%) + Net Exports (+0.1%) + Chg in Inventories (+1.3%)

  • Real final sales of -5.1% were consistent with estimates.
  • Business sector overestimated domestic demand, thereby accounting for the inventory build (should reverse in Q1).
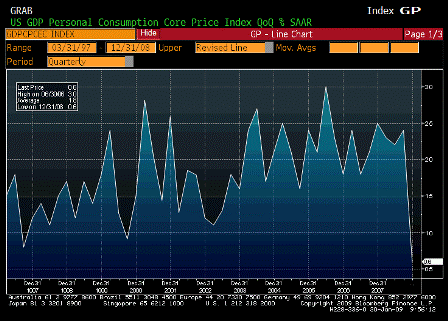
  • Core PCE deflator slowed from 2.4% to 0.6%.
  • Within investment, both housing (-23.6%) and equipment/software (-27.8%) were very weak.
[top][end]

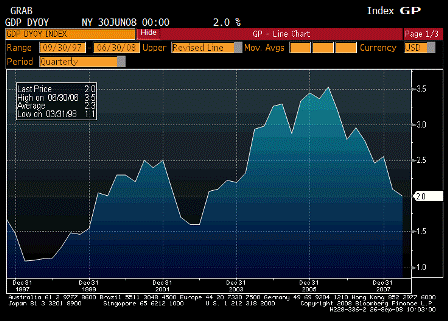
GDP YoY Annualized Real (4Q A)

Survey n/a
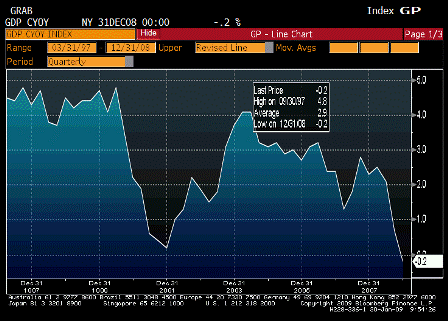
Actual -0.2%
Prior -0.7%
Revised n/a

[top][end]

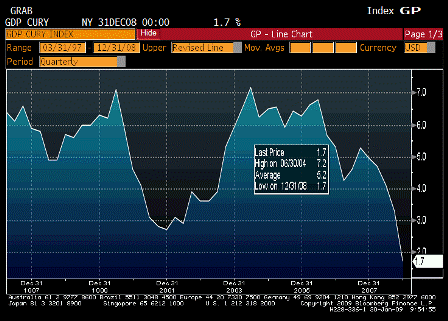
GDP YoY Annualized Nominal (4Q A)

Survey n/a
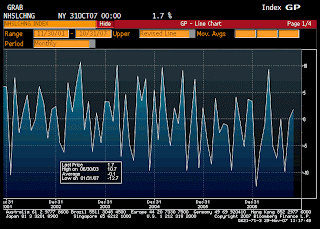
Actual 1.7%
Prior 3.3%
Revised n/a

[top][end]

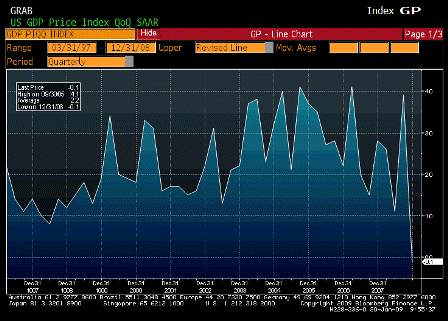
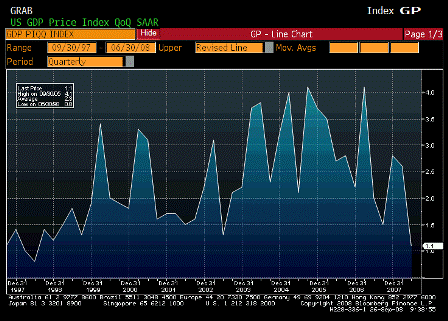
GDP Price Index (4Q)

Survey 0.4%
Actual -0.1%
Prior 3.9%
Revised n/a

[top][end]

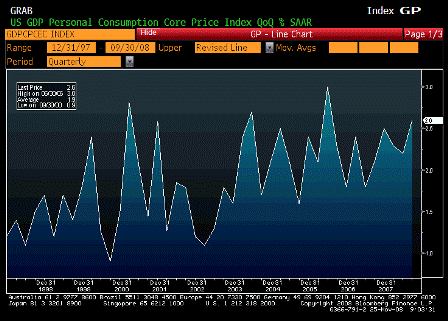
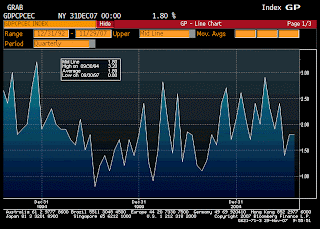
Core PCE QoQ (4Q)

Survey 1.0%
Actual 0.6%
Prior 2.4%
Revised n/a

[top][end]

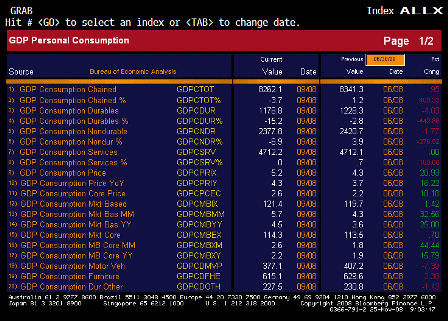
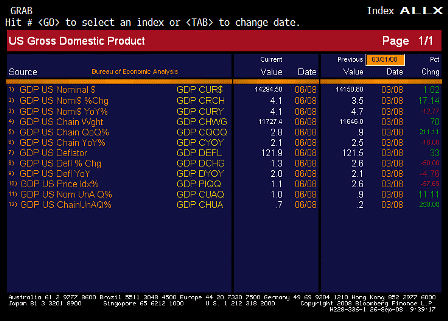
GDP ALLX 1 (4Q)

[top][end]

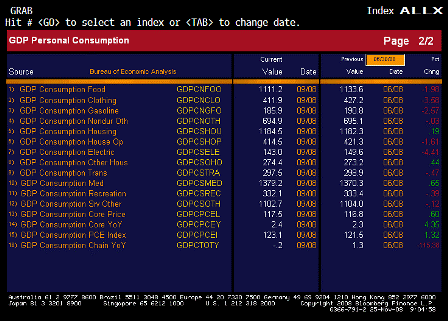
GDP ALLX 2 (4Q)

[top][end]

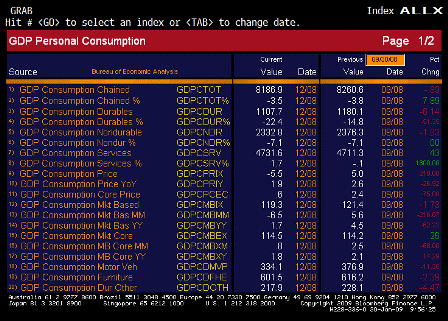
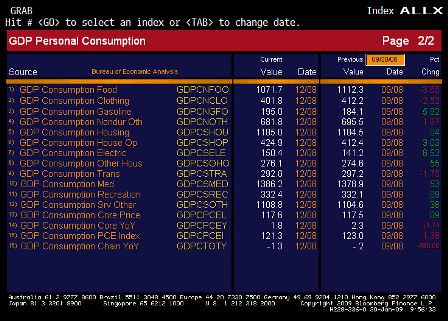
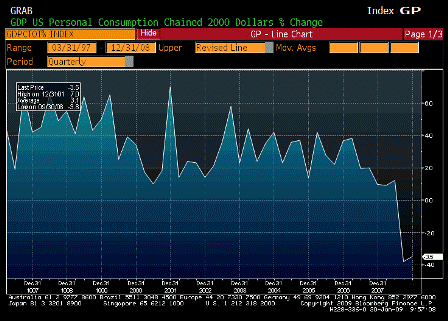
Personal Consumption (4Q)

Survey -3.5%
Actual -3.5%
Prior -3.8%
Revised n/a

[top][end]


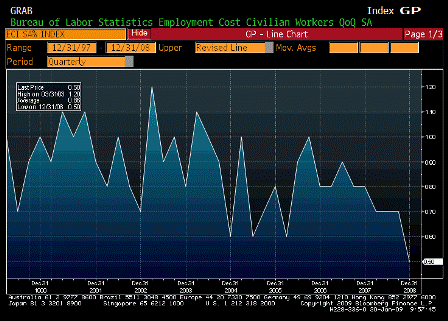
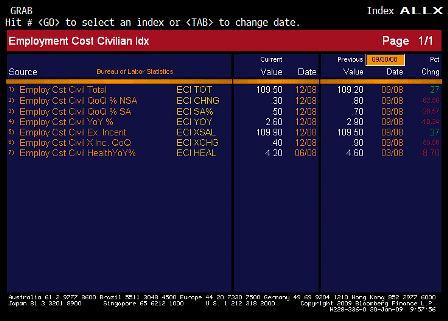
Employment Cost Index (4Q)

Survey 0.7%
Actual 0.5%
Prior 0.7%
Revised n/a

[top][end]

Employment Cost Index ALLX (4Q)

[top][end]


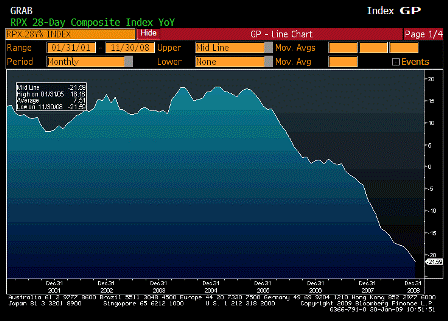
RPX Composite 28dy YoY (Nov)

Survey n/a
Actual -21.59%
Prior -20.14%
Revised n/a

[top][end]

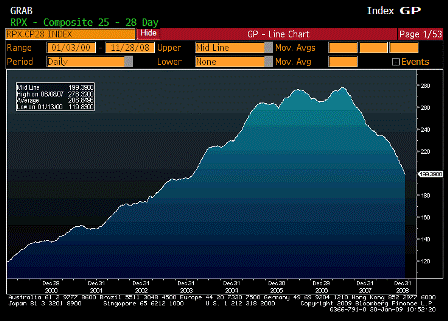
RPX Composite 28dy Index (Nov)

Survey n/a
Actual 199.39
Prior 206.73
Revised n/a

[top][end]


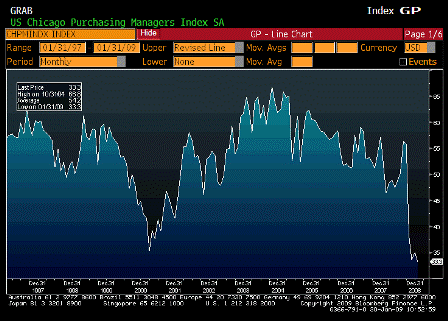
Chicago Purchasing Manager (Jan)

Survey 34.9
Actual 33.3
Prior 34.1
Revised 35.1

[top][end]


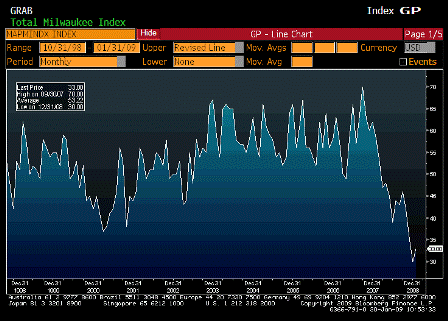
NAPM Milwaukee (Jan)

Survey n/a
Actual 33.0
Prior 30.0
Revised n/a

[top][end]


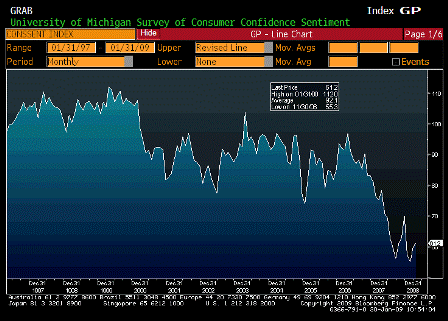
U of Michigan Confidence (Jan F)

Survey 61.9
Actual 61.2
Prior 61.9
Revised n/a

[top][end]

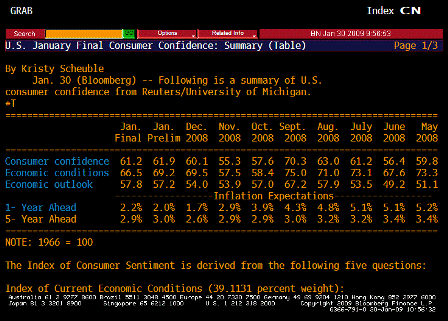
U of Michigan TABLE Inflation Expectations (Jan F)


[top]

2008-11-25 USER


[Skip to the end]


Karim writes:

  • Overlooked with the Fed headlines, but likely to lead to further downward revisions to Q4/Q1 growth outlook.

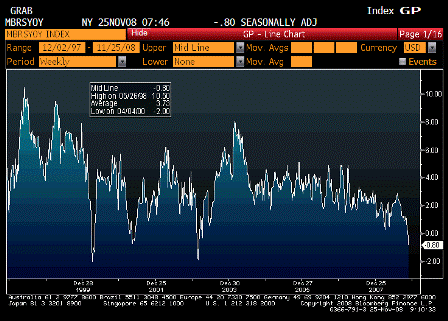
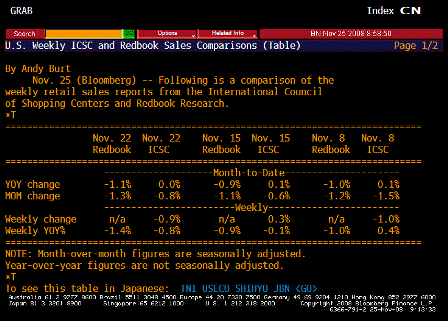
ICSC UBS Store Sales YoY (Nov 25)

Survey n/a
Actual -0.80%
Prior -0.10%
Revised n/a

 
Looking very soft, even with low gasoline prices.

[top][end]

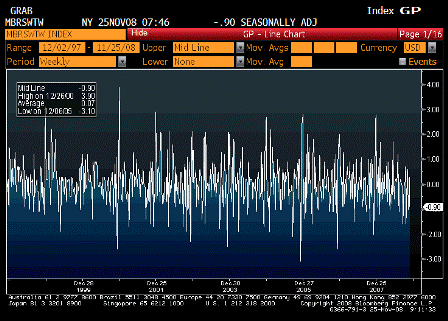
ICSC UBS Store Sales WoW (Nov 25)

Survey n/a
Actual -0.90%
Prior 0.30%
Revised n/a

[top][end]

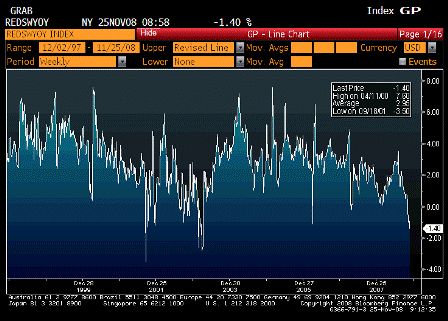
Redbook Store Sales Weekly YoY (Nov 25)

Survey n/a
Actual -1.40%
Prior -0.90%
Revised n/a

 
Same.

[top][end]

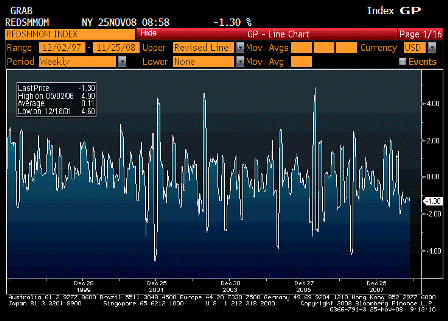
Redbook Store Sales MoM (Nov 25)

Survey n/a
Actual -1.30%
Prior -1.10%
Revised n/a


Karim writes:

  • Johnson Redbook sales down 1.3% m/m thru 3rd week of November.
  • Another negative retail sales month sets up Q4 real GDP for at least -4%

[top][end]

ICSC UBS Redbook Comparison TABLE (Nov 25)

[top][end]


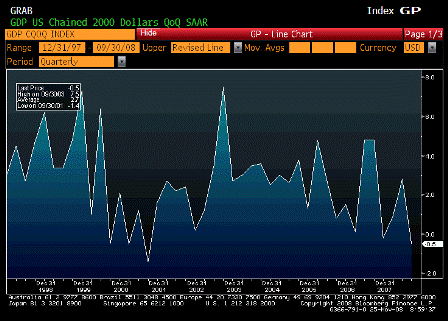
GDP QoQ Annualized (3Q P)

Survey -0.5%
Actual -0.5%
Prior -0.3%
Revised n/a

 
As expected and in line with the longer term down trend in real gdp growth

Good evidence of a continuing and increasing lack of aggregate demand.

[top][end]

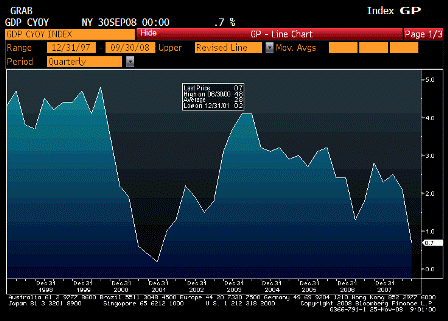
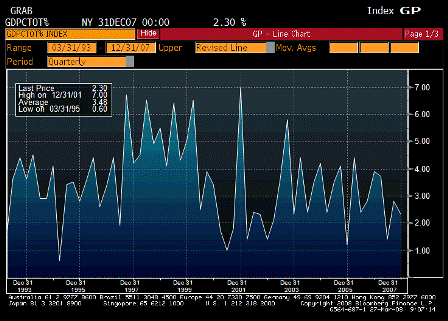
GDP YoY Annualized Real (3Q P)

Survey n/a
Actual 0.7%
Prior 2.1%
Revised n/a

 
Mildly positive but the trend is still looking down.

[top][end]

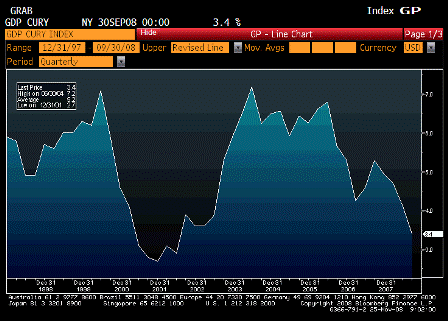
GDP YoY Annualized Nominal (3Q P)

Survey n/a
Actual 3.4%
Prior 4.1%
Revised n/a

 
Barely positive.

[top][end]

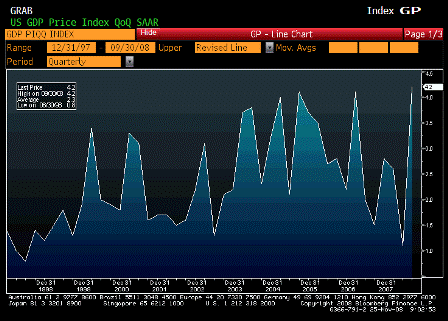
GDP Price Index (3Q P)

Survey 4.2%
Actual 4.2%
Prior 4.2%
Revised n/a

 
High but expected to fall with falling commodity prices.

[top][end]

Core PCE QoQ (3Q P)

Survey 2.9%
Actual 2.6%
Prior 2.9%
Revised n/a

 
Looks to be in a long term uptrend, though also expected to fall with commodity prices.

[top][end]

GDP ALLX 1 (3Q P)

[top][end]

GDP ALLX 2 (3Q P)

[top][end]


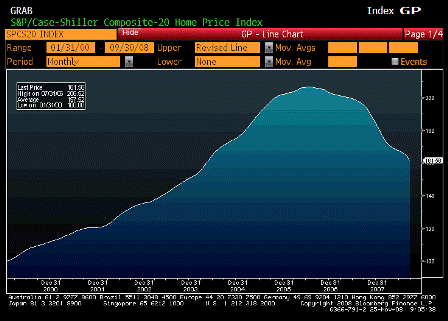
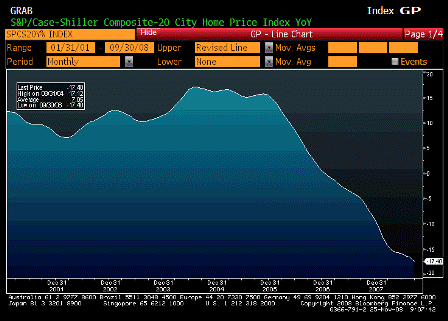
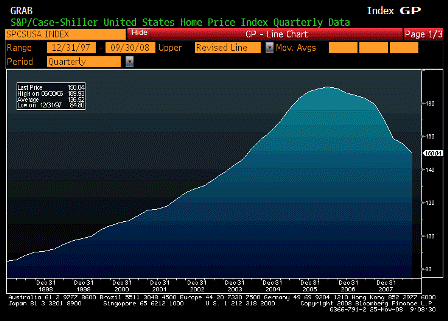
S&P Case Shiller Home Price Index (Sep)

Survey 163.00
Actual 161.56
Prior 164.57
Revised 164.40

 
Took a turn for the worse.

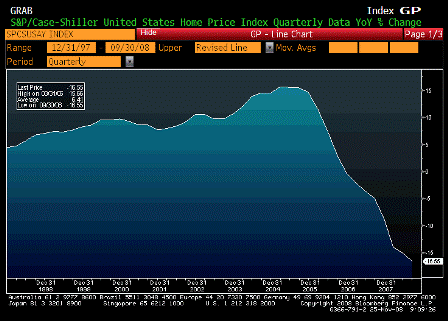
Karim writes:

  • Case Shiller down 1.85% q/q and -17.4% y/y

[top][end]

S&P CS Composite 20 YoY (Sep)

Survey -16.90%
Actual -17.40%
Prior -16.62%
Revised -16.60%

[top][end]

S&P Case Shiller US Home Price Index (3Q)

Survey n/a
Actual 150.04
Prior 155.32
Revised 155.45

[top][end]

S&P Case Shiller US Home Price Index YoY (3Q)

Survey -17.05%
Actual -16.55%
Prior -15.40%
Revised -15.07%

[top][end]


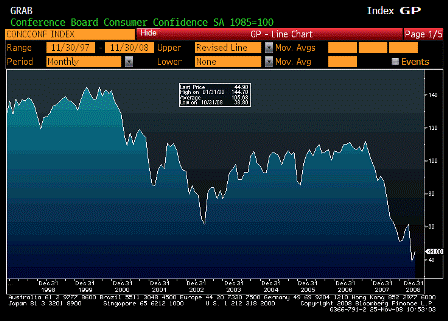
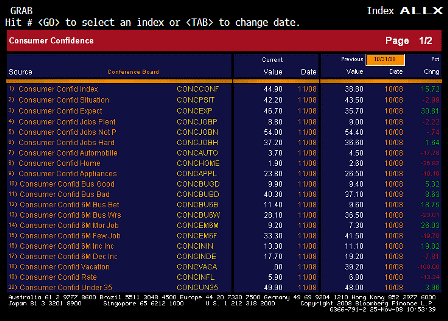
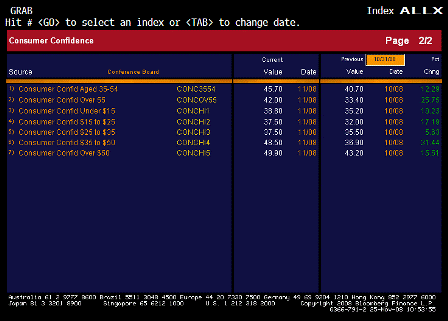
Consumer Confidence (Nov)

Survey 38.0
Actual 44.9
Prior 38.0
Revised 38.8

 
Tiny blip up- well above expectations.

[top][end]

Consumer Confidence ALLX 1 (Nov)

[top][end]

Consumer Confidence ALLX 2 (Nov)

[top][end]


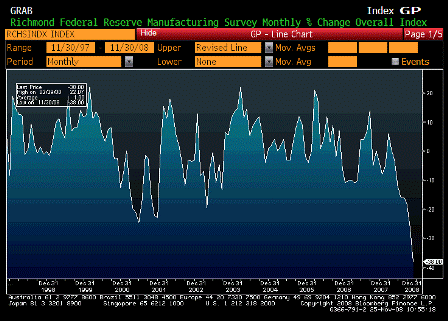
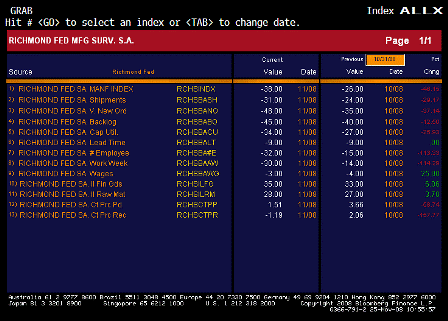
Richmond Fed Manufacturing Index (Nov)

Survey -27
Actual -38
Prior -26
Revised n/a

 
Far worse than expected, more in line with Q4 GDP forecasts of -4%.

[top][end]

Richmond Fed Manufacturing Index ALLX (Nov)

[top][end]


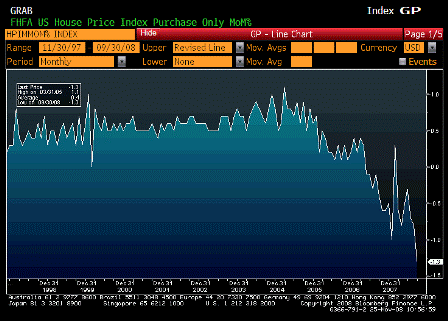
House Price Index MoM (Sep)

Survey -0.7%
Actual -1.3%
Prior -0.6%
Revised -0.8%

 
Also falling like a rock.

[top][end]

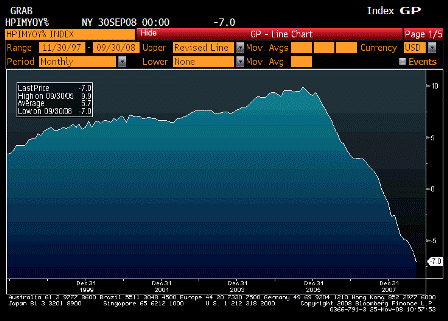
House Price Index YoY (Sep)

Survey n/a
Actual -7.0%
Prior -6.1%
Revised n/a

 
No sign of turning around yet.

[top][end]

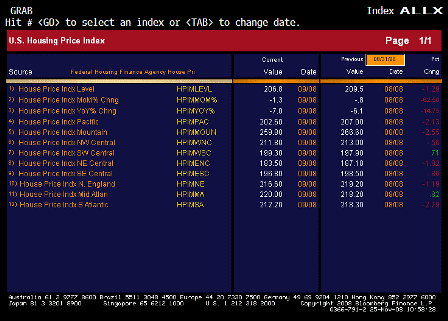
House Price Index ALLX (Sep)

[top][end]

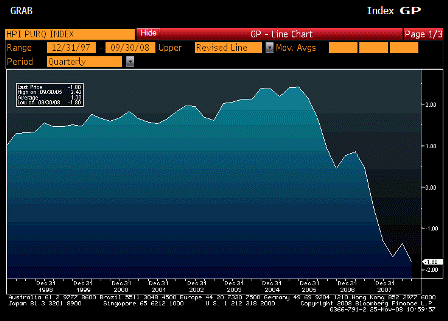
House Price Purchase Index QoQ (3Q)

Survey n/a
Actual -1.8%
Prior -1.4%
Revised n/a

 
The decline has resumed.


[top]

2008-09-26 USER


[Skip to the end]


GDP QoQ Annualized (2Q F)

Survey 3.3%
Actual 2.8%
Prior 3.3%
Revised n/a

 
Growth lower than expected, but still ok.

[top][end]

GDP YoY Annualized Real (2Q F)

Survey n/a
Actual 2.0%
Prior 2.1%
Revised n/a

 
Still above recession levels, but still not looking that healthy.

[top][end]

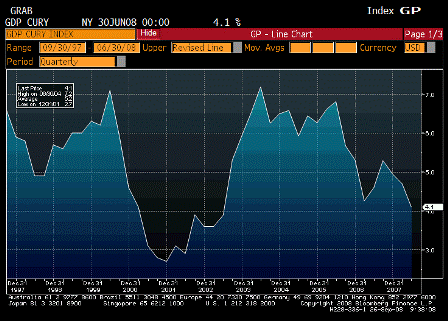
GDP YoY Annualized Nominal (2Q F)

Survey n/a
Actual 4.1%
Prior 4.7%
Revised n/a

 
Nominal GDP falling, but not yet to previous recession levels.

[top][end]

GDP Price Index (2Q F)

Survey 1.2%
Actual 1.1%
Prior 1.2%
Revised n/a

 
A little better than expected, but this series doen’t carry much weight.

[top][end]

GDP ALLX (2Q F)

[top][end]

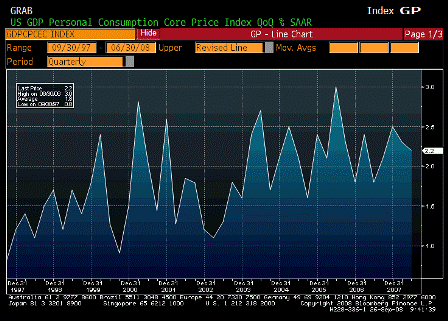
Core PCE QoQ (2Q F)

Survey 2.1%
Actual 2.2%
Prior 2.1%
Revised n/a

 
A bit higher than expected, and the Fed does watch this one closely. They want it under 2%.

[top][end]


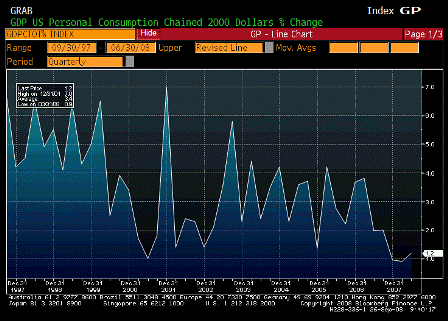
Personal Consumption (2Q F)

Survey 1.7%
Actual 1.2%
Prior 1.7%
Revised n/a

 
Worse than expected and not moving much off the bottom, which are at recession type levels.

[top][end]

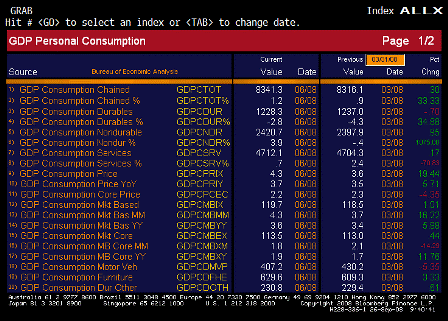
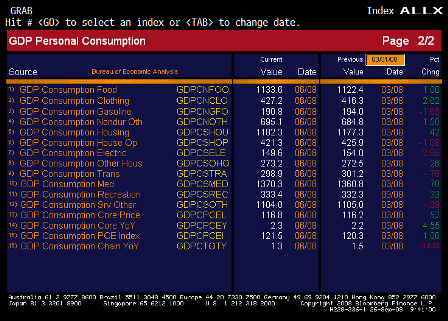
Personal Consumption ALLX 1 (2Q F)

[top][end]

Personal Consumption ALLX 2 (2Q F)

[top][end]


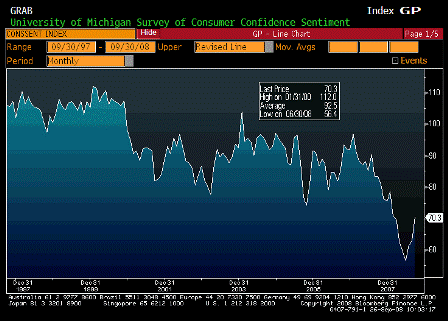
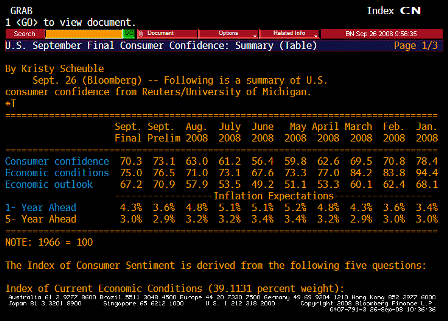
Univ. of Michigan Confidence (Sep F)

Survey 70.8
Actual 70.3
Prior 73.1
Revised n/a

 
Less than expected but looks to have perked up some.

[top][end]

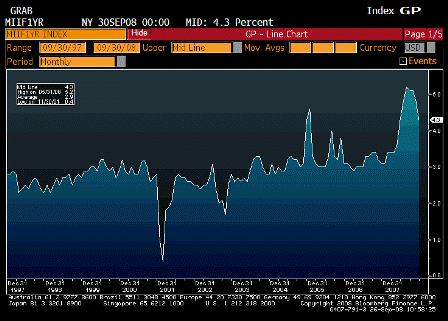
1 Year Inflation Expectations (Sep F)

Survey n/a
Actual 4.3%
Prior 3.6%
Revised n/a

 
Welcome news for the Fed. Follows gasoline prices pretty closely.

[top][end]

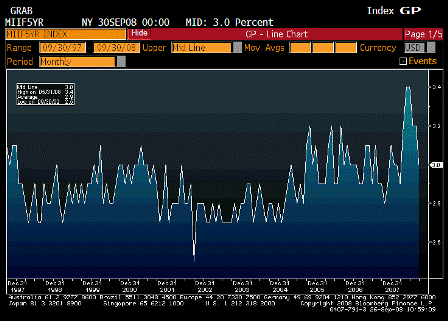
5 Year Inflation Expectations (Sep F)

Survey n/a
Actual 3.0%
Prior 2.9%
Revised n/a

 
Also nice to see that coming down.

[top][end]

Univ. of Michigan TABLE Inflation Expectations (Sep F)


[top]
2008-06-26 Daily US Economic Releases


[Skip to the end]


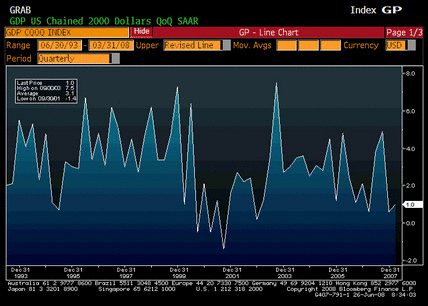
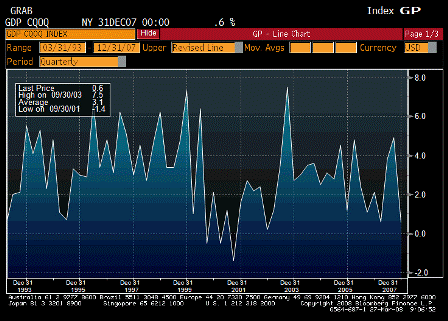
GDP QoQ Annualized (1Q F)

Survey 1.0%
Actual 1.0%
Prior 0.9%
Revised n/a

As expected.  Weak but no recession.

[top][end]


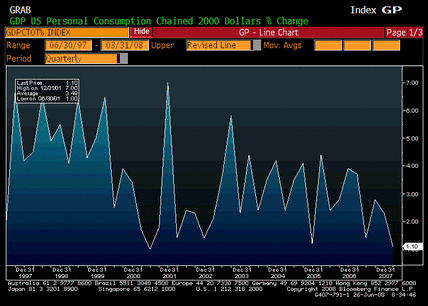
Personal Consumption (1Q F)

Survey 1.0%
Actual 1.1%
Prior 1.0%
Revised n/a

A touch better than expected with further improvement in Q2 still expected.

[top][end]


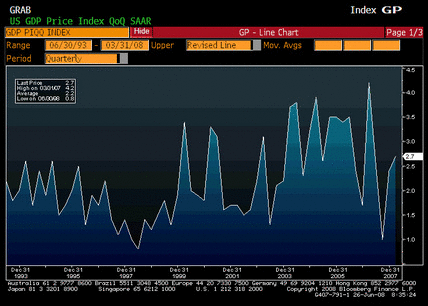
GDP Price Index (1Q F)

Survey 2.6%
Actual 2.7%
Prior 2.6%
Revised n/a

A bit worse than expected.

[top][end]


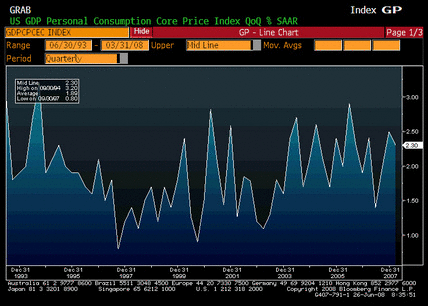
Core PCE QoQ (1Q F)

Survey 2.1%
Actual 2.3%
Prior 2.1%
Revised n/a

More than a bit worse than expected.
 
GDP better than expected, and inflation worse than expected was reflected in the Fed statement, but not in Fed action.

[top][end]


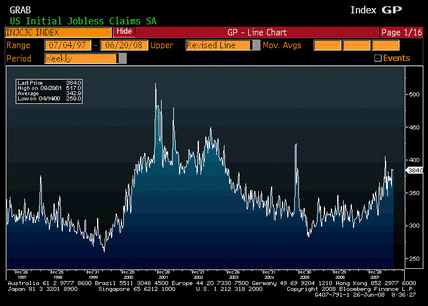
Initial Jobless Claims (Jun 21)

Survey 375K
Actual 384K
Prior 381K
Revised 384K

Unchanged from the previous week’s report that was revised up some.  Still in the new range.

[top][end]


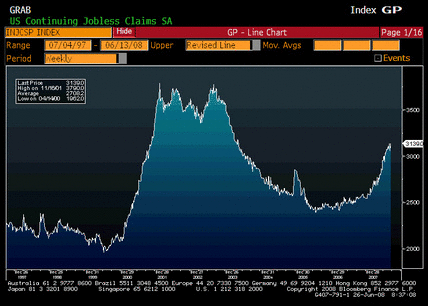
Continiuing Jobless Claims (Jun 14)

Survey 3105K
Actual 3139K
Prior 3060K
Revised 3057K

A little worse than expected, prior week revised down marginally.

Weak, but no recession yet.

[top][end]


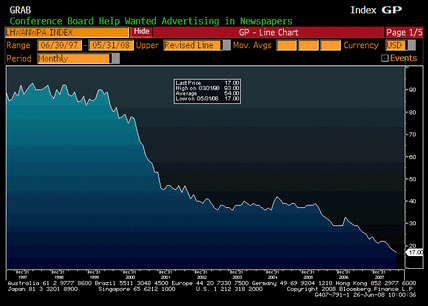
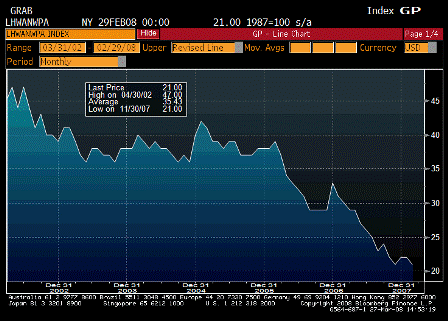
Help Wanted Index (May)

Survey 19
Actual 17
Prior 19
Revised 18

All evidence shows labor markets still soft.

[top][end]


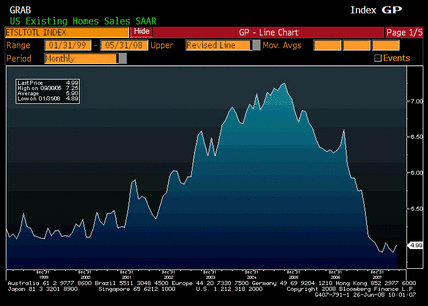
Existing Home Sales (May)

Survey 4.95M
Actual 4.99M
Prior 4.89M
Revised n/a

Continuing signs of a bottom.
 
Levels are too low given demographics and should recover substantially even with a weak market.

[top][end]


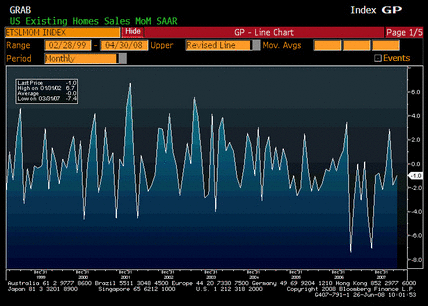
Existing Home Sales MoM (May)

Survey 1.2%
Actual 2.0%
Prior -1.0%
Revised n/a

Better than expected.

[top][end]


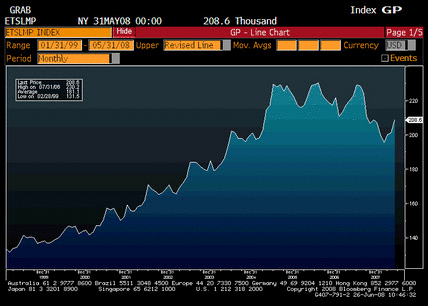
Existing Home Sales Median Price (May)

Survey n/a
Actual 208.6
Prior 201.2
Revised n/a

The upturn in prices wasn’t even reported by the mainstream press while the downturns were sensationalized.

[top][end]


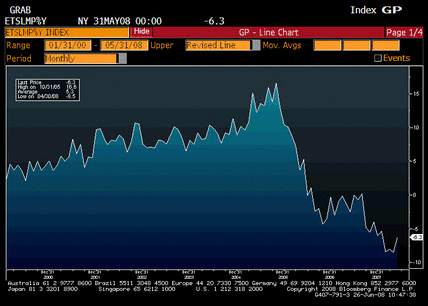
Existing Home Sales Median Price YoY (May)

Survey n/a
Actual -6.3%
Prior -8.5%
Revised n/a

Year over year price declines are far less than the case-shiller index which reports only on the largest metro areas.  OFHEO prices declined even less year over year.  Again, the mainstream media doesn’t report this and continues to repeat case-shiller numbers.

[top][end]


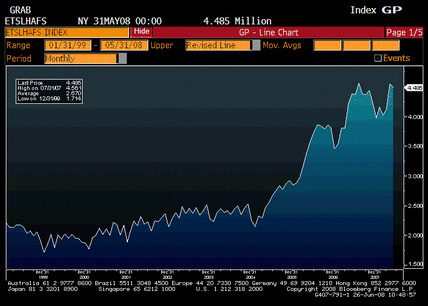
Existing Home Sales Inventories (May)

Survey n/a
Actual 4.485
Prior 4.549
Revised n/a

I thought the last spike up was suspect- might have had something to do with foreclosures hitting the list- and may now be turning down as well, following the actual numbers of new homes for sale which has been falling rapidly.

[top]
2008-03-27 US Economic Releases

2008-03-27 GDP Annualized

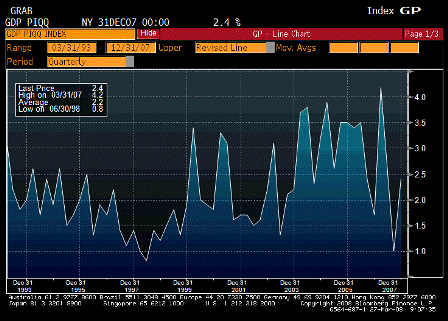
GDP Annualized (4Q F)

Survey 0.6%
Actual 0.6%
Prior 0.6%
Revised n/a

2008-03-27 Personal Consumption

Personal Consumption (4Q F)

Survey 1.9%
Actual 2.3%
Prior 1.9%
Revised n/a

Revised up to a very respectable number. And income remains positive, and employment is at high levels.


2008-03-27 GDP Price Index

GDP Price Index (4Q F)

Survey 2.7%
Actual 2.4%
Prior 2.7%
Revised n/a

A bit better than previously reported, but prices have subsequently gone much higher.


2008-03-27 Core PCE QoQ

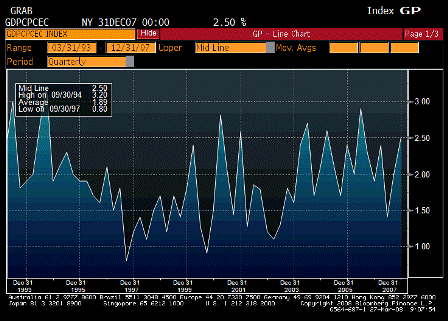
Core PCE QoQ (4Q F)

Survey 2.7%
Actual 2.5%
Prior 2.7%
Revised n/a

The Fed is more concerned about this and the evidence food and energy is getting passed through from headline to core measures.


2008-03-27 Initial Jobless Claims since 1998

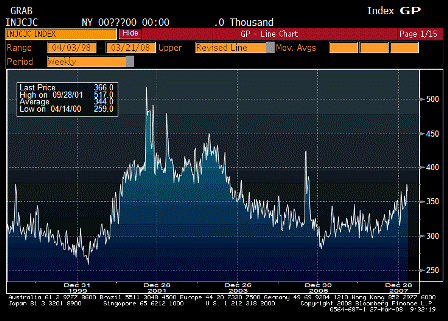
Initial Jobless Claims (Mar 22)

Survey 370K
Actual 366K
Prior 378K
Revised 375K

2008-03-27 Continuing Claims since 1998

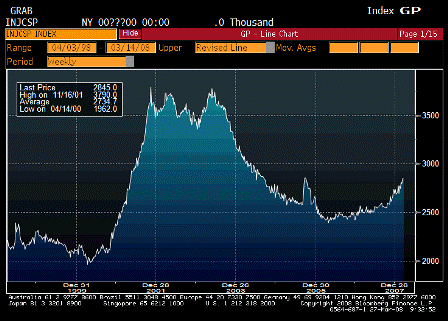
Continuing Claims (Mar 15)

Survey 2885K
Actual 2845K
Prior 2865K
Revised 2850K

Best guess:

The jobless recovery that morphed into the full employment recession now appears to be over with today’s jobless claims numbers leaning in the same direction as other data released earlier this week.

That does not mean the issues with the financial sector are all behind us – far from it.

It does mean the real economy has figured out how to move on with what’s left of the financial sector.


2008-03-27 Help Wanted Index

Help Wanted Index (Feb)

Survey 20
Actual 21
Prior 21
Revised 22

[comments]
2007-12-20 US Economic Releases

small 2007-12-20 GPD Annualized

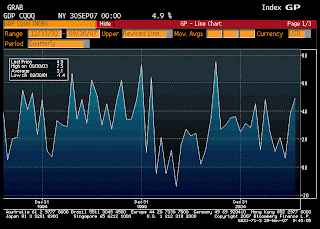
GDP Annualized (3QF)

Survey 4.9%
Actual 4.9%
Prior 4.9%
Revised n/a

small 2007-12-20 Personal Consumption

Personal Consumption (3QF)

Survey 42.8.9%
Actual 2.8%
Prior 2.7%
Revised n/a

2007-12-20 GDP Price Index

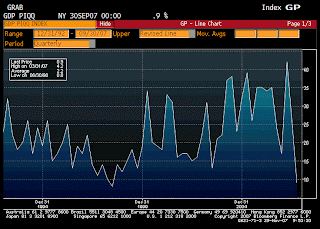
GDP Price Index (3QF)

Survey 0.9%
Actual 1.0%
Prior 0.9%
Revised n/a

Above numbers as expected.


small 2007-12-20 Core PCE QoQ

Core PCE QoQ (3QF)

Survey 1.8%
Actual 2.0%
Prior 1.8%
Revised n/a

This is now at the upper bound of the fed’s comfort zone.


2007-12-20 Initial Jobless Claims

Initial Jobless Claims (Dec 15)

Survey 335K
Actual 346K
Prior 333K
Revised 334K

Creeping up.

Fed gets concerned if it gets over 375K.


2007-12-20 Continuing Claims

Continuing Claims (Dec 8)

Survey 2610K
Actual 264K
Prior 2639K
Revised 2634K

Creeping up as well, but not yet a major concern.


2007-12-20 Leading Indicators

Leading Indicators (Nov)

Survey -0.3%
Actual -0.5%
Prior -0.5%
Revised n/a

Pretty much in line with expectations.


2007-12-20 Philadelphia Fed.

Philadelphia Fed. (Dec)

Survey 6.0%
Actual -5.7%
Prior 8.2%
Revised n/a

♥

2007-11-29 US Economic Releases

GCP Annualized (3QP)

Survey 4.8%
Actual 4.9%
Prior 3.9%
Revised n/a

Keeps coming in above expectations.


Personal Consumption (3QP)

Survey 2.9%
Actual 2.7%
Prior 3.0%
Revised n/a

A touch higher bust still seems very low.


GDP Price Index (3QP)

Survey 0.8%
Actual 0.9%
Prior 0.8%
Revised n/a

A touch higher bust still seems very low.


Core PCE QoQ (3QP)

Survey 1.8%
Actual 1.8%
Prior 1.8%
Revised n/a

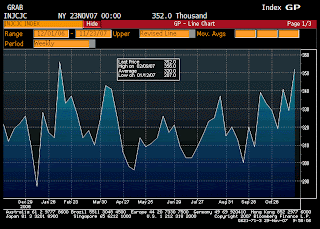
Initial Jobless Claims (Nov 24)

Survey 330K
Actual 352K
Prior 330K
Revised 329K

Thanksgiving week. Next week’s number is more informative.


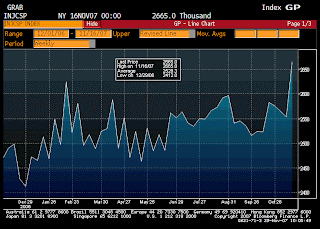
Continuing Claims (Nov 17)

Survey 2575K
Actual 2665K
Prior 2566K
Revised 2553K

Thanksgiving week. Next week’s number is more informative.


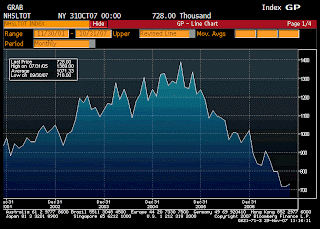
New Home Sales (Oct)

Survey 750K
Actual 728K
Prior 770K
Revised 716K

Up a touch from revised lower number, but still very low.


New Home Sales MoM (Oct)

Survey -2.6%
Actual 1.7%
Prior 4.8%
Revised -0.1%

Up a touch from revised lower number, but still very low.


Help Wanted Index (Oct)

Survey 23
Actual 23
Prior 24
Revised n/a

Thanksgiving week. Next week’s number is more informative.


House Price Index QoQ (3Q)

Survey -0.5%
Actual -0.4%
Prior 0.1%
Revised n/a

Moving lower.
Do you think any of this is below fed expectations as of October 31st?


♥