- GDP QoQ Annualized (Released 8:30 EST)
- GDP YoY Annualized Real (Released 8:30 EST)
- GDP YoY Annualized Nominal (Released 8:30 EST)
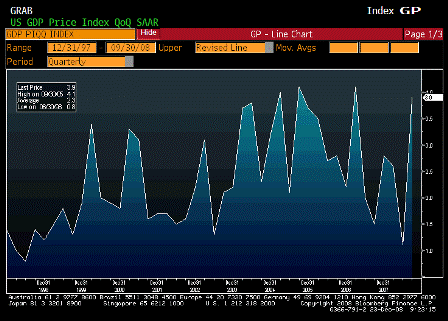
- GDP Price Index (Released 8:30 EST)
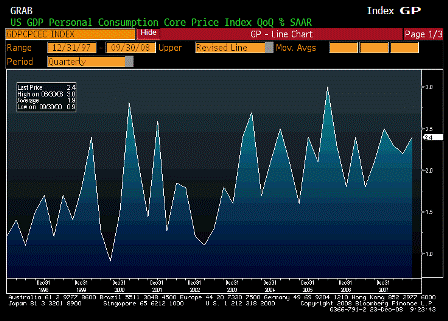
- Core PCE QoQ (Released 8:30 EST)
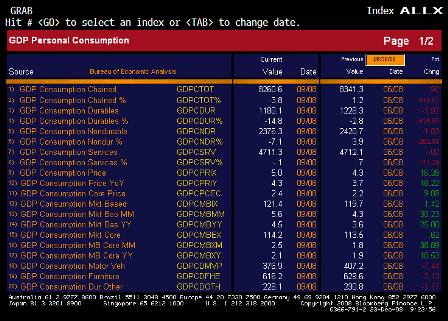
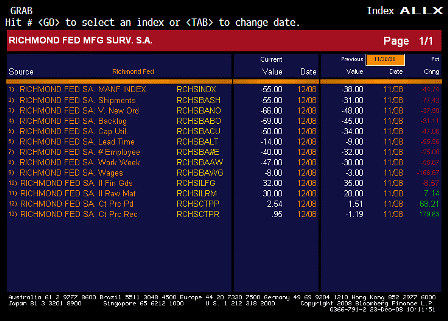
- GDP ALLX 1 (Released 8:30 EST)
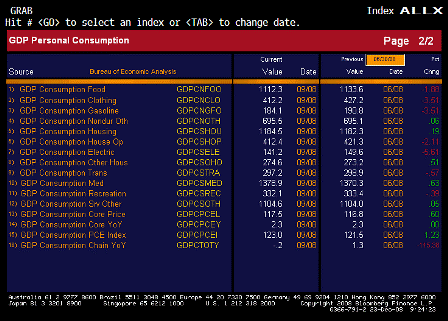
- GDP ALLX 2 (Released 8:30 EST)
- Personal Consumption (Released 8:30 EST)
- Employment Cost Index (Released 8:30 EST)
- Employment Cost Index ALLX (Released 8:30 EST)
- RPX Composite 28dy YoY (Released 9:00 EST)
- RPX Composite 28dy Index (Released 9:00 EST)
- Chicago Purchasing Manager (Released 9:45 EST)
- NAPM Milwaukee (Released 10:00 EST)
- U of Michigan Confidence (Released 10:00 EST)
- U of Michigan TABLE Inflation Expectations (Released 10:00 EST)
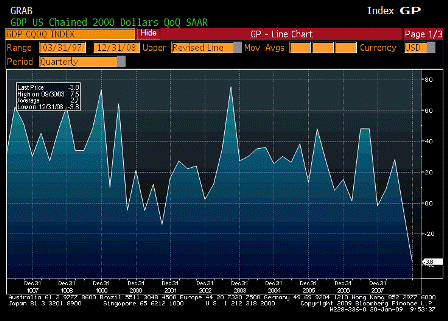
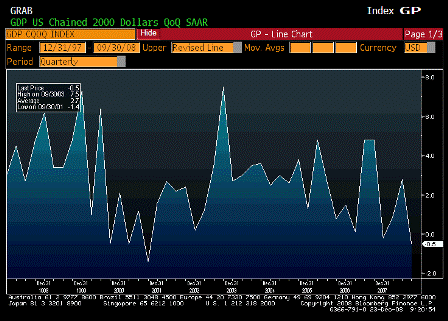
GDP QoQ Annualized (4Q A)
| Survey | -5.5% |
| Actual | -3.8% |
| Prior | -0.5% |
| Revised | n/a |
Karim writes:
Better than expected at -3.8% due to inventory build.
Here is the GDP math:
Private consumption (-2.5%) + Business Fixed Investment (-3.1%) + Government (+0.4%) + Net Exports (+0.1%) + Chg in Inventories (+1.3%)
- Real final sales of -5.1% were consistent with estimates.
- Business sector overestimated domestic demand, thereby accounting for the inventory build (should reverse in Q1).
- Core PCE deflator slowed from 2.4% to 0.6%.
- Within investment, both housing (-23.6%) and equipment/software (-27.8%) were very weak.
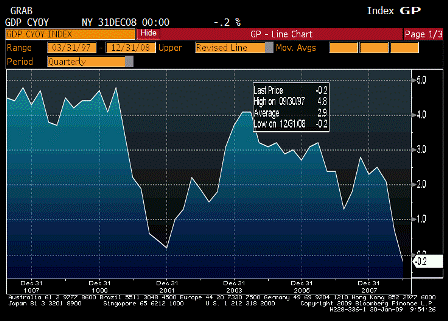
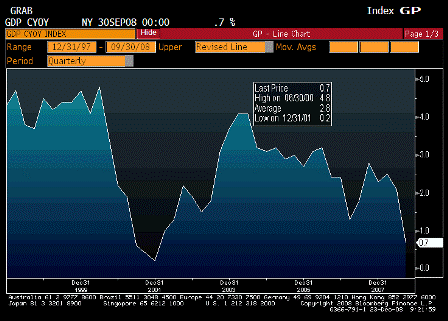
GDP YoY Annualized Real (4Q A)
| Survey | n/a |
| Actual | -0.2% |
| Prior | -0.7% |
| Revised | n/a |
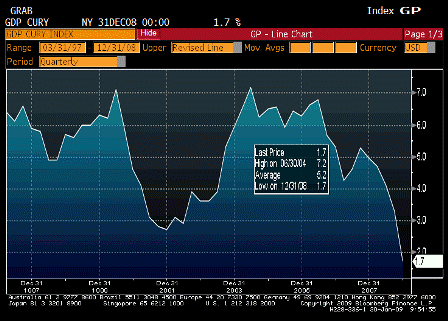
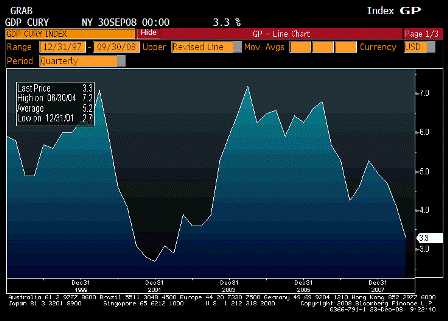
GDP YoY Annualized Nominal (4Q A)
| Survey | n/a |
| Actual | 1.7% |
| Prior | 3.3% |
| Revised | n/a |
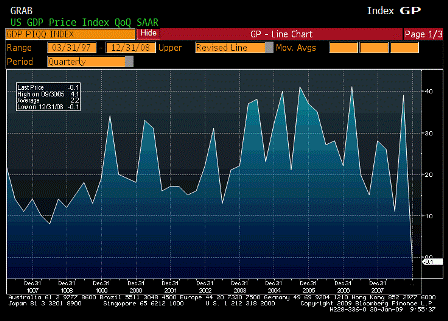
GDP Price Index (4Q)
| Survey | 0.4% |
| Actual | -0.1% |
| Prior | 3.9% |
| Revised | n/a |
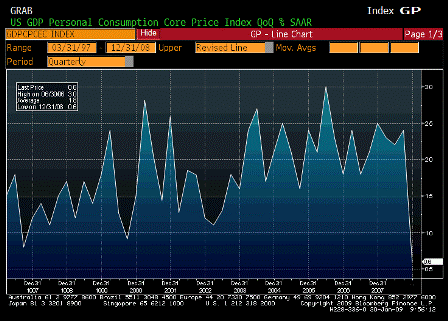
Core PCE QoQ (4Q)
| Survey | 1.0% |
| Actual | 0.6% |
| Prior | 2.4% |
| Revised | n/a |
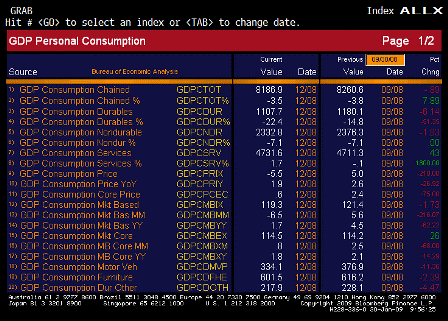
GDP ALLX 1 (4Q)
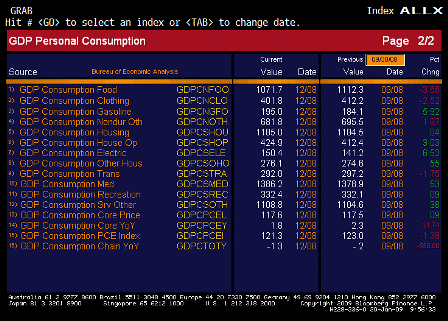
GDP ALLX 2 (4Q)
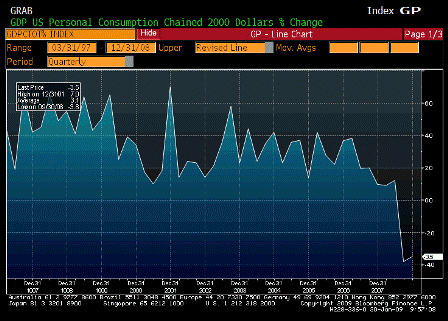
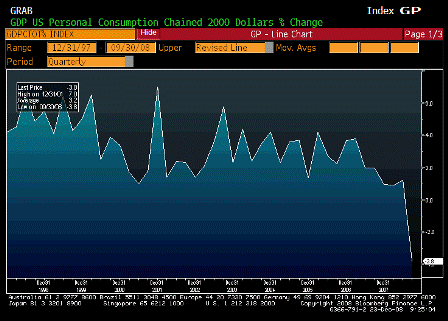
Personal Consumption (4Q)
| Survey | -3.5% |
| Actual | -3.5% |
| Prior | -3.8% |
| Revised | n/a |
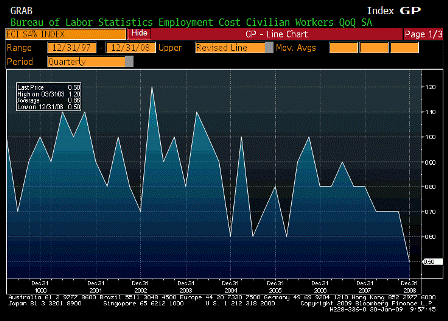
Employment Cost Index (4Q)
| Survey | 0.7% |
| Actual | 0.5% |
| Prior | 0.7% |
| Revised | n/a |
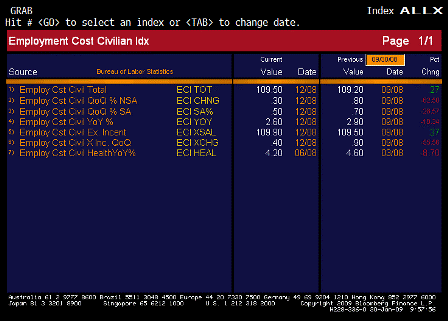
Employment Cost Index ALLX (4Q)
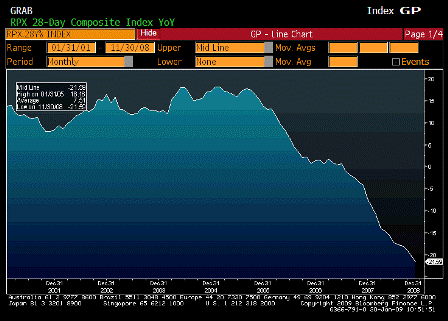
RPX Composite 28dy YoY (Nov)
| Survey | n/a |
| Actual | -21.59% |
| Prior | -20.14% |
| Revised | n/a |
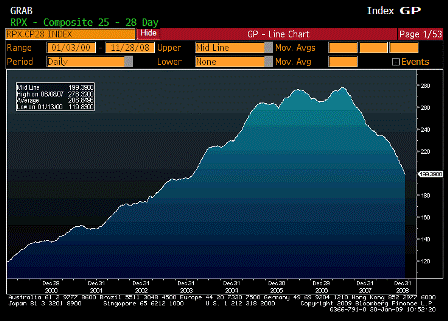
RPX Composite 28dy Index (Nov)
| Survey | n/a |
| Actual | 199.39 |
| Prior | 206.73 |
| Revised | n/a |
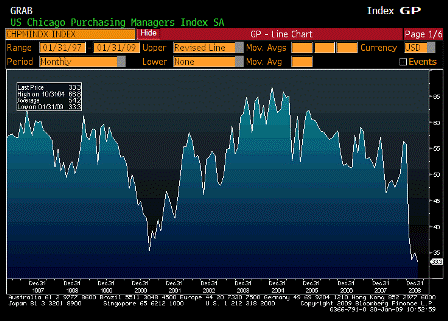
Chicago Purchasing Manager (Jan)
| Survey | 34.9 |
| Actual | 33.3 |
| Prior | 34.1 |
| Revised | 35.1 |
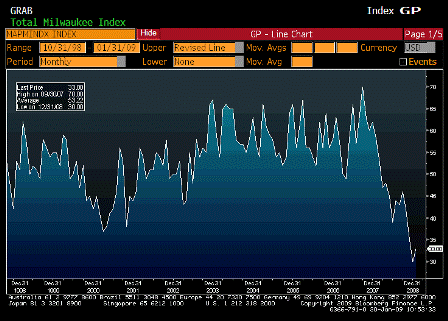
NAPM Milwaukee (Jan)
| Survey | n/a |
| Actual | 33.0 |
| Prior | 30.0 |
| Revised | n/a |
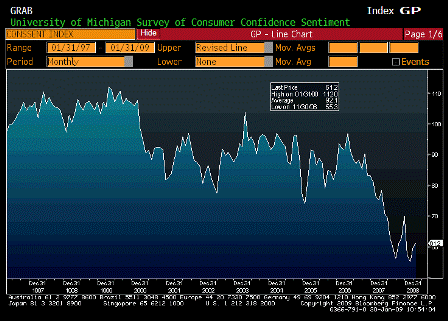
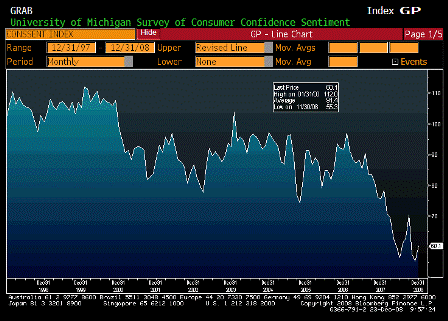
U of Michigan Confidence (Jan F)
| Survey | 61.9 |
| Actual | 61.2 |
| Prior | 61.9 |
| Revised | n/a |
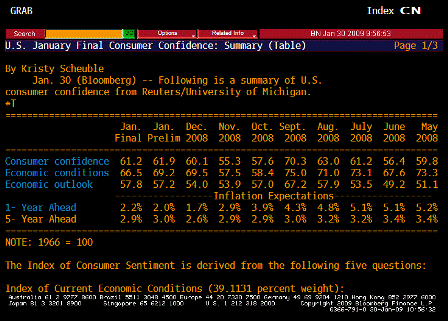
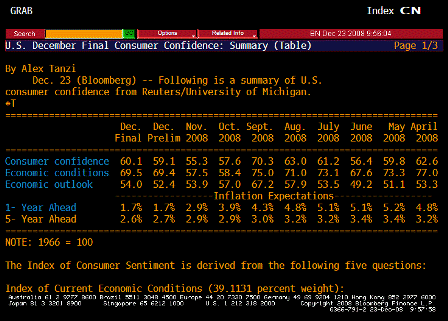
U of Michigan TABLE Inflation Expectations (Jan F)
[top]


