2009-04-23 USER


[Skip to the end]


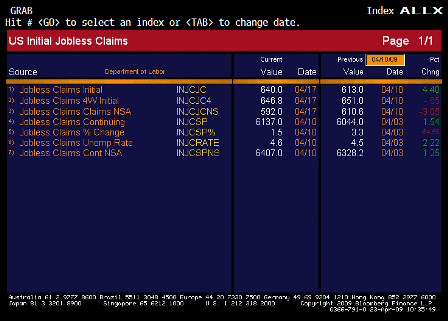
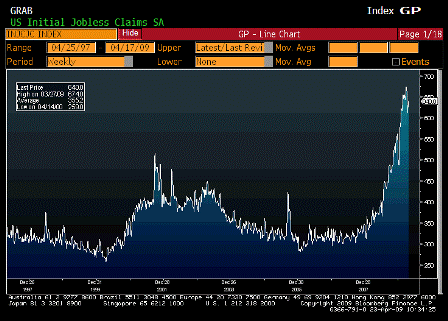
Initial Jobless Claims (Apr 18)

Survey 640K
Actual 640K
Prior 610K
Revised 613K

[top][end]

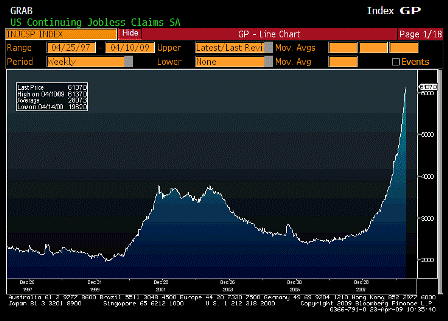
Continuing Claims (Apr 11)

Survey 6120K
Actual 6137K
Prior 6022K
Revised 6044K

[top][end]

Jobless Claims ALLX (Apr 18)

[top][end]


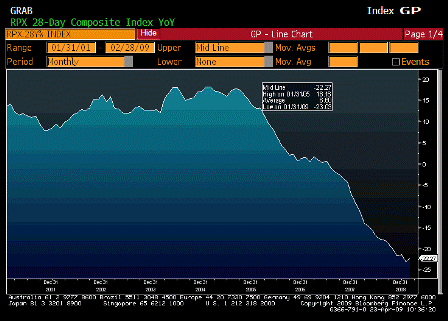
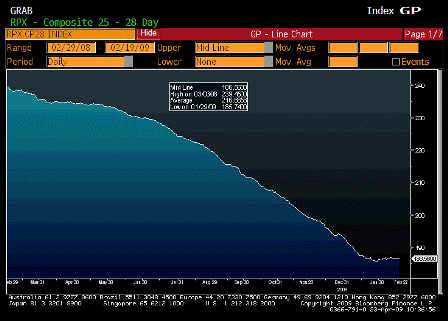
RPX Composite 28dy YoY (Feb)

Survey n/a
Actual -22.27%
Prior -23.03%
Revised n/a

[top][end]

RPX Composite 28dy Index (Feb)

Survey n/a
Actual 186.56
Prior 186.39
Revised n/a

[top][end]


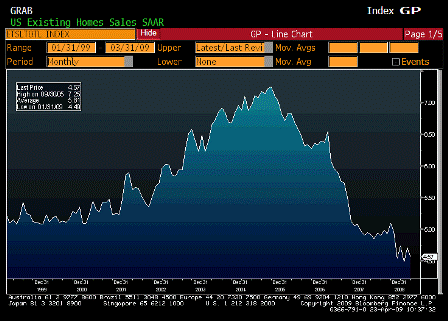
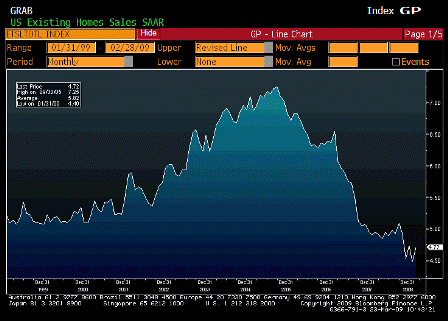
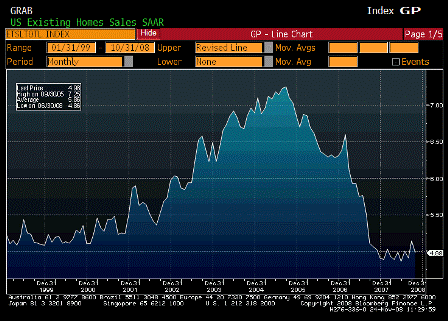
Existing Home Sales (Mar)

Survey 4.65M
Actual 4.57M
Prior 4.72M
Revised 4.71M

[top][end]

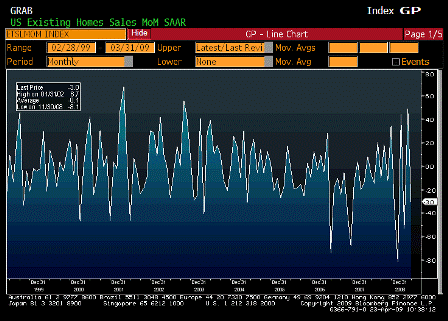
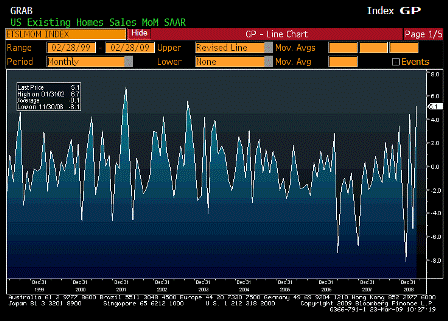
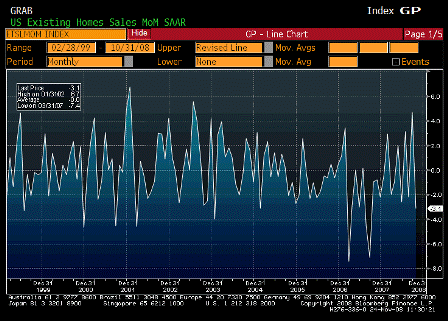
Existing Home Sales MoM (Mar)

Survey -1.5%
Actual -3.0%
Prior 5.1%
Revised 4.9%

[top][end]

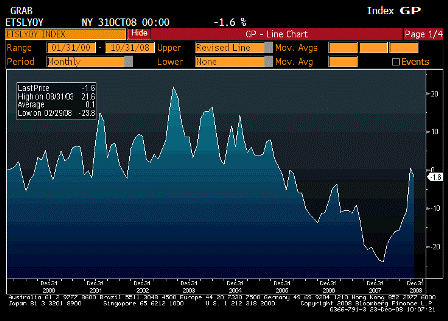
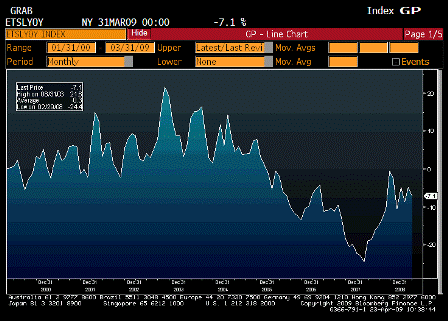
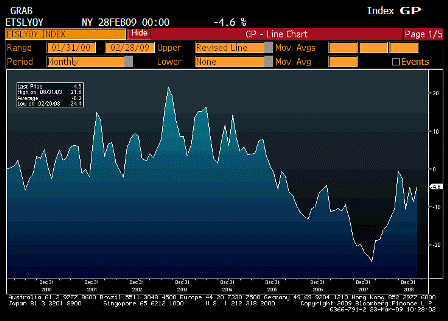
Existing Home Sales YoY (Mar)

Survey n/a
Actual -7.1%
Prior -4.8%
Revised n/a

[top][end]

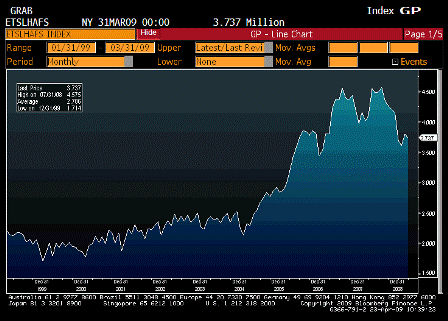
Existing Home Sales Inventory (Mar)

Survey n/a
Actual 3.737
Prior 3.798
Revised n/a

[top][end]

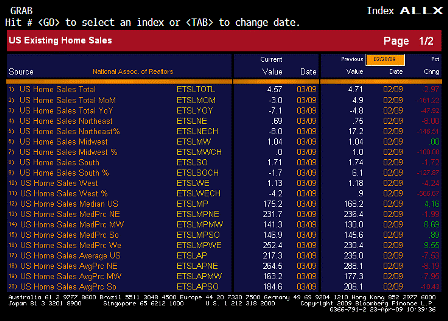
Existing Home Sales ALLX 1 (Mar)

[top][end]

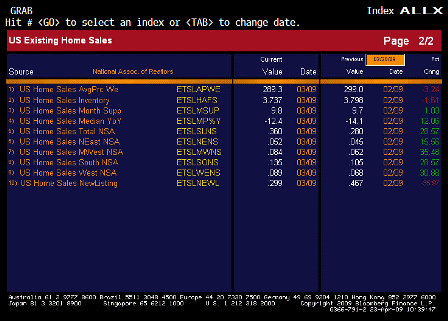
Existing Home Sales ALLX 2 (Mar)

[top][end]

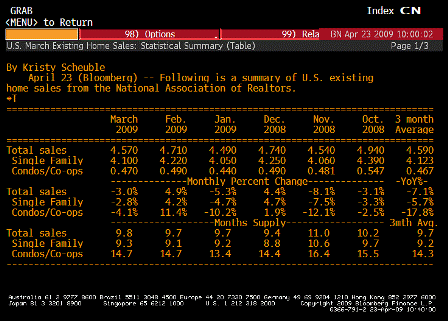
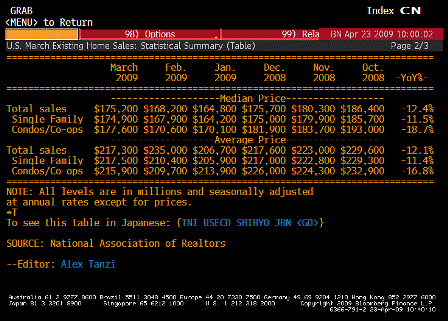
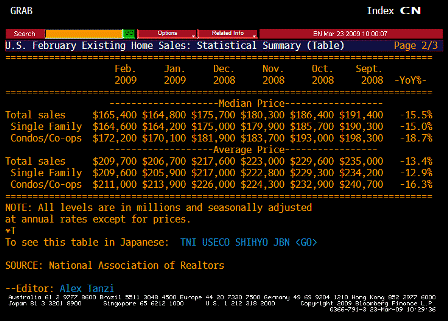
Existing Home Sales TABLE 1 (Mar)

[top][end]

Existing Home Sales TABLE 2 (Mar)


[top]

Existing Home Sales Rose 5.1% in February


[Skip to the end]

Typical biased reporting. The fall in price from last year is emphasized while the increase from last month isn’t even mentioned.

Existing Home Sales Rebound, but Prices Plunge

by Jeff Bater

Mar 23 (WSJ) — Existing-home sales rebounded in February, climbing above expectations, but prices plunged again.

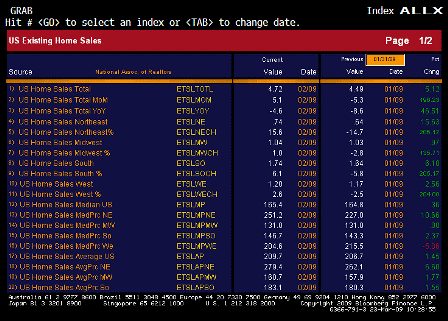
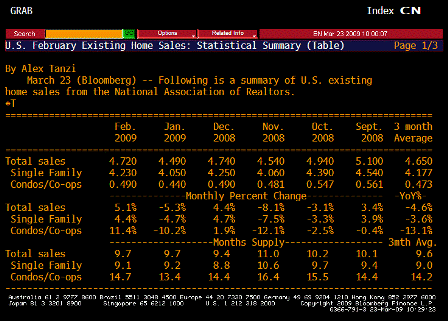
Home resales climbed to a 4.72 million annual rate, a 5.1% increase from January’s unrevised 4.49 million annual pace, the National Association of Realtors said Monday.

Foreclosures and short sales reflect about 45% of total existing-home sales. Distressed properties are discounted, so the abundance of these sales prices new homes out of the market, discouraging construction and weakening the overall housing sector further.

With so many distressed sales, the median price for an existing home fell last month. At $165,400 in February, the median price was down 15.5% from $195,800 in February 2008. The median price in January this year was $164,800. The 15.5% plunge is the second biggest ever, behind January’s 17.5% drop.


[top]

2009-03-23 USER


[Skip to the end]


Existing Home Sales (Feb)

Survey 4.45M
Actual 4.72M
Prior 4.49M
Revised n/a

[top][end]

Existing Home Sales MoM (Feb)

Survey -0.9%
Actual 5.1%
Prior -5.3%
Revised n/a

[top][end]

Existing Home Sales YoY (Feb)

Survey n/a
Actual -4.6%
Prior -8.6%
Revised n/a

[top][end]

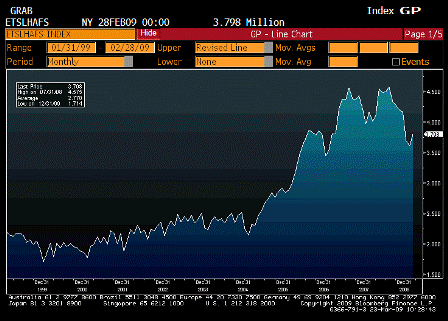
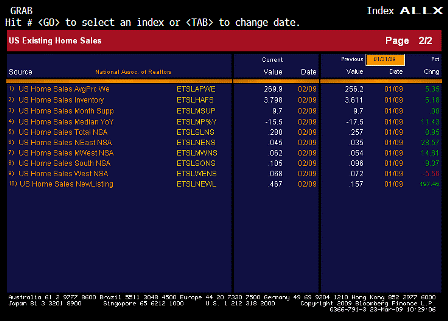
Existing Home Sales Inventory (Feb)

Survey n/a
Actual 3.798
Prior 3.611
Revised n/a

[top][end]

Existing Home Sales ALLX 1 (Feb)

[top][end]

Existing Home Sales ALLX 2 (Feb)

[top][end]

Existing Home Sales TABLE 1 (Feb)

[top][end]

Existing Home Sales TABLE 2 (Feb)


[top]

2009-02-25 USER


[Skip to the end]


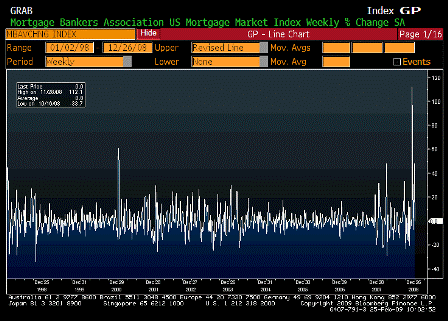
MBA Mortgage Applications (Feb 20)

Survey n/a
Actual -15.1%
Prior 45.7%
Revised n/a

[top][end]

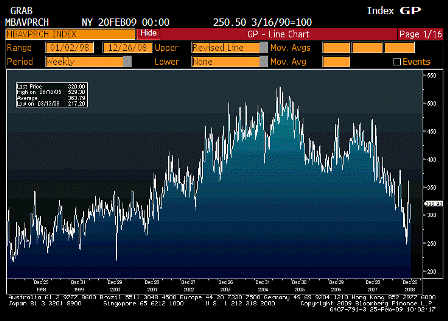
MBA Purchasing Applications (Feb 20)

Survey n/a
Actual 250.50
Prior 257.30
Revised n/a

[top][end]

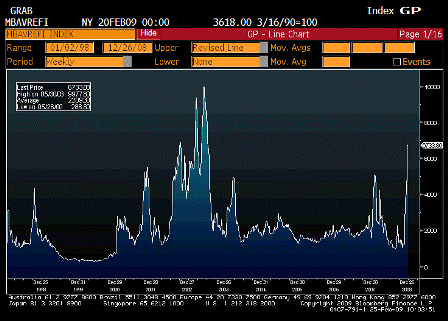
MBA Refinancing Applications (Feb 20)

Survey n/a
Actual 3618.00
Prior 4472.90
Revised n/a

[top][end]

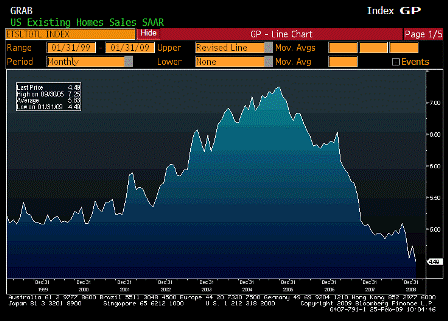
Existing Home Sales (Jan)

Survey 4.79M
Actual 4.49M
Prior 4.74M
Revised n/a

[top][end]

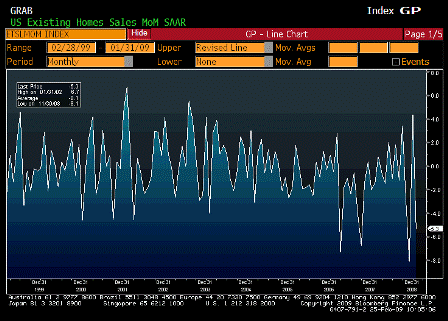
Existing Home Sales MoM (Jan)

Survey 1.1%
Actual -5.3%
Prior 6.5%
Revised 4.4%

[top][end]

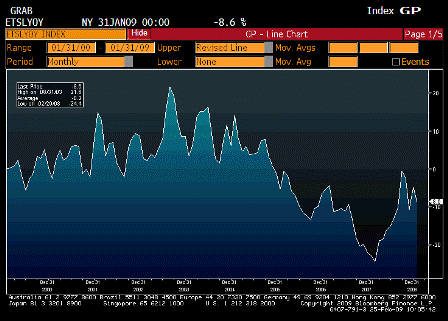
Existing Home Sales YoY (Jan)

Survey n/a
Actual -8.6%
Prior -4.8%
Revised n/a

[top][end]

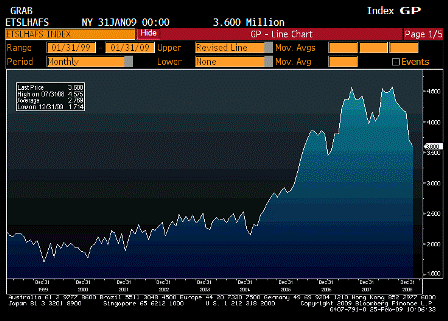
Existing Home Sales Inventory (Jan)

Survey n/a
Actual 3.600
Prior 3.700
Revised n/a

 
Foreclosure sales peaked?

[top][end]

Existing Home Sales ALLX 1 (Jan)

[top][end]

Existing Home Sales ALLX 2 (Jan)


[top]

2009-01-26 USER


[Skip to the end]


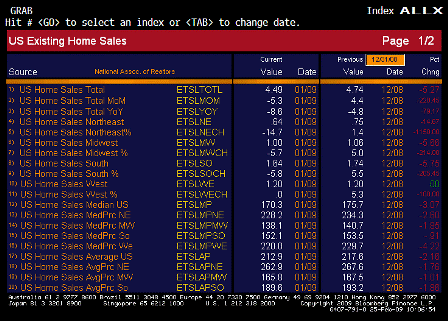
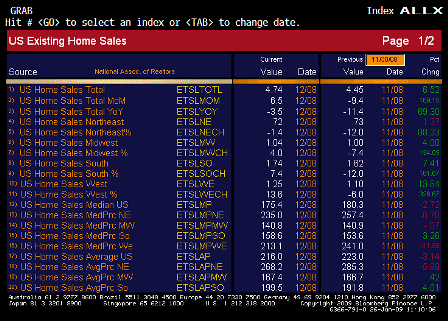
Existing Home Sales (Dec )

Survey 4.40M
Actual 4.74M
Prior 4.49M
Revised 4.45M

 
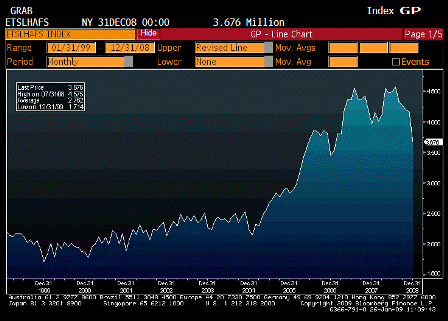
Existing home inventories now being worked off rapidly as foreclosure sales move through the pipeline.

Inventories in general are all very low in absolute terms.

[top][end]

Existing Home Sales MoM (Dec)

Survey -2.0%
Actual 6.5%
Prior -8.6%
Revised 9.4%

[top][end]

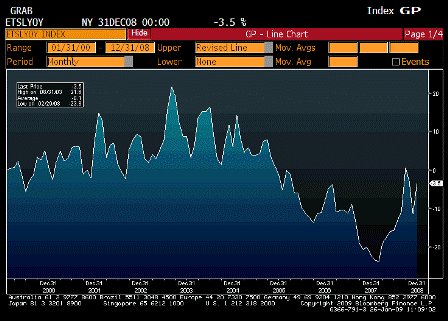
Existing Home Sales YoY (Dec)

Survey n/a
Actual -3.5%
Prior -11.4%
Revised n/a

[top][end]

Existing Home Sales Inventory (Dec)

Survey n/a
Actual 3.676
Prior 4.163
Revised n/a

[top][end]

Existing Home Sales ALLX 1 (Dec)

[top][end]

Existing Home Sales ALLX 2 (Dec)

[top][end]

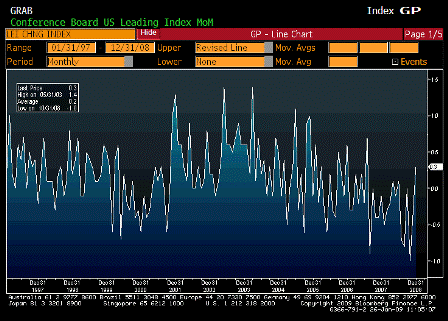
Leading Indicators (Dec)

Survey -0.2%
Actual 0.3%
Prior -0.4%
Revised n/a

[top][end]

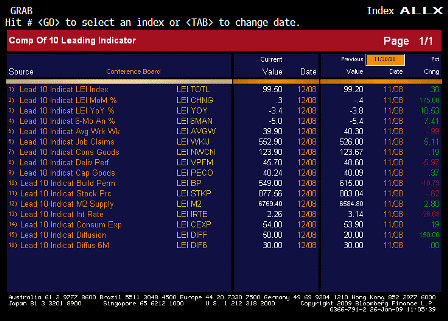
Leading Indicators ALLX (Dec)


[top]

2008-12-23 USER


[Skip to the end]


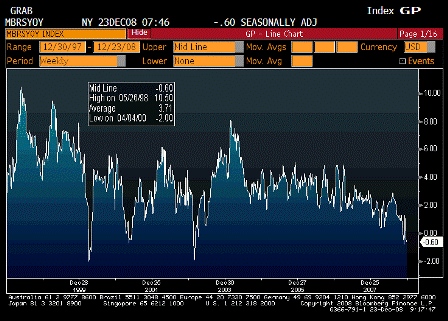
ICSC UBS Store Sales YoY (Dec 23)

Survey n/a
Actual -0.60%
Prior -0.40%
Revised n/a

 
Continues to slip.

[top][end]

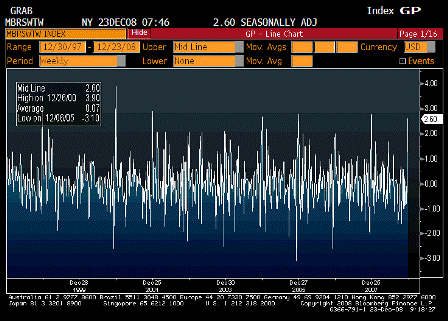
ICSC UBS Store Sales WoW (Dec 23)

Survey n/a
Actual 2.60%
Prior 0.60%
Revised n/a

 
Cheaper gasoline helping some?

[top][end]
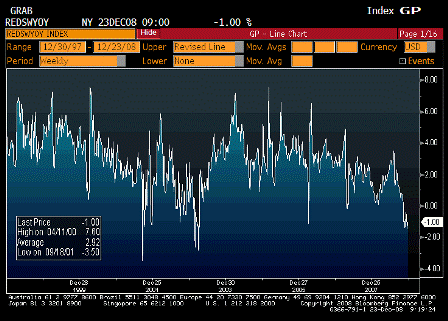
Redbook Store Sales Weekly YoY (Dec 16)

Survey n/a
Actual -1.00%
Prior -1.40%
Revised n/a

 
Still slipping.

[top][end]

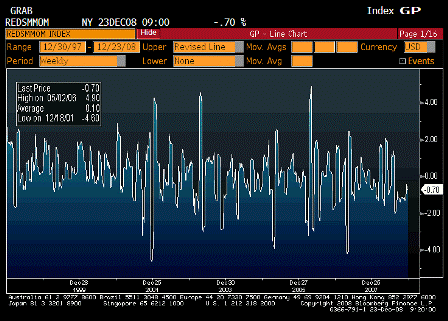
Redbook Store Sales MoM (Dec 16)

Survey n/a
Actual -0.70%
Prior -0.70%
Revised n/a

 
Still slipping.

No meaningul sign of cheaper gasoline helping here yet.

[top][end]
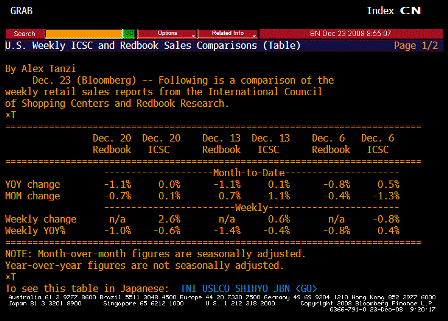
ICSC UBS Redbook Comparison TABLE (Dec 16)

[top][end]
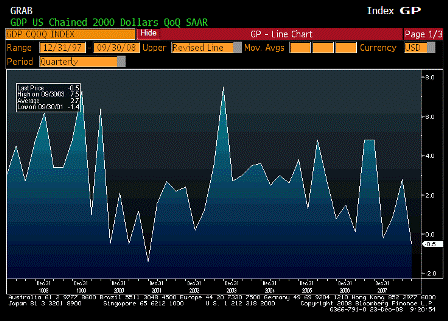

GDP QoQ Annualized (3Q F)

Survey -0.5%
Actual -0.5%
Prior -0.5%
Revised n/a

 
As expected.

[top][end]

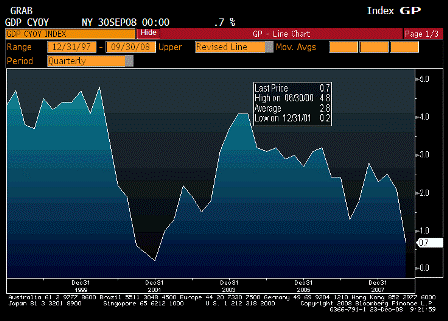
GDP YoY Annualized Real (3Q F)

Survey n/a
Actual 0.70%
Prior 2.1%
Revised n/a

 
Tiny positive for the year.

Next quarter looking negative.

[top][end]
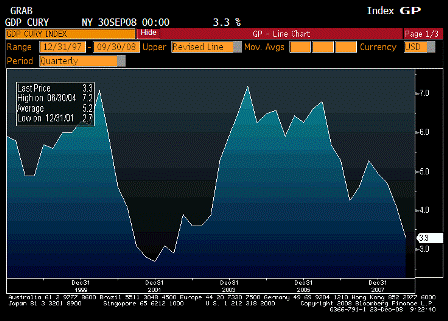
GDP YoY Annualized Nominal (3Q F)

Survey n/a
Actual 3.3%
Prior 4.1%
Revised n/a

 
This is heading to new lows as well.

[top][end]
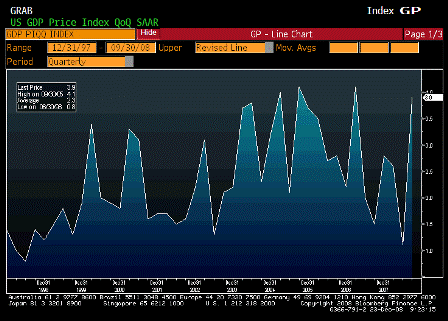
GDP Price Index (3Q F)

Survey 4.25
Actual 3.9%
Prior 4.2%
Revised n/a

 
Should reverse.

[top][end]

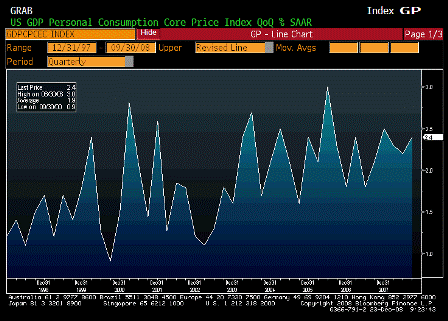
Core PCE QoQ (3Q F)

Survey 2.6%
Actual 2.4%
Prior 2.6%
Revised n/a

 
Should reverse some.

[top][end]

GDP ALLX 1 (3Q F)

[top][end]
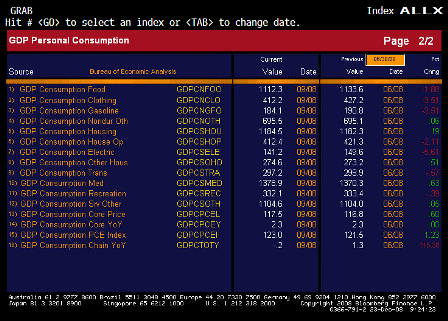
GDP ALLX 2 (3Q F)

[top][end]
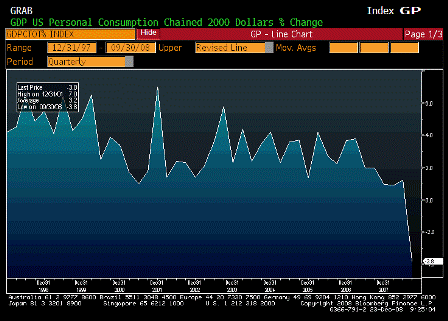

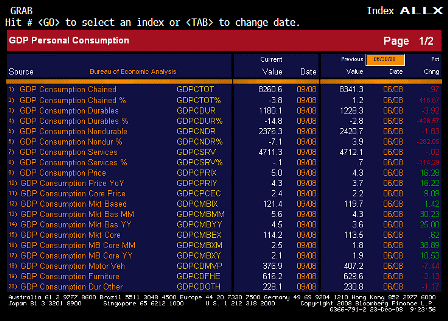
Personal Consumption (3Q F)

Survey -3.7%
Actual -3.8%
Prior -3.7%
Revised n/a

 
Sudden fall from ‘muddling through’ to recession.

[top][end]
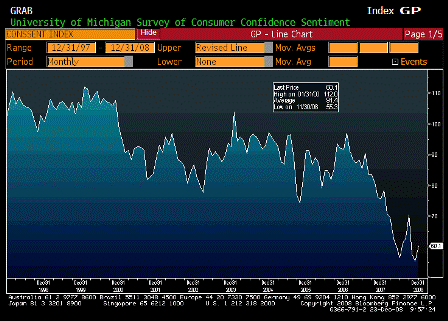
Univ of Michigan Confidence (Dec F)

Survey 58.8
Actual 60.1
Prior 59.1
Revised n/a

 
Gasoline prices helping here.

[top][end]
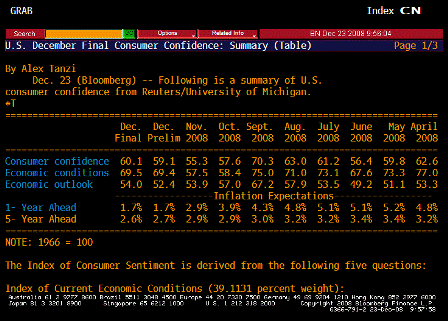
Univ of Michigan TABLE Inflation Expectations (Dec F)

 
Back to where the Fed wants them to be.

[top][end]
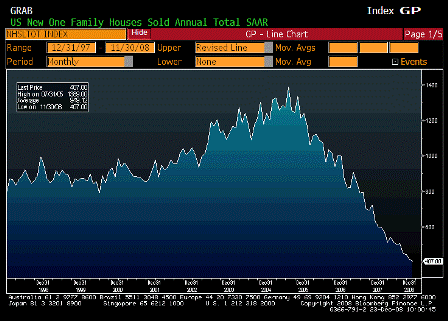

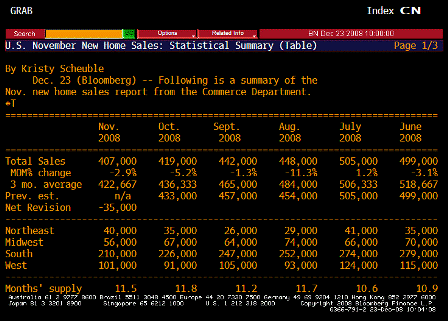
New Home Sales (Nov)

Survey 415k
Actual 407k
Prior 433k
Revised 419k

 
A bit lower than expected and last month revised down some.

[top][end]
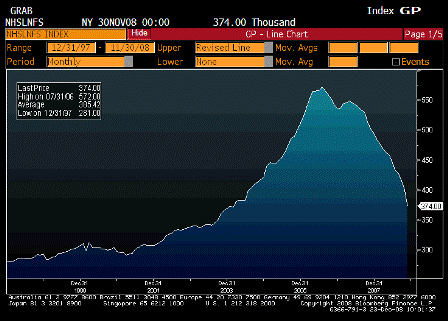
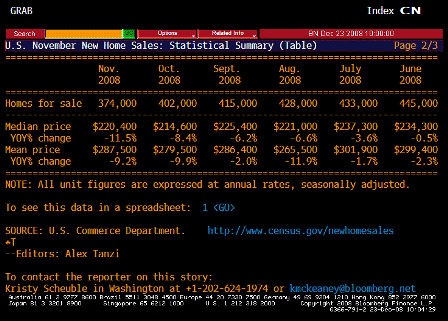
New Home Sales Total for Sale (Nov)

Survey n/a
Actual 374.00
Prior 402.00
Revised n/a

 
Down to very low levels and one reason sales are low.

[top][end]
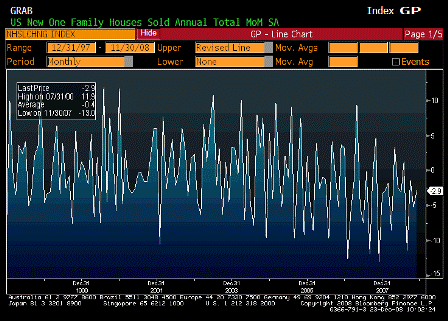
New Home Sales MoM (Nov)

Survey n/a
Actual -2.9%
Prior -5.2%
Revised n/a

[top][end]

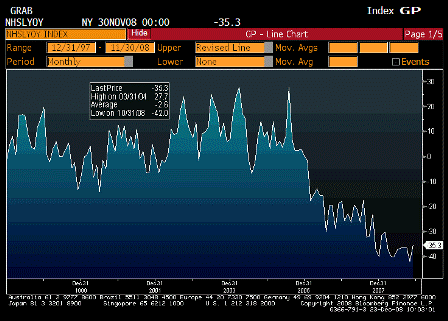
New Home Sales YoY (Nov)

Survey n/a
Actual -35.3%
Prior -42.0%
Revised n/a

[top][end]

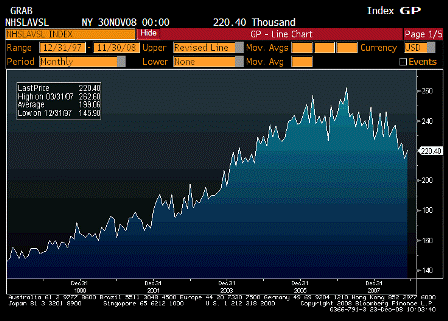
New Home Sales Median Price (Nov)

Survey n/a
Actual 220.40
Prior 214.60
Revised n/a

 
Up, but still trending lower.

[top][end]
New Home Sales TABLE 1 (Nov)

[top][end]
New Home Sales TABLE 2 (Nov)

[top][end]
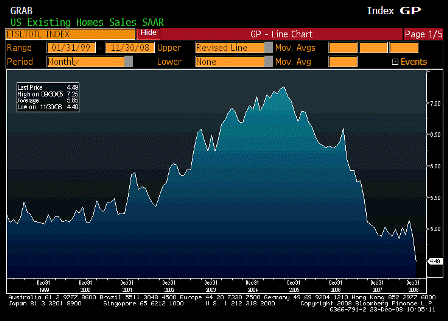

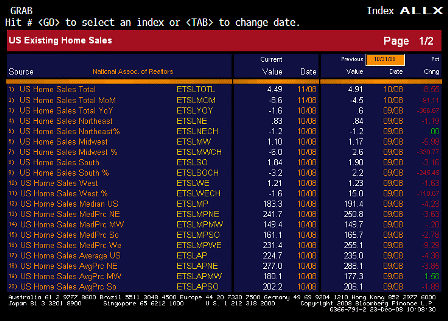
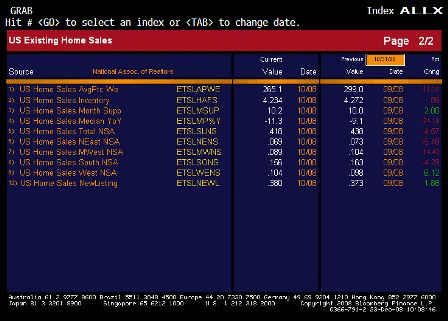
Existing Home Sales (Nov)

Survey 4.93M
Actual 4.49M
Prior 4.98M
Revised 4.91M

 
Large drop.

[top][end]

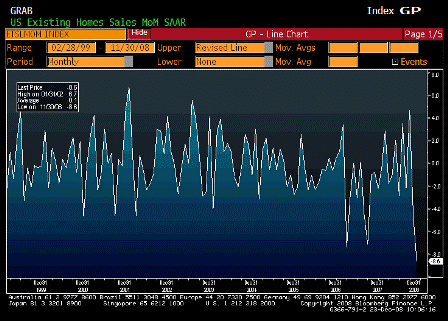
Existing Home Sales MoM (Nov)

Survey -1.0%
Actual -8.6%
Prior -3.1%
Revised -4.5%

[top][end]

Existing Home Sales YoY (Nov)

Survey n/a
Actual -1.6%
Prior 0.6%
Revised n/a

 
Still well off the bottom.

[top][end]

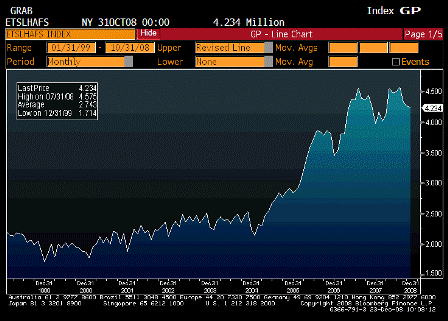
Existing Home Sales Inventory (Nov)

Survey n/a
Actual 4.234
Prior 4.272
Revised n/a

 
Falling some, but new foreclosures probably keeping this high.

[top][end]
Existing Home Sales ALLX 1 (Nov)

[top][end]
Existing Home Sales ALLX 2 (Nov)

[top][end]
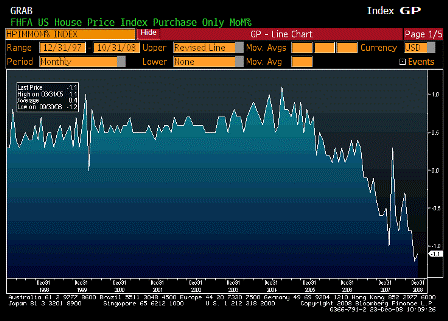

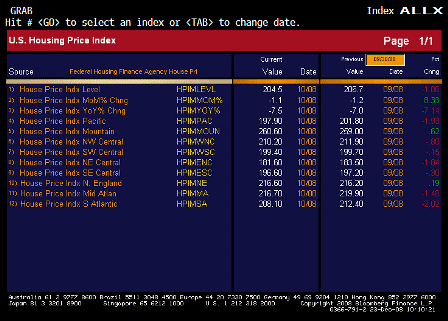
House Price Index MoM (Oct)

Survey -1.3%
Actual -1.1%
Prior -1.3%
Revised -1.2%

 
Still falling.

[top][end]

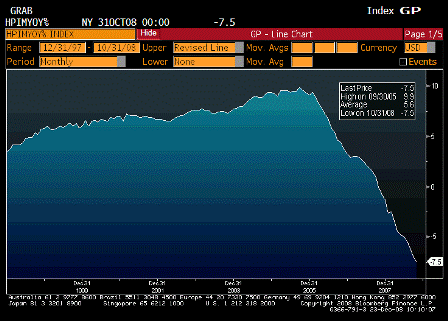
House Price Index YoY (Oct)

Survey n/a
Actual -7.5%
Prior -7.0%
Revised n/a

 
No bottom in sight yet.

[top][end]

House Price Index ALLX (Nov)

[top][end]
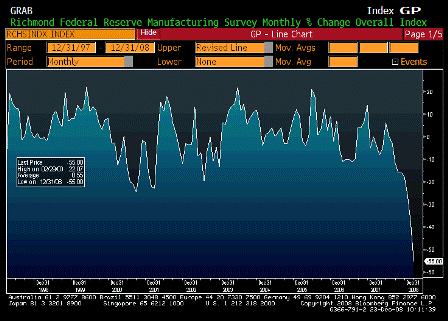
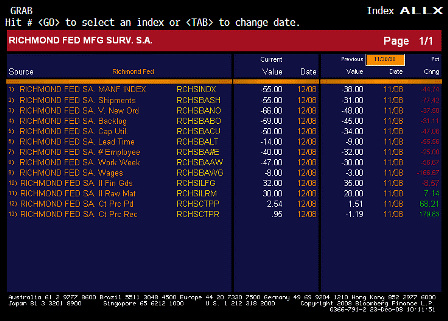
Richmond Fed Manufacturing Index (Dec)

Survey -40
Actual -55
Prior -38
Revised n/a

 
Very weak.

[top][end]

Richmond Fed Manufacturing Index ALLX (Dec)


[top]
2008-11-24 USER


[Skip to the end]


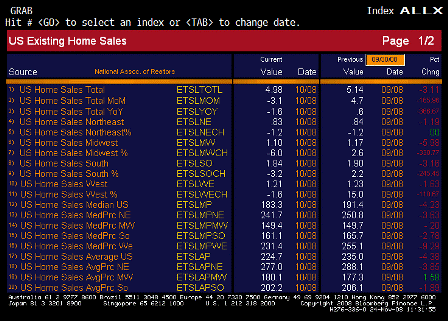
Existing Home Sales (Oct)

Survey 5.00M
Actual 4.98M
Prior 5.18M
Revised 5.14M

 
Down a bit but not through the lows as foreclosure sales continue.

[top][end]

Existing Home Sales MoM (Oct)

Survey -3.5%
Actual -3.1%
Prior 5.5%
Revised 4.7%

[top][end]

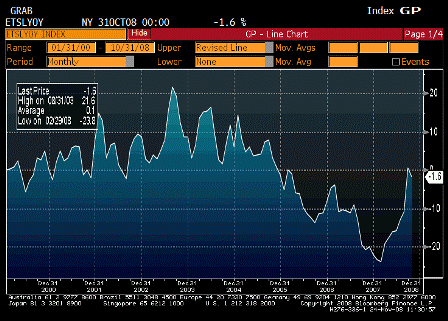
Existing Home Sales YoY (Oct)

Survey n/a
Actual -1.6%
Prior 0.6%
Revised n/a

 
Down a bit but still off the lows as foreclosure sales continue.

[top][end]

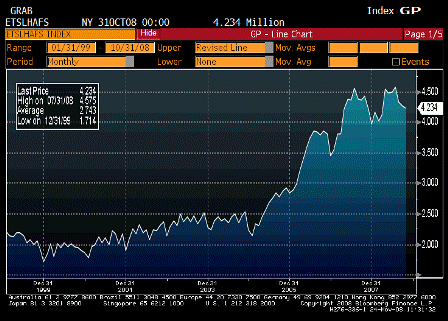
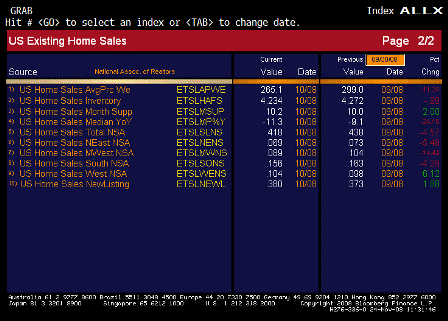
Existing Home Sales Inventory (Oct)

Survey n/a
Actual 4.234
Prior 4.272
Revised n/a

 
Starting to make progress as actual inventories decline.

[top][end]

Existing Home Sales ALLX 1 (Oct)

[top][end]

Existing Home Sales ALLX 2 (Oct)


[top]
2008-10-24 USER


[Skip to the end]


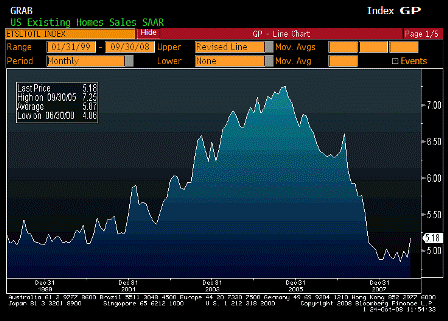
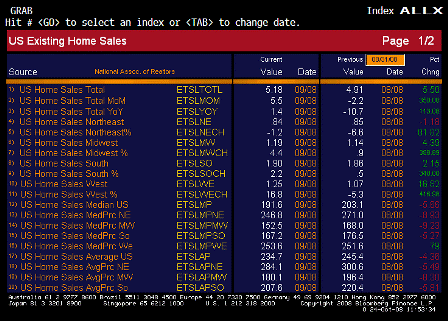
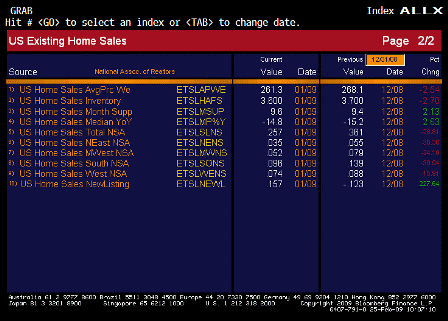
Existing Home Sales (Sep)

Survey 4.95M
Actual 5.18M
Prior 4.91M
Revised n/a

 
A little surprise blip up as foreclosed property sellers hit bids.

[top][end]

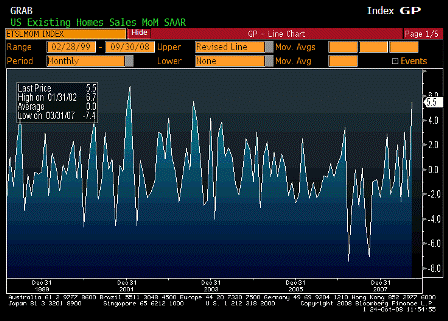
Existing Home Sales MoM (Sep)

Survey 0.8%
Actual 5.5%
Prior -2.2%
Revised n/a

 
Same as above.

[top][end]

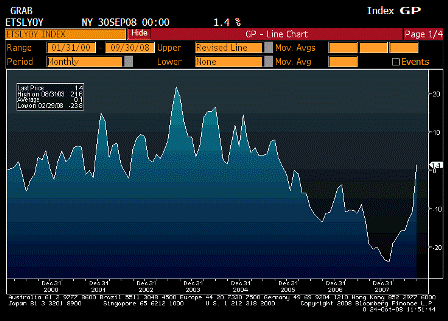
Existing Home Sales YoY (Sep)

Survey n/a
Actual 1.4%
Prior -10.7%
Revised n/a

 
Same as above.

[top][end]

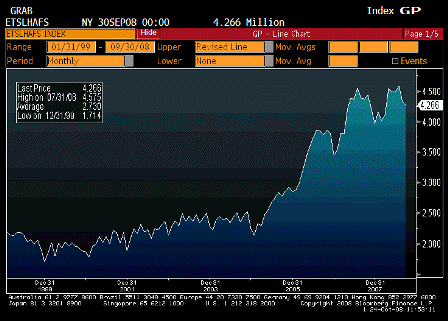
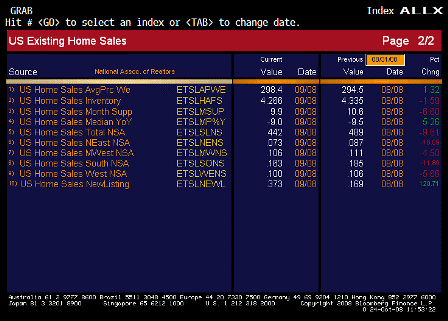
Existing Home Sales Inventory (Sep)

Survey n/a
Actual 4.266
Prior 4.335
Revised n/a

 
Lower inventories means foreclosures are being sold at a faster rate than new loans are going into foreclosure.

That’s a good sign.

[top][end]

Existing Home Sales ALLX 1 (Sep)

[top][end]

Existing Home Sales ALLX 2 (Sep)


[top]
2008-09-24 USER


[Skip to the end]


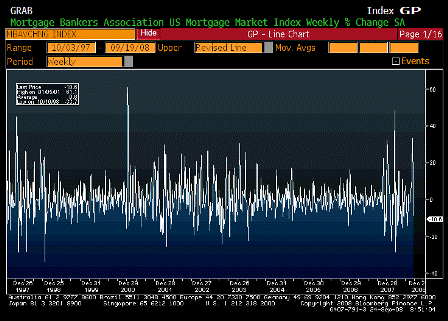
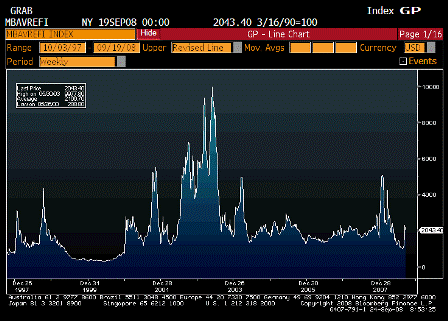
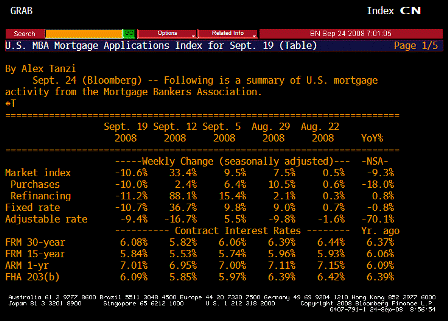
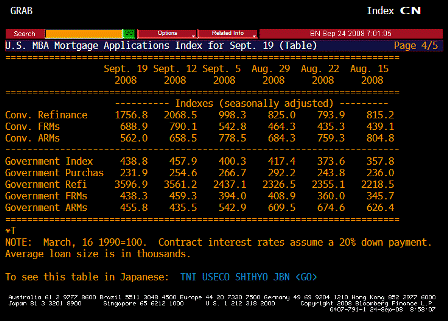
MBA Mortgage Applications (Sep 19)

Survey n/a
Actual -10.6%
Prior 33.4%
Revised n/a

 
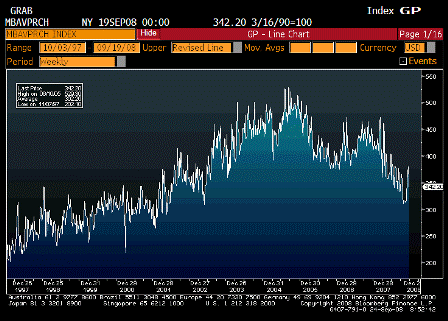
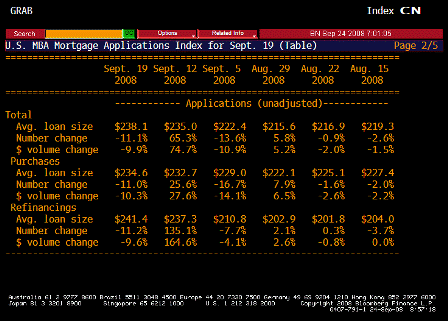
The MBA index of loan requests for home purchases fell 10 percent to 342.2.

Not good, but down from a larger spike last week, and still well above the lows.

Housing still looks to have bottomed albeit from very low levels.

[top][end]

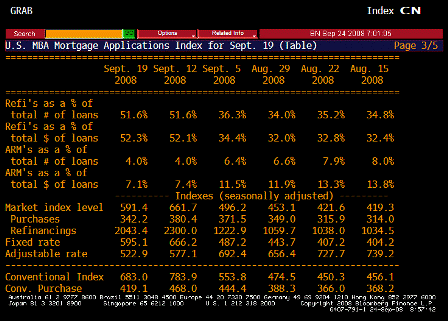
MBA Mortgage Purchasing (Sep 19)

Survey n/a
Actual 342.2
Prior 380.4
Revised n/a

 
A move down after a larger spike up, still off the bottom.

[top][end]

MBA Mortgage Refinancing (Sep 19)

Survey n/a
Actual 2043.4
Prior 2300.0
Revised n/a

[top][end]

MBA Mortgage Applications TABLE (Sep 19)

[top][end]

MBA Mortgage Applications TABLE 2 (Sep 19)

[top][end]

MBA Mortgage Applications TABLE 3 (Sep 19)

[top][end]

MBA Mortgage Applications TABLE 4 (Sep 19)

[top][end]


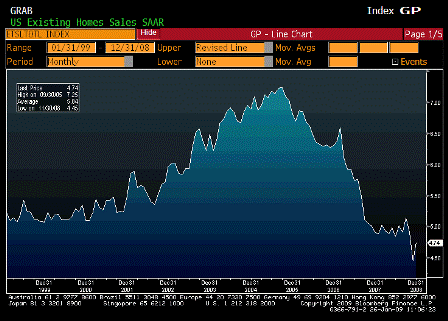
Existing Home Sales (Aug)

Survey 4.94M
Actual 4.91M
Prior 5.00M
Revised 5.02M

 
A bit worse than expected, prior revised up a bit. Still looks like it’s past the bottom.

[top][end]

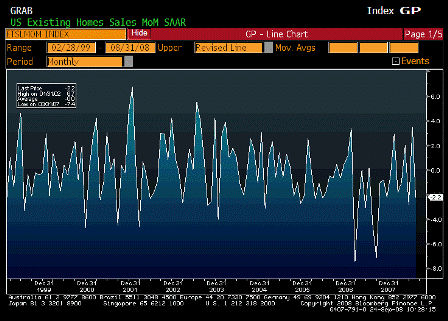
Existing Home Sales MoM (Aug)

Survey -1.2%
Actual -2.2%
Prior 3.1%
Revised 3.5%

 
Also worse than expected, and last month revised up.

[top][end]

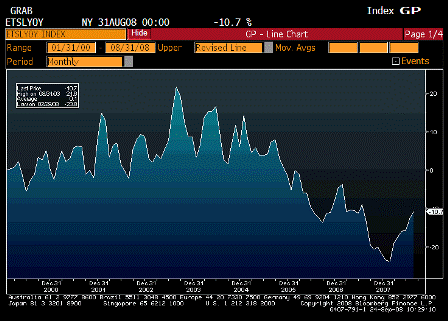
Existing Home Sales YoY (Aug)

Survey n/a
Actual -10.7%
Prior -12.8%
Revised n/a

 
Declines still dimishing.

[top][end]

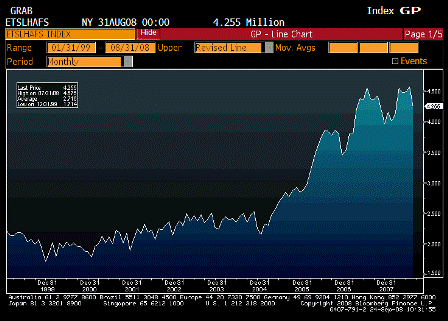
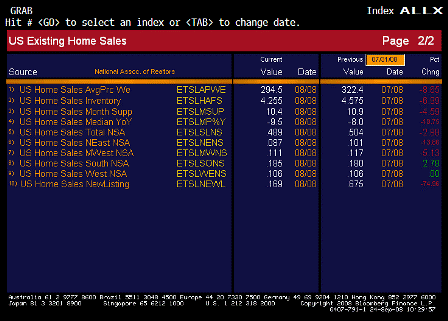
Existing Home Sales Inventory (Aug)

Survey n/a
Actual 4.255M
Prior 4.575M
Revised n/a

 
Good size drop as foreclosures get liquidated.
Along with plunging new home inventories and a lot of existing homes not livable, it looks to me like supply is starting to get thin.

[top][end]

Existing Home Sales ALLX 1 (Aug)

[top][end]

Existing Home Sales ALLX 2 (Aug)


[top]
2008-08-25 US Economic Releases


[Skip to the end]
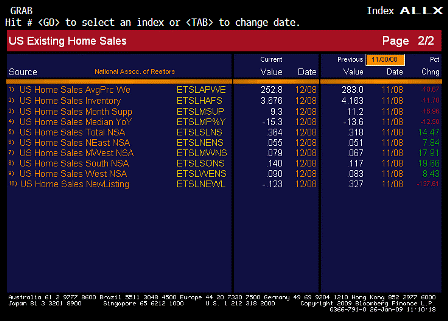

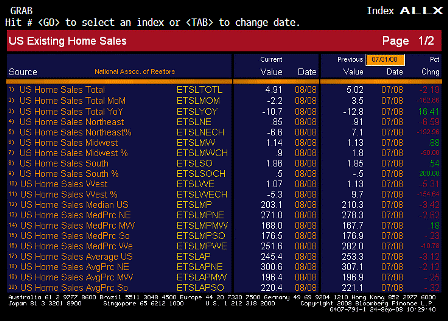
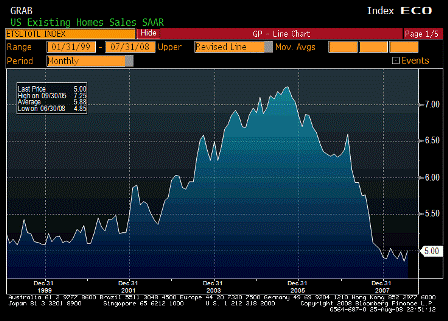
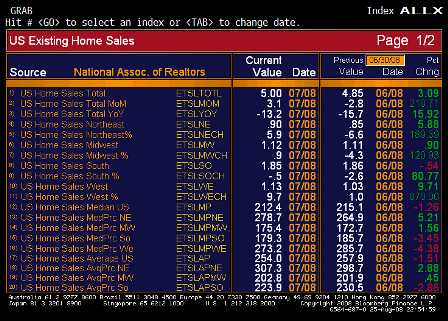
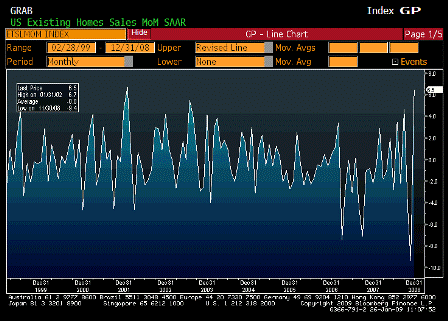
Existing Home Sales (Jul)

Survey 4.91M
Actual 5.00M
Prior 4.86M
Revised 4.85M

[top][end]
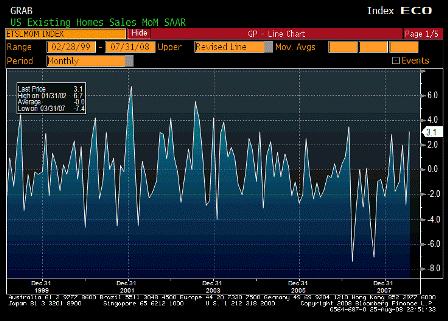
Existing Home Sales MoM (Jul)

Survey 1.0%
Actual 3.1%
Prior -2.6%
Revised -2.8%

[top][end]

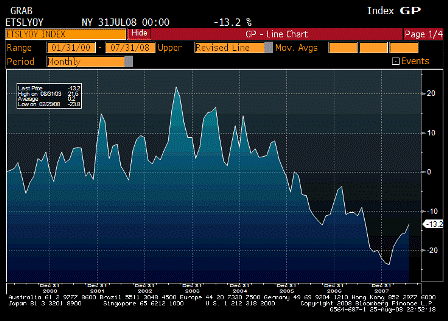
Existing Home Sales YoY (Jul)

Survey n/a
Actual -13.2%
Prior -15.7%
Revised n/a

[top][end]

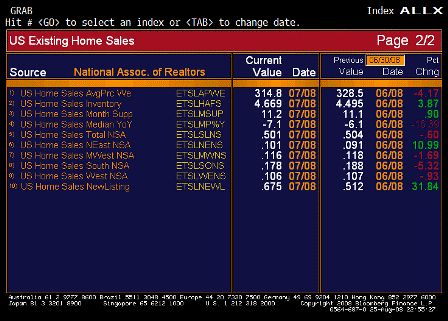
Existing Home Sales Inventory (Jul)

Survey n/a
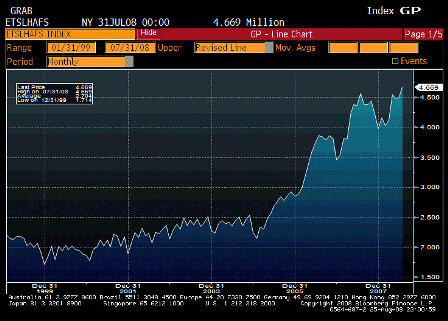
Actual 4.669M
Prior 4.495M
Revised n/a

[top][end]

Existing Home Sales ALLX 1 (Jul)

[top][end]

Existing Home Sales ALLX 2 (Jul)


[top]