2009-04-15 USER


[Skip to the end]


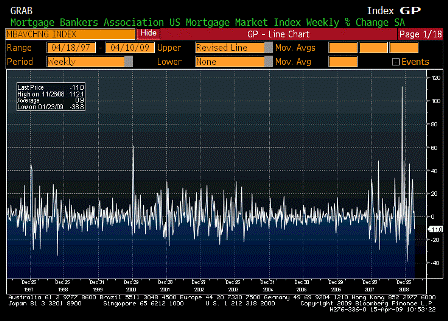
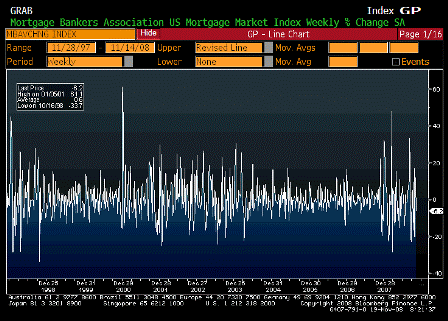
MBA Mortgage Applications (Apr 10)

Survey n/a
Actual -11.0%
Prior 4.7%
Revised n/a

[top][end]

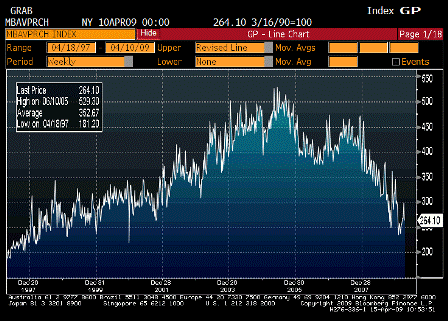
MBA Purchasing Applications (Apr 10)

Survey n/a
Actual 264.10
Prior 297.70
Revised n/a

[top][end]

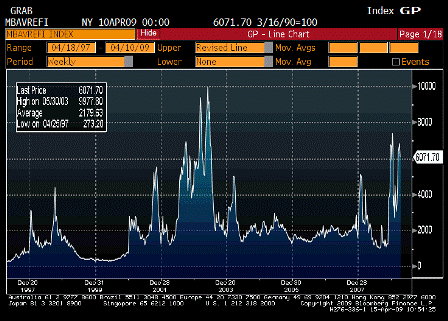
MBA Refinancing Applications (Apr 10)

Survey n/a
Actual 6071.70
Prior 6813.50
Revised n/a

[top][end]


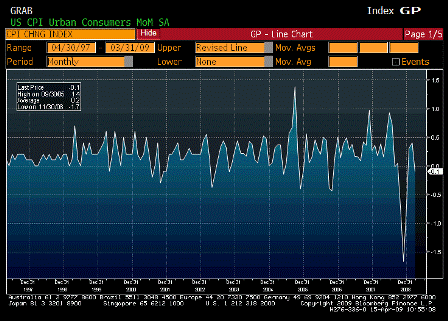
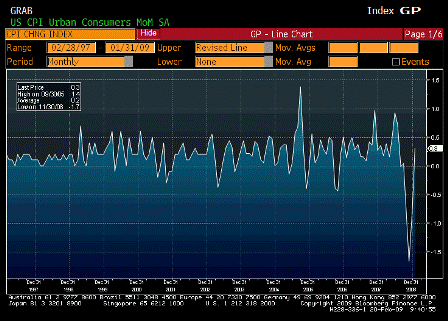
Consumer Price Index MoM (Mar )

Survey 0.1%
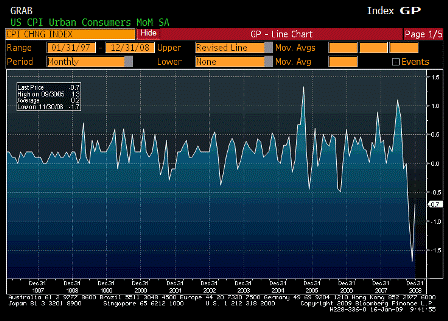
Actual -0.1%
Prior 0.4%
Revised n/a

[top][end]

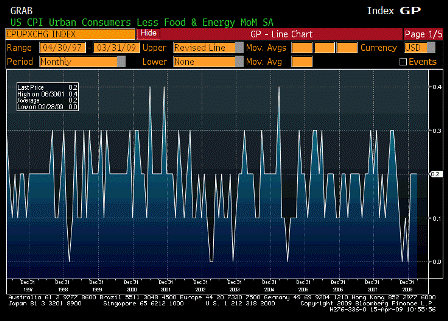
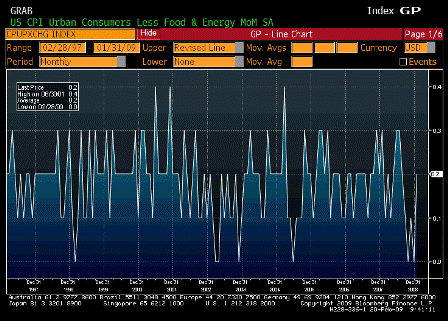
CPI Ex Food and Energy MoM (Mar)

Survey 0.1%
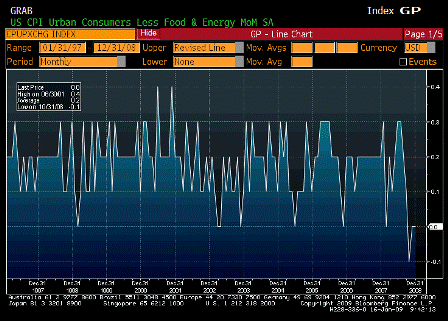
Actual 0.2%
Prior 0.2%
Revised n/a

[top][end]

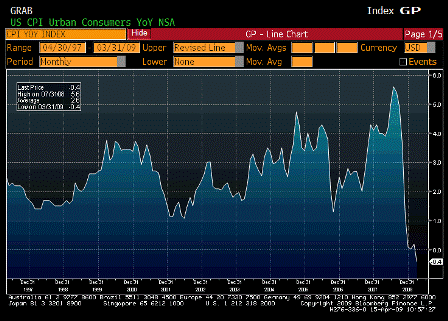
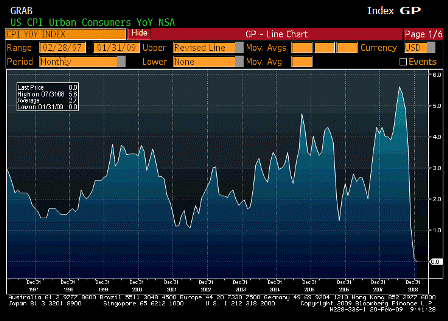
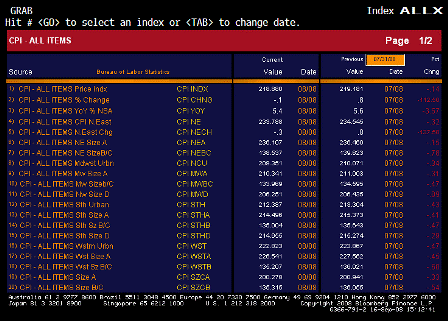
Consumer Price Index YoY (Mar)

Survey -0.1%
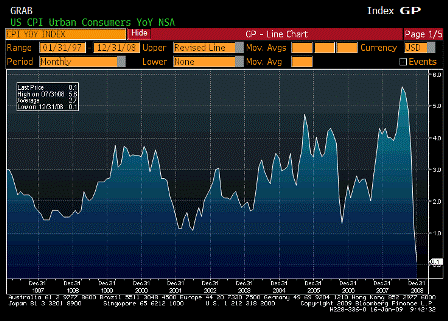
Actual -0.4%
Prior 0.2%
Revised n/a

[top][end]

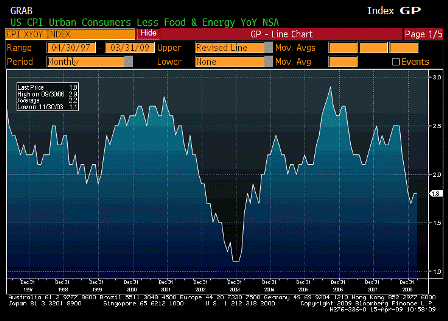
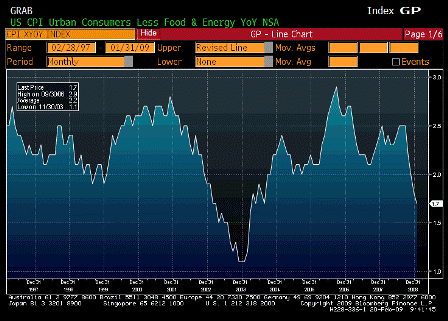
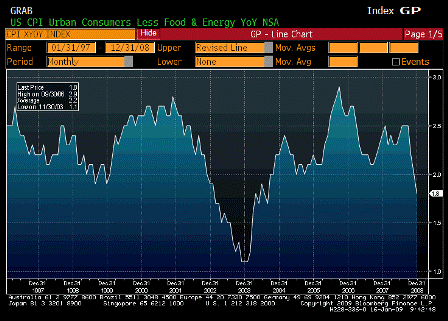
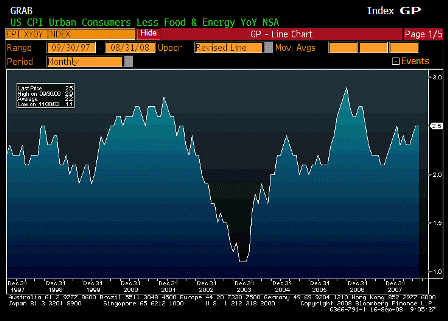
CPI Ex Food and Energy YoY (Mar)

Survey 1.7%
Actual 1.8%
Prior 1.8%
Revised n/a

[top][end]

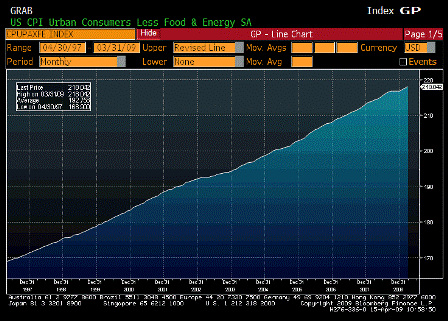
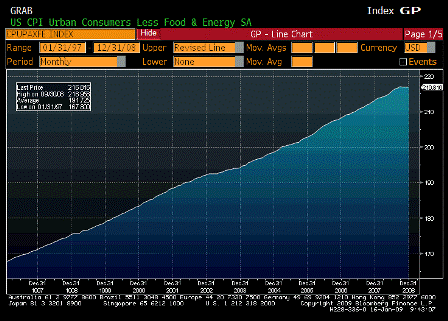
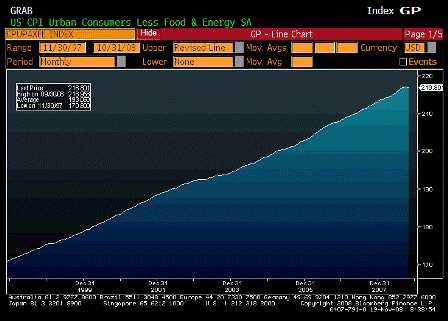
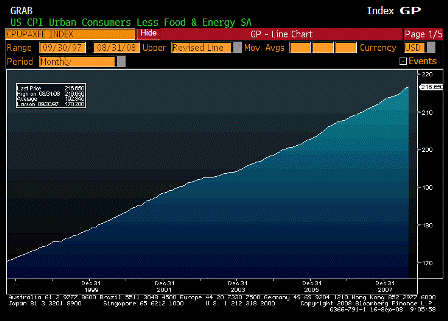
CPI Core Index SA (Mar)

Survey n/a
Actual 218.042
Prior 217.670
Revised n/a

[top][end]

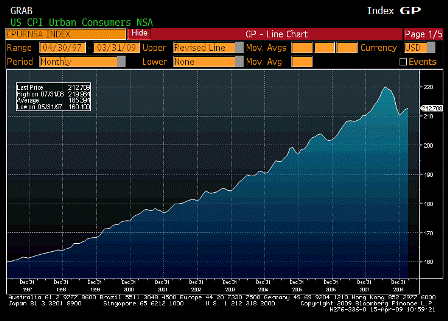
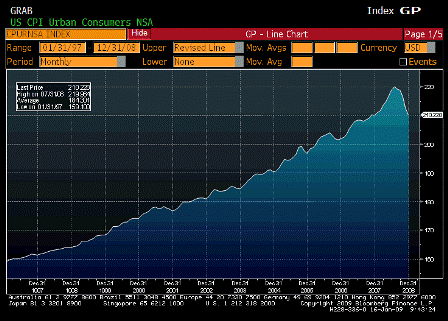
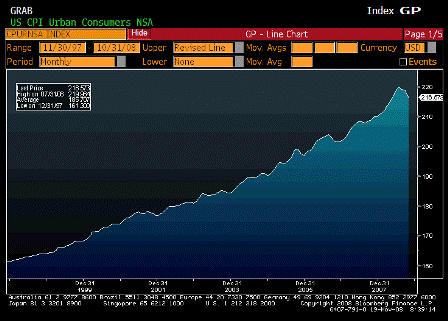
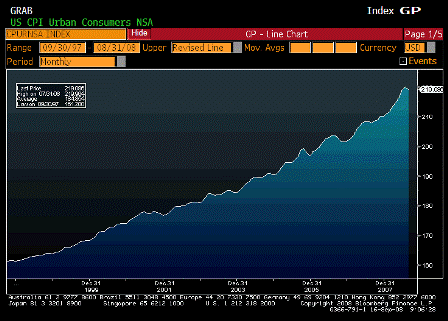
Consumer Price Index NSA (Mar)

Survey 212.900
Actual 212.709
Prior 212.193
Revised n/a

[top][end]


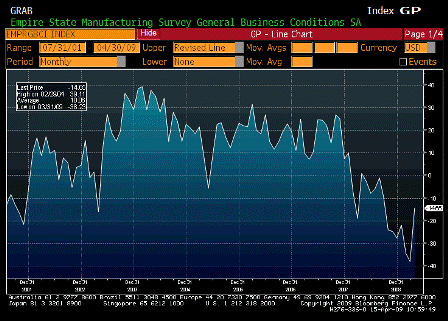
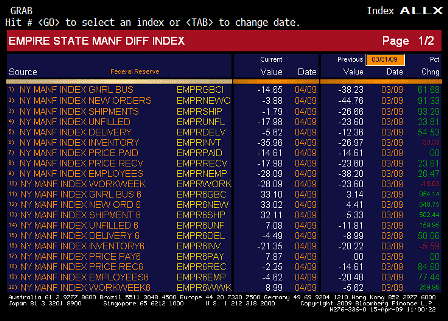
Empire State Manufacturing Survey (Apr)

Survey -35.00
Actual -14.65
Prior -38.23
Revised n/a

[top][end]

Empire State Manufacturing Survey ALLX 1 (Apr)
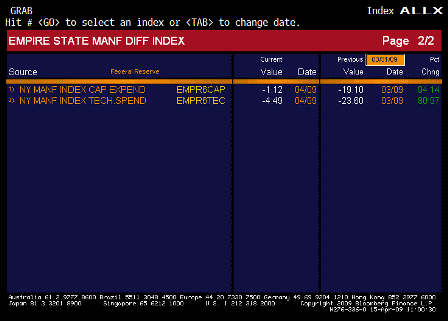
[top][end]

Empire State Manufacturing Survey ALLX 2 (Apr)
[top][end]


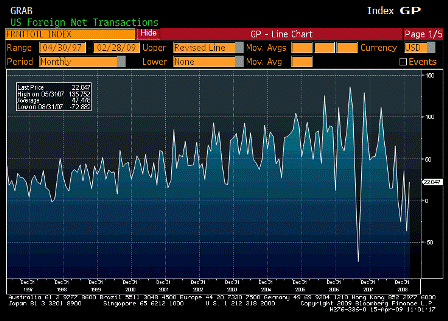
Net Long Term TIC Flows (Feb)

Survey $14.0B
Actual $22.0B
Prior -$43.0B
Revised -$36.8B

[top][end]

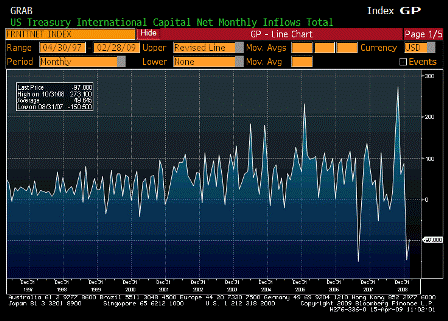
Total Net TIC Flows (Feb)

Survey n/a
Actual -$97.0B
Prior -$148.9B
Revised -$146.8B

[top][end]


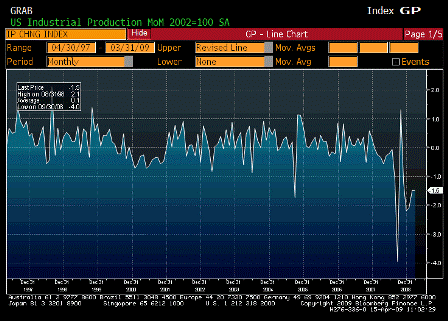
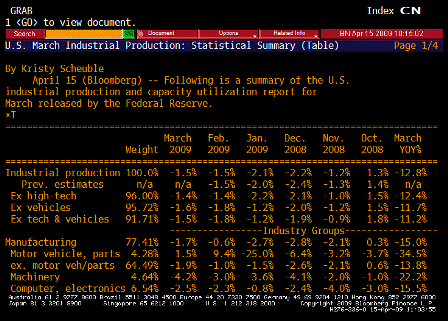
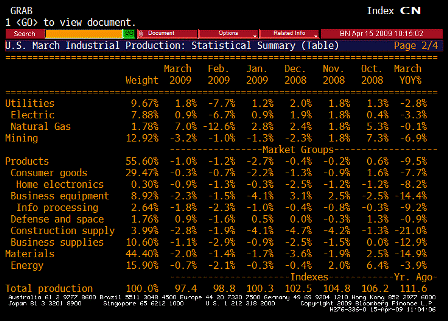
Industrial Production MoM (Mar)

Survey -0.9%
Actual -1.5%
Prior -1.4%
Revised -1.5%

[top][end]

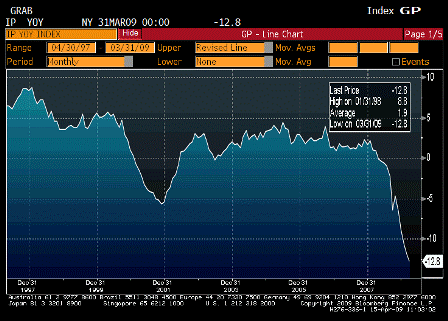
Industrial Production YoY (Mar)

Survey n/a
Actual -12.8%
Prior -11.8%
Revised n/a

[top][end]


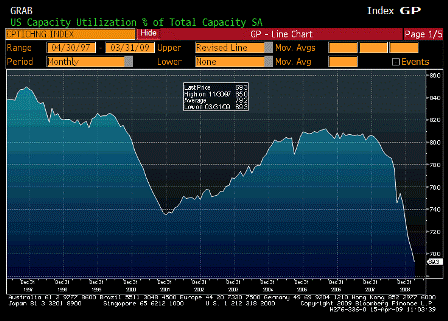
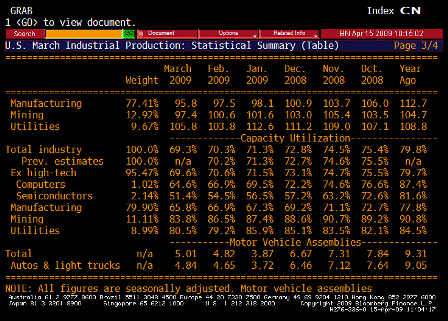
Capacity Utilization (Mar)

Survey 69.6%
Actual 69.3%
Prior 70.9%
Revised 70.3%

[top][end]

Capacity Utilization TABLE 1 (Mar)

[top][end]

Capacity Utilization TABLE 2 (Mar)

[top][end]

Capacity Utilization TABLE 3 (Mar)

[top][end]


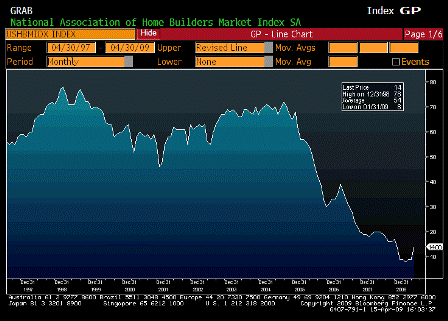
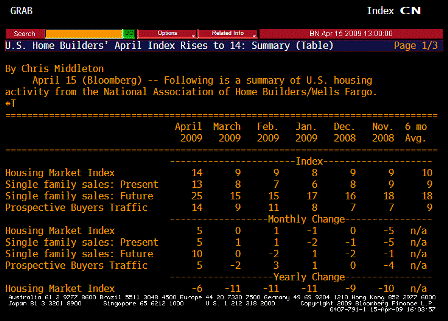
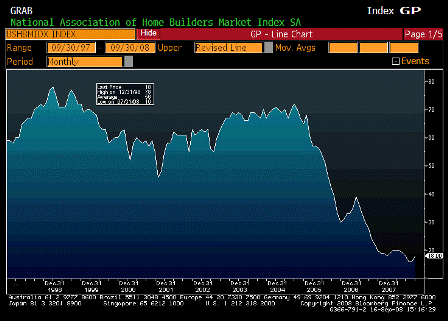
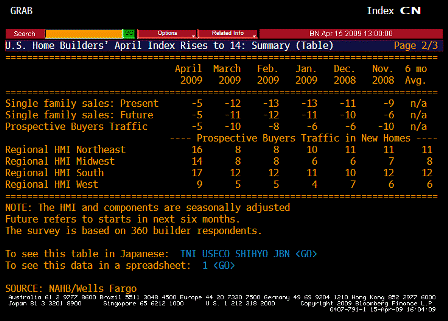
NAHB Housing Market Index (Apr)

Survey 10
Actual 14
Prior 9
Revised n/a

[top][end]

NAHB Housing Market Index TABLE 1 (Mar)
[top][end]

NAHB Housing Market Index TABLE 2 (Mar)


[top]

2009-02-20 USER


[Skip to the end]


Consumer Price Index MoM (Jan)

Survey 0.3%
Actual 0.3%
Prior -0.7%
Revised -0.8%

 
Karim writes:

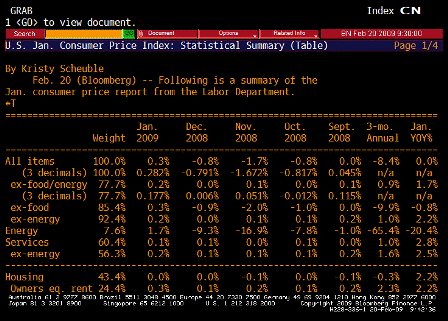
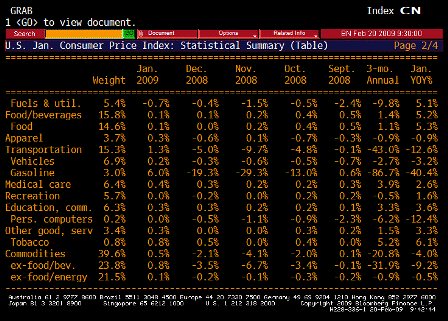
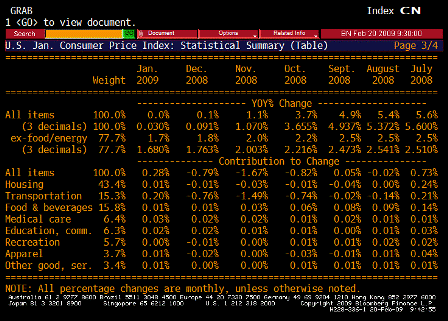
CPI boosted by OER and tobacco.

  • m/m .282% headline and .177% core; y/y 0.0% headline and 1.7% core
  • Mthly data boosted by OER (up 0.3%)-likely reflects decline in fuel/utility prices in recent months (which boosts ‘owners equivalent rent’)
  • Mirroring PPI yesterday, tobacco prices up 0.8%
  • Core PCE, which has less weight in housing, has been negative for 3mths in a row. On y/y basis, core inflation likely headed to 1% by mid-year (headline inflation may decline by -1% y/y by mid-year before converging to core in H2).

[top][end]

CPI Ex Food and Energy MoM (Jan)

Survey 0.1%
Actual 0.2%
Prior 0.0%
Revised n/a

[top][end]

Consumer Price Index YoY (Jan)

Survey -0.1%
Actual 0.0%
Prior 0.1%
Revised n/a

[top][end]

CPI Ex Food and Energy YoY (Jan)

Survey 1.5%
Actual 1.7%
Prior 1.8%
Revised n/a

[top][end]

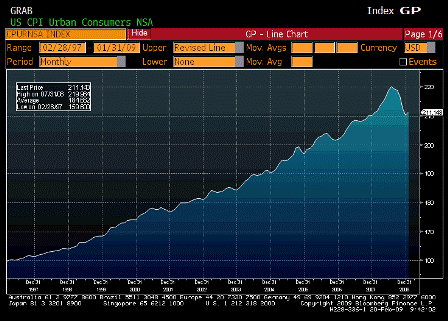
Consumer Price Index NSA (Jan)

Survey 211.081
Actual 211.143
Prior 210.228
Revised n/a

[top][end]

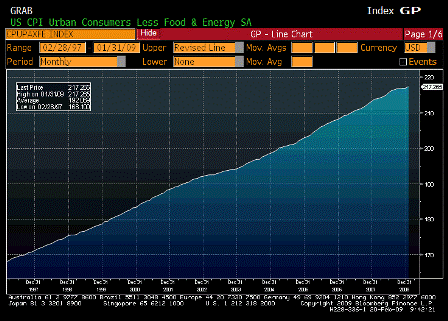
CPI Core Index SA (Jan)

Survey n/a
Actual 217.265
Prior 216.816
Revised 216.882

[top][end]

Consumer Price Index TABLE 1 (Jan)

[top][end]

Consumer Price Index TABLE 2 (Jan)

[top][end]

Consumer Price Index TABLE 3 (Jan)


[top]
2009-01-16 USER


[Skip to the end]


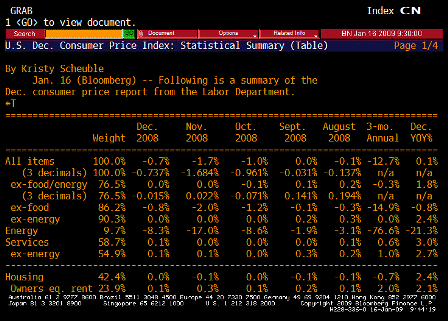
Consumer Price Index MoM (Dec)

Survey -0.9%
Actual -0.7%
Prior -1.7%
Revised n/a

[top][end]

CPI Ex Food and Energy MoM (Dec)

Survey 0.1%
Actual 0.0%
Prior 0.0%
Revised n/a

[top][end]

Consumer Price Index YoY (Dec)

Survey -0.2%
Actual 0.1%
Prior 1.1%
Revised n/a

[top][end]

CPI Ex Food and Energy YoY (Dec)

Survey 1.8%
Actual 1.8%
Prior 2.0%
Revised n/a

[top][end]

CPI Core Index SA (Dec)

Survey n/a
Actual 216.816
Prior 216.849
Revised n/a

[top][end]

Consumer Price Index NSA (Dec)

Survey 210.210
Actual 210.228
Prior 212.425
Revised n/a

[top][end]

Consumer Price Index TABLE 1 (Dec)

[top][end]

Consumer Price Index TABLE 2 (Dec)

[top][end]

Consumer Price Index TABLE 3 (Dec)

[top][end]


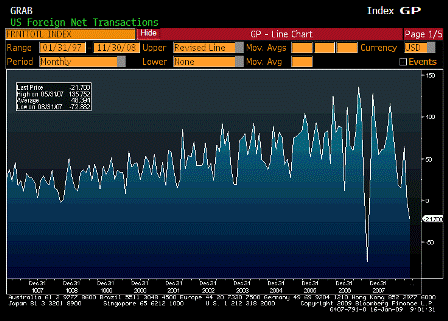
Net Long Term TIC Flows (Nov)

Survey $15.0B
Actual -$21.7B
Prior $1.5B
Revised -$0.4B

[top][end]

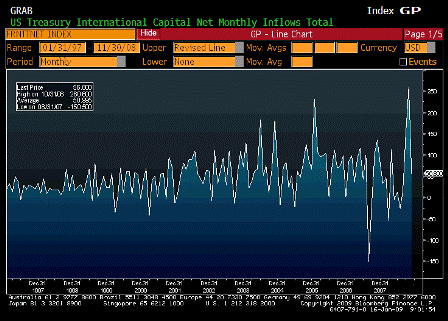
Total Net TIC Flows (Nov)

Survey n/a
Actual $56.8B
Prior $286.3B
Revised $260.6B

[top][end]


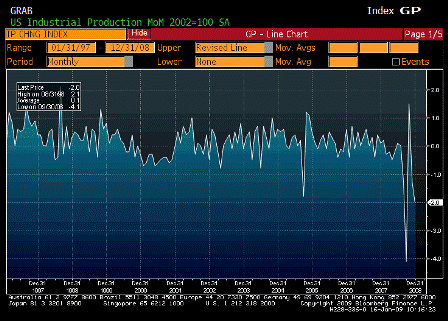
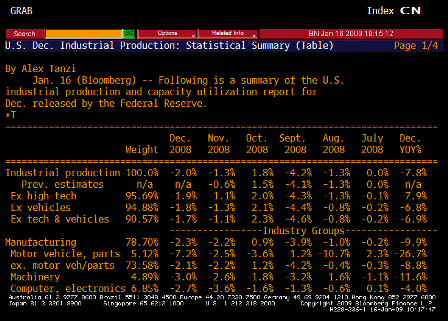
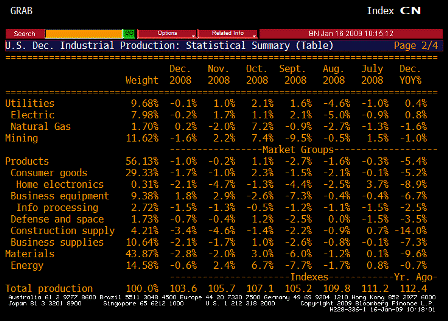
Industrial Production MoM (Dec)

Survey -1.0%
Actual -2.0%
Prior -0.6%
Revised -1.3%

[top][end]

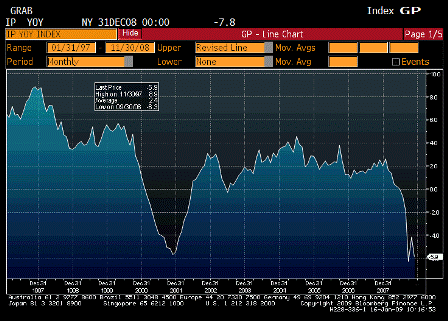
Industrial Production YoY (Dec)

Survey n/a
Actual -5.5%
Prior -4.5%
Revised n/a

[top][end]

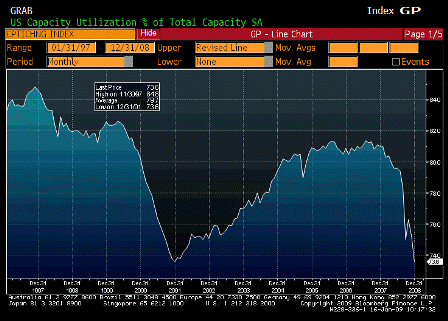
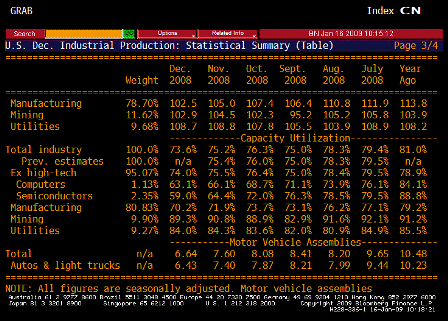
Capacity Utilization (Dec)

Survey 74.5%
Actual 73.6%
Prior 75.4%
Revised 75.2%

[top][end]

Capacity Utilization TABLE 1 (Dec)

[top][end]

Capacity Utilization TABLE 2 (Dec)

[top][end]

Capacity Utilization TABLE 3 (Dec)

[top][end]


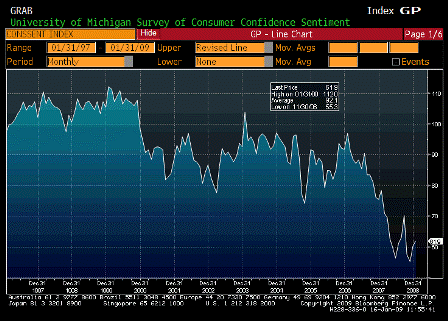
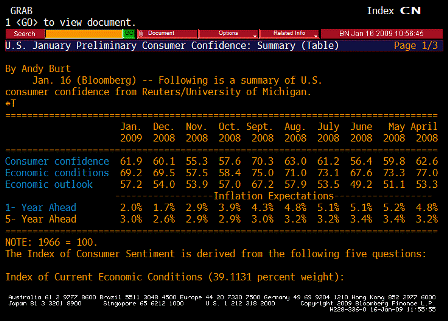
U of Michigan Confidence (Jan P)

Survey 59.0
Actual 61.9
Prior 60.1
Revised n/a

[top][end]

U of Michigan TABLE Inflation Expectations (Jan P )


[top]
2008-11-19 USER


[Skip to the end]


MBA Mortgage Applications (Nov 14)

Survey n/a
Actual -6.2%
Prior 11.9%
Revised n/a

[top][end]

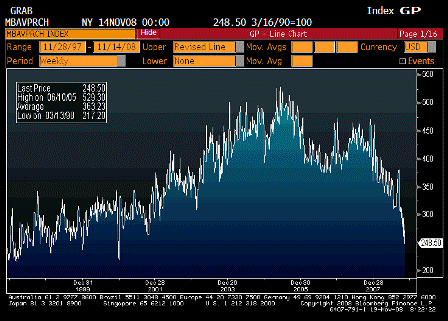
MBA Purchasing Applications (Nov 14)

Survey n/a
Actual 248.50
Prior 284.40
Revised n/a

 
Back down big time.

[top][end]

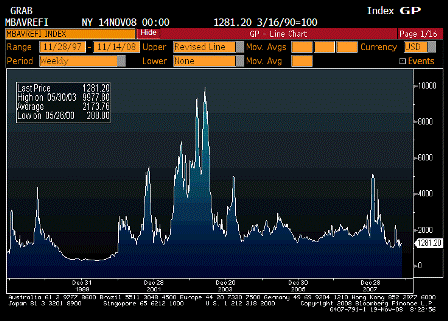
MBA Refinancing Applications (Nov 14)

Survey n/a
Actual 1281.20
Prior 1248.40
Revised n/a

[top][end]


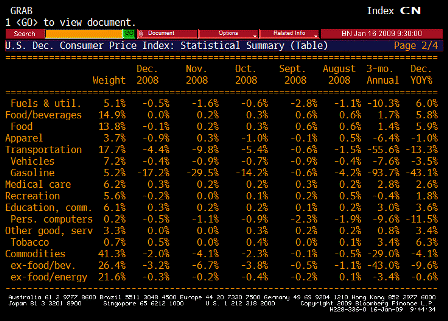
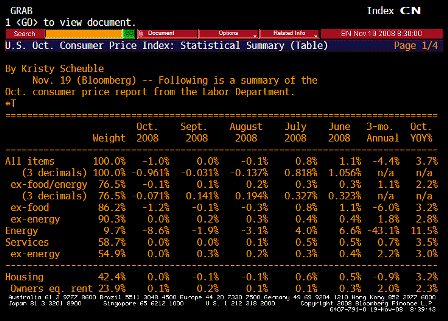
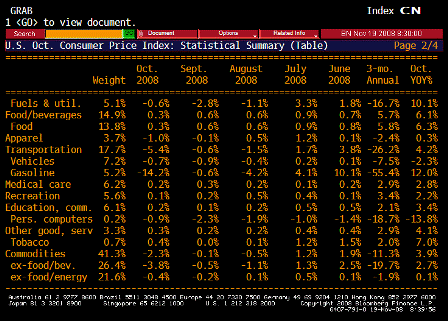
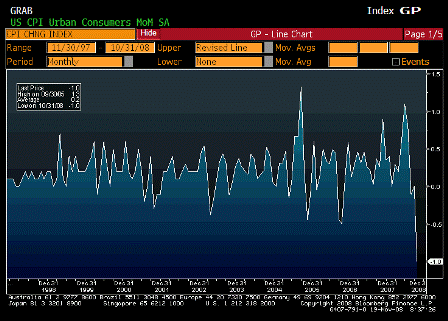
Consumer Price Index MoM (Oct)

Survey -0.8%
Actual -1.0%
Prior 0.0%
Revised n/a

 
Not much of a surprise led by gasoline prices. More to come.

[top][end]

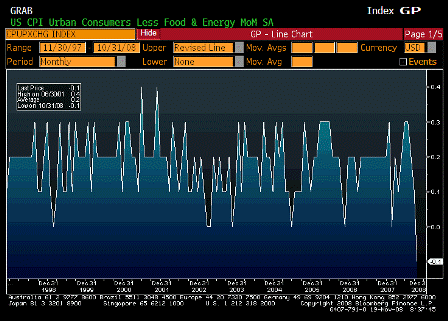
CPI Ex Food and Energy MoM (Oct)

Survey 0.1%
Actual -0.1%
Prior 0.1%
Revised n/a

 
Lower than expected. Owner equivalent remains positive at up 0.1%.

[top][end]

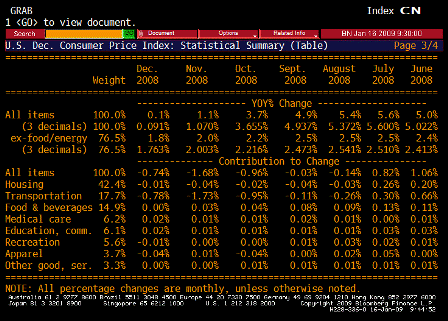
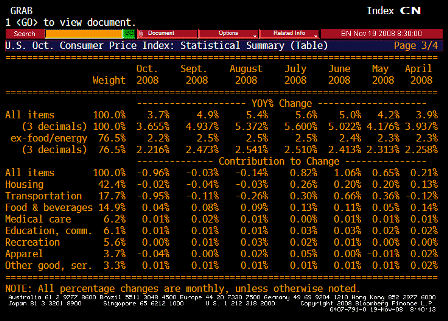
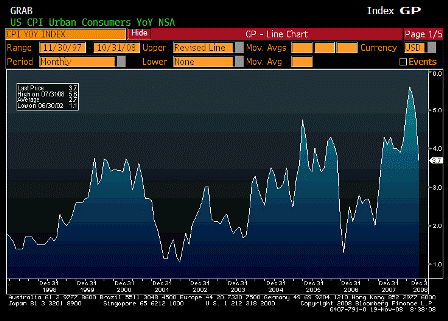
Consumer Price Index YoY (Oct)

Survey 4.0%
Actual 3.7%
Prior 4.9%
Revised n/a

 
Coming down quickly with the fall in gasoline prices, much like Aug 06 when Goldman changed their commodity index and triggered a liquidation of gasoline inventories.

Karim writes:

  • Largest single mthly fall on record in headline CPI: -0.961%
  • Core also falls, by 0.071%
  • Service inflation now unchanged for 2 straight months
  • OER up 0.1%
  • Apparel -1%, vehicles -0.7% (new -0.5%, used -2.4%)
  • Medical care and education each up 0.2%
  • Market strains + output gap + weaker commodities to lead to falling/slowing inflation in period ahead

[top][end]

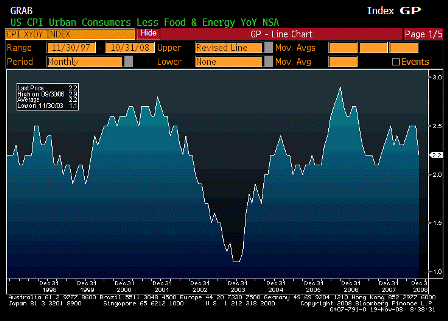
CPI Ex Food and Energy YoY (Oct)

Survey 2.4%
Actual 2.2%
Prior 2.5%
Revised n/a

 
Also moving down.

[top][end]

CPI Core Index SA (Oct)

Survey n/a
Actual 216.801
Prior 216.956
Revised n/a

[top][end]

Consumer Price Index NSA (Oct)

Survey 216.700
Actual 216.573
Prior 218.783
Revised n/a

[top][end]

Consumer Price Index TABLE 1 (Oct)

[top][end]

Consumer Price Index TABLE 2 (Oct)

[top][end]

Consumer Price Index TABLE 3 (Oct)

[top][end]


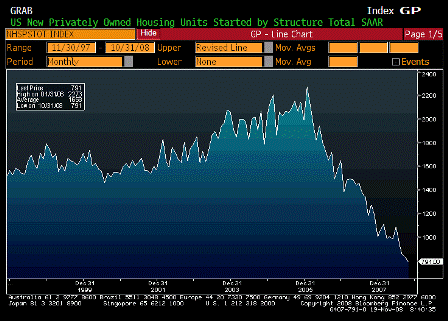
Housing Starts (Oct)

Survey 780K
Actual 791K
Prior 817K
Revised 828K

 
Looking grim again after showing signs of bottoming.

Karim writes:

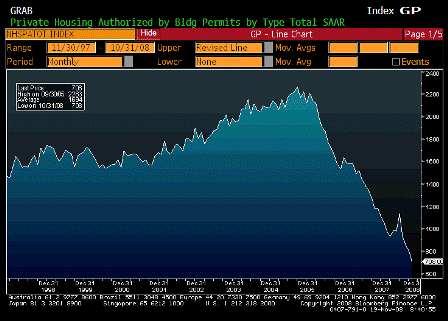
  • October housing starts down another 4.5% and permits down 12%-contribution from housing to GDP will remain a significant drag at least thru Q2 2009 (based on lag from permits to construction).

[top][end]

Building Permits (Oct)

Survey 774K
Actual 708K
Prior 786K
Revised 805K


[top]
2008-09-16 USER


[Skip to the end]


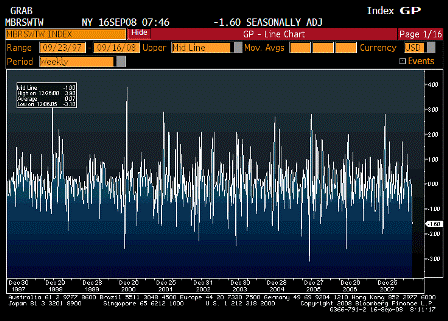
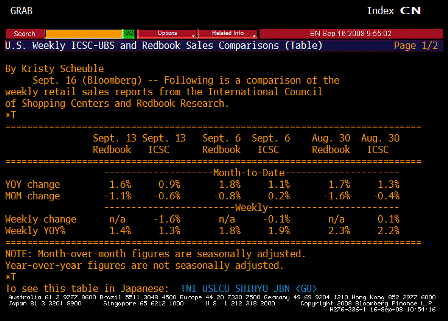
ICSC-UBS Store Sales WoW (Sep 16)

Survey n/a
Actual -1.6
Prior -0.1
Revised n/a

 
Not a good sign, but partially seasonal (see year over year below). Shoppers getting scared by the financial sector again?

[top][end]

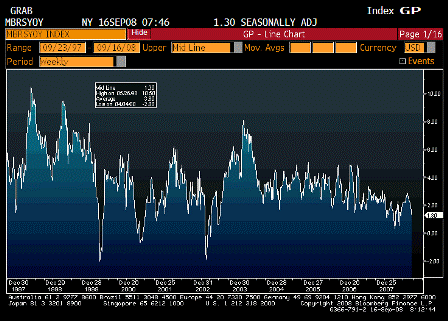
ICSC-UBS Store Sales YoY (Sep 16)

Survey n/a
Actual 1.30
Prior 1.90
Revised n/a

 
Down a bit, but still positive.

[top][end]


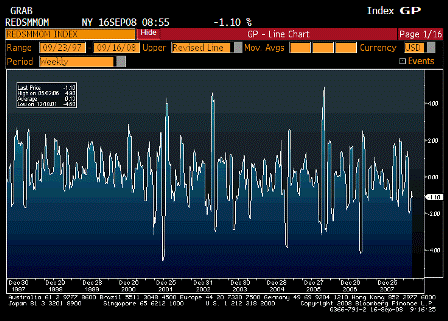
Redbook MoM (Sep 16)

Survey n/a
Actual -1.10
Prior -0.8
Revised n/a

 
Same, down some but somewhat seasonal (see year over year).

[top][end]

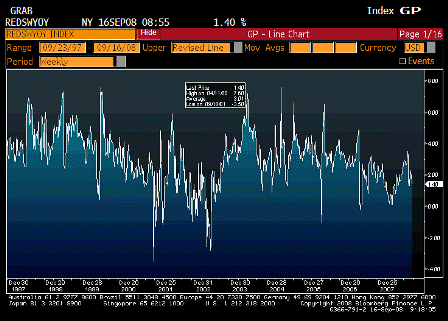
Redbook Weekly YoY (Sep 16)

Survey n/a
Actual 1.40
Prior 1.80
Revised n/a

 
Down some but still positive and off the bottom.

[top][end]

ICSC-Redbook Comparison TABLE (Sep 16)

[top][end]


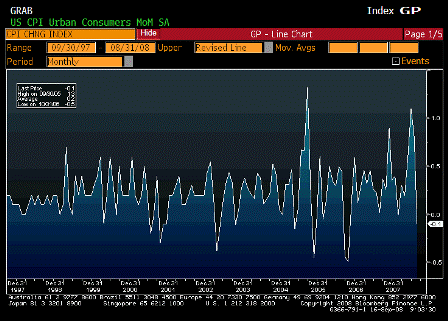
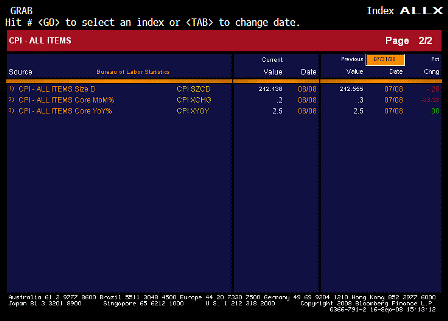
Consumer Price Index MoM (Aug)

Survey -0.1%
Actual -0.1%
Prior 0.8%
Revised n/a

 
Down only a tenth even with the big drop in commodities.

[top][end]

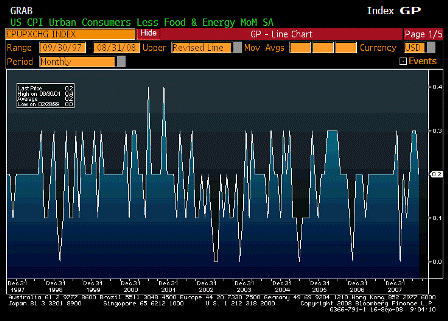
CPI Ex Food and Energy MoM (Aug)

Survey 0.2%
Actual 0.2%
Prior 0.3%
Revised n/a

 
No let up here but this lags headline.

[top][end]

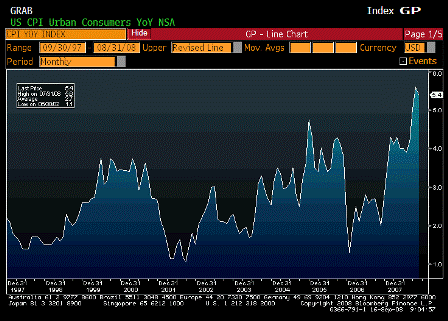
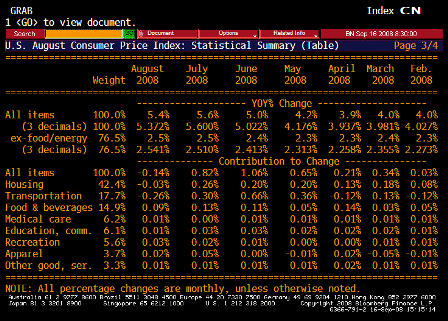
Consumer Price Index YoY (Aug)

Survey 5.5%
Actual 5.4%
Prior 5.6%
Revised n/a

 
Not much of a drop here as crude fell last august as well.

[top][end]

CPI Ex Food and Energy YoY (Aug)

Survey 2.6%
Actual 2.5%
Prior 2.5%
Revised n/a

 
Way above the Fed’s target and comfort zone

[top][end]

CPI Core Index SA (Aug)

Survey n/a
Actual 216.650
Prior 216.230
Revised n/a

[top][end]

Consumer Price Index NSA (Aug)

Survey 219.300
Actual 219.086
Prior 219.964
Revised n/a

[top][end]

Consumer Price Index ALLX 1 (Aug)

[top][end]

Consumer Price Index ALLX 2 (Aug)

[top][end]

Consumer Price Index TABLE (Aug)

[top][end]

Consumer Price Index TABLE 2 (Aug)

[top][end]

Consumer Price Index TABLE 3 (Aug)

[top][end]


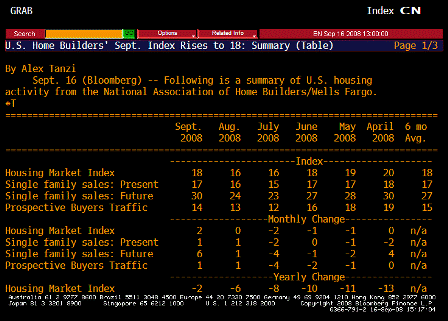
NAHB Housing Market Index (Sep )

Survey 17
Actual 18
Prior 16
Revised n/a

 
A touch better than expected, perking up a bit, but still very low historically and could spring back quickly with the agencies back in action.

[top][end]

NAHB Housing Market Index TABLE (Sep)

[top][end]

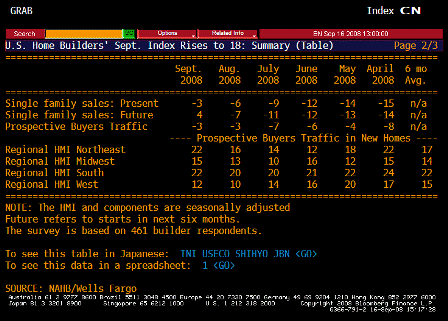
NAHB Housing Market Index TABLE 2 (Sep)

 
Future sales looking pretty good.

[top][end]


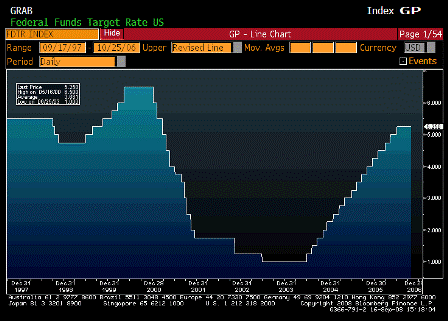
FOMC Rate Decision (Sep 16)

Survey 2.00%
Actual 2.00%
Prior 2.00%
Revised n/a

 
Wonder if Fisher cut a deal not to dissent for the Hawkish inflation language

Karim writes:

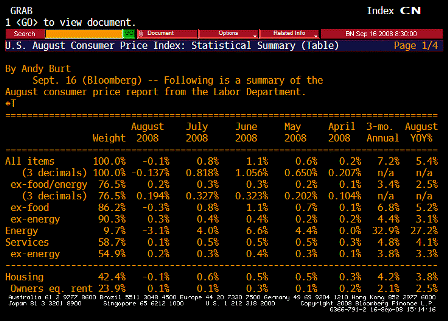
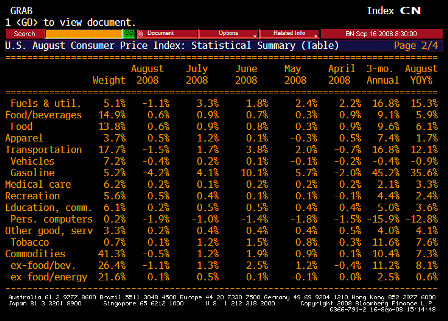
Headline CPI -0.137% m/m and core CPI up .194% m/m

  • Trending items stayed on trend (OER +0.1% and medical +0.2%)

  • Volatile items a bit of a wash

  • Recreation (+0.5) and apparel (+1.0%) higher than normal

  • Lodging away from home (-1%) lower than normal

Fed view likely reinforced that decline in commodity prices plus growing economic slack, especially in labor market, will dampen inflation into 2009.

  • Decision (no cut) may be hawkish relative to expectations, but wording mostly dovish.

  • 1st paragraph- All changes highlight downside risks to growth; slowing export growth a new wrinkle in addition to the usual financial market strains, labor market weakness and housing.

  • 2nd paragraph-Identical to prior except mention of inflation expectations has been dropped; so a downgrading of concern over inflation.

  • 3rd paragraph-‘Stand ready to act’ but no mention of ‘in a timely manner’.

  • Fisher dropped his dissent.


[top]
2008-08-14 US Economic Releases


[Skip to the end]


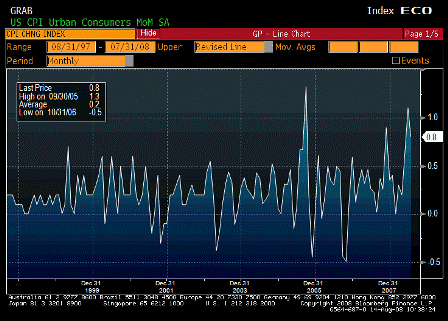
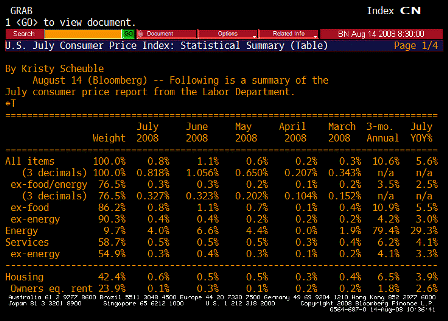
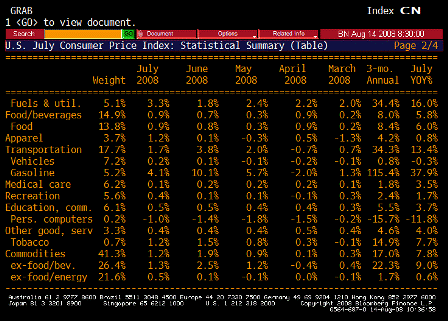
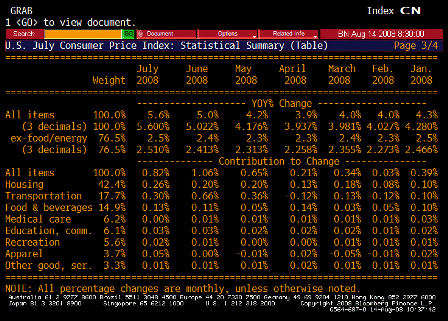
Consumer Price Index MoM (Jul)

Survey 0.4%
Actual 0.8%
Prior 1.1%
Revised n/a

Out of control, but if the recent commodity sell off holds headline will moderate some for awhile. Lots of pass-throughs and cost push forces in place.

[top][end]

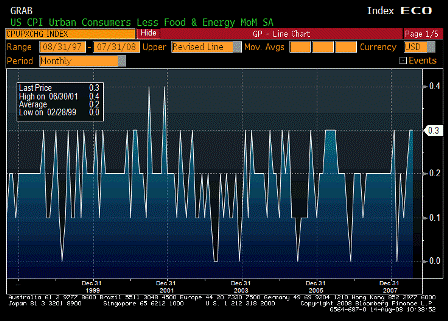
CPI Ex Food & Energy MoM (Jul)

Survey 0.2%
Actual 0.3%
Prior 0.3%
Revised n/a

[top][end]

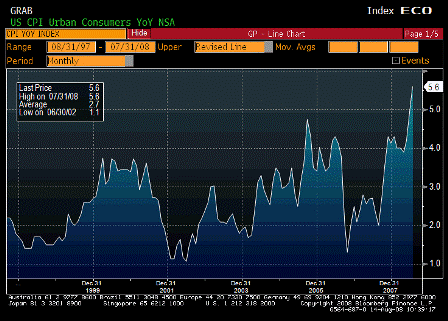
Consumer Price Index YoY (Jul)

Survey 5.1%
Actual 5.6%
Prior 5.0%
Revised n/a

The Fed has to be concerned that the 2% FF rate is way too accommodative, especially with Q2 GDP no forecast at over 3% and Q3 looking like 2%.

[top][end]

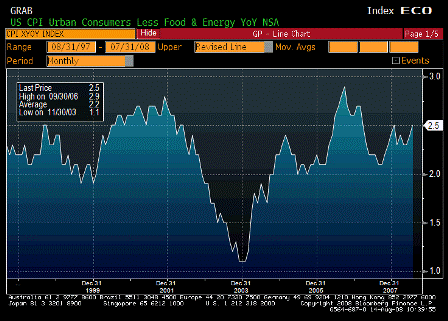
CPI Ex Food & Energy YoY (Jul)

Survey 2.4%
Actual 2.5%
Prior 2.4%
Revised n/a

Could be headed much higher as cost push pass-throughs starting to register.

[top][end]

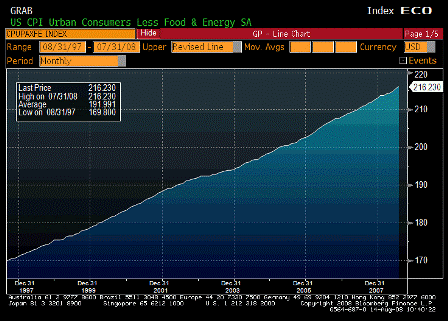
CPI Core Index SA (Jul)

Survey n/a
Actual 216.230
Prior 215.526
Revised n/a

[top][end]

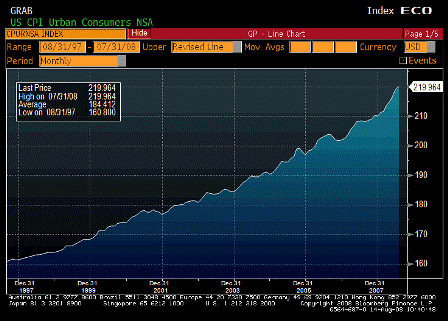
Consumer Price Index NSA (Jul)

Survey 219.075
Actual 219.964
Prior 218.815
Revised n/a

[top][end]

CPI TABLE 1 (Jul)

[top][end]

CPI TABLE 2 (Jul)

[top][end]

CPI TABLE 3 (Jul)

[top][end]


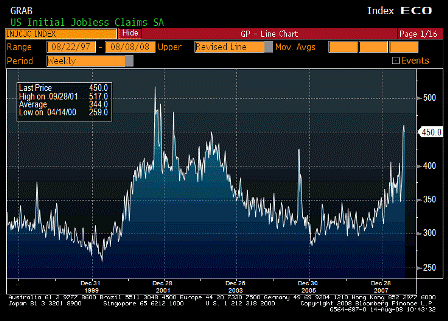
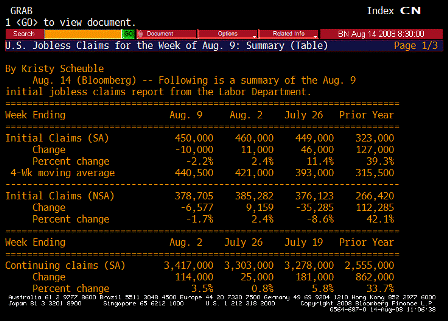
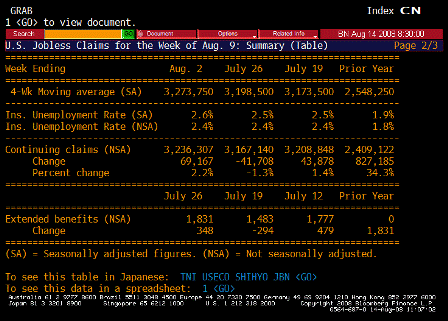
Initial Jobless Claims (Aug 9)

Survey 435K
Actual 450K
Prior 455K
Revised 460K

Up, but confused by new extended benefits.

[top][end]

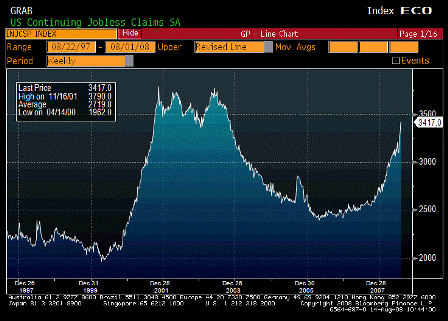
Continuing Jobless Claims (Aug 2)

Survey 3310K
Actual 3417K
Prior 3311K
Revised 3303K

Not looking good either, but how bad can it actually be with GDP north of 3%?

[top][end]

Jobless Claims TABLE 1 (Aug 9)

[top][end]

Jobless Claims TABLE 2 (Aug 9)


[top]
2008-05-14 US Economic Releases


[Skip to the end]


2008-05-14 MBAVPRCH Index

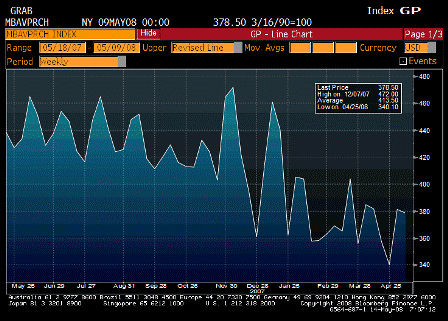
MBAVPRCH (May 9)

Survey n/a
Actual 378.5
Prior 381.3
Revised n/a

Not bad. Still supports the notion that housing bottomed in Q4.

[top][end]


2008-05-14 MBAVREFI Index

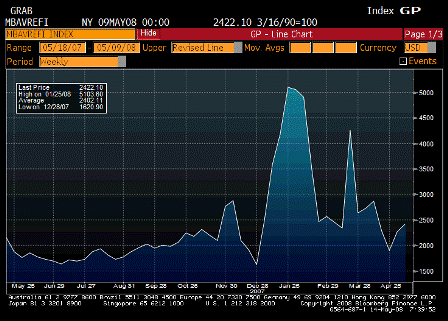
MBAVREFI Index (May 9)

Survey n/a
Actual 2422.1
Prior 2273.8
Revised n/a

Refi market alive and well.

[top][end]


2008-05-14 Bloomberg Global Confidence

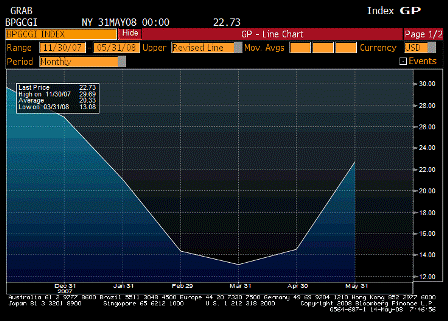
Bloomberg Global Confidence (May)

Survey n/a
Actual 22.73
Prior 14.54
Revised n/a

Speaks for itself.

[top][end]


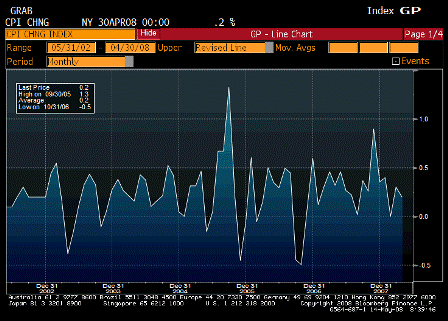
2008-05-14 Consumer Price Index MoM

Consumer Price Index MoM (Apr)

Survey 0.3%
Actual 0.2%
Prior 0.3%
Revised n/a

[top][end]


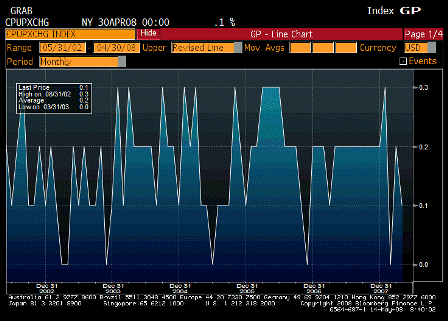
2008-05-14 CPI Ex Food & Energy MoM

CPI Ex Food & Energy MoM (Apr)

Survey 0.2%
Actual 0.1%
Prior 0.2%
Revised n/a

[top][end]


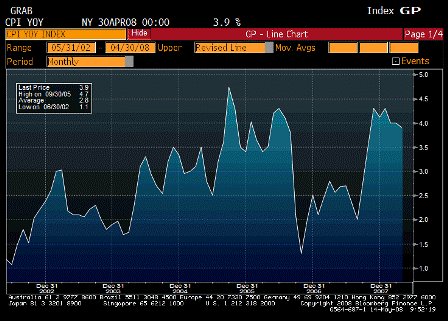
2008-05-14 Consumer Price Index YoY

Consumer Price Index YoY (Apr)

Survey 4.0%
Actual 3.9%
Prior 4.0%
Revised n/a

[top][end]


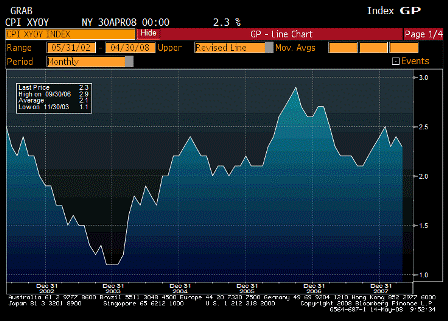
2008-05-14 CPI Ex Food & Energy YoY

CPI Ex Food & Energy YoY (Apr)

Survey 2.4%
Actual 2.3%
Prior 2.4%
Revised n/a

[top][end]


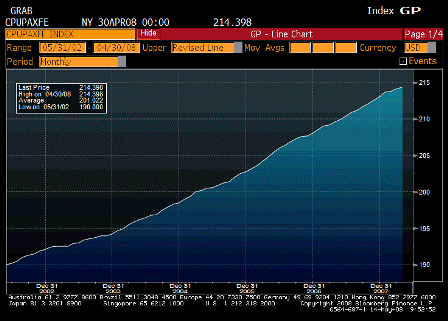
2008-05-14 CPI Core Index SA

CPI Core Index SA (Apr)

Survey n/a
Actual 214.398
Prior 214.176
Revised n/a

[top][end]


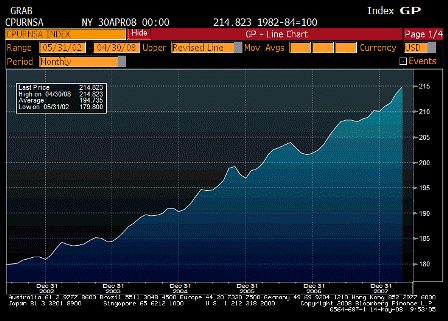
2008-05-14 Consumer Price Index NSA

Consumer Price Index NSA (Apr)

Survey 214.715
Actual 214.823
Prior 214.528
Revised n/a

It’s all being said on CNBC – seasonals that subtract this month add later in the year.


[top]
2008-04-16 US Economic Releases

  • MBA Mortgage Applications
  • Bloomberg Global Confidence
  • Consumer Price Index
  • Housing Starts
  • Building Permits
  • Industrial Production
  • Capacity Utilization

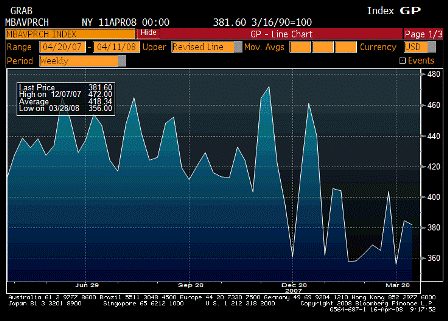
2008-04-16 MBAVPRCH Index

MBAVPRCH Index (Apr 11)

Survey n/a
Actual 381.6
Prior 384.7
Revised n/a

Holding in its new, lower range.


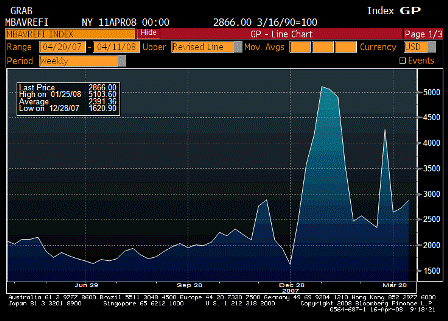
2008-04-16 MBAVREFI Index

MBAVREFI Index (Apr 11)

Survey n/a
Actual 2866.0
Prior 2724.7
Revised n/a

Doing ok in this prime time for resets, which are peaking and then falling off.


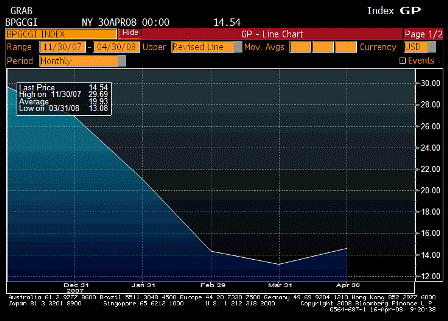
2008-04-16 Bloomberg Global Confidence

Bloomberg Global Confidence (Apr)

Survey n/a
Actual 14.54
Prior 13.08
Revised n/a

Still down, but signs of a bottom.


In my humble opinion, inflation is ripping, and the Fed’s in a very bad place. April’s food and energy price hikes, along with hosts of others, and the weaker USD all are pointing to an upward surge for prices on a forward looking basis.The Fed’s forecasting models should be showing higher inflation as well.And futures markets continue to be an unreliable forecasting tool for the Fed.

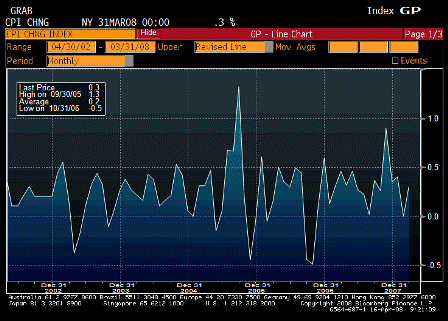
2008-04-16 Consumer Price Index MoM

Consumer Price Index MoM (Mar)

Survey 0.3%
Actual 0.3%
Prior 0.0%
Revised n/a

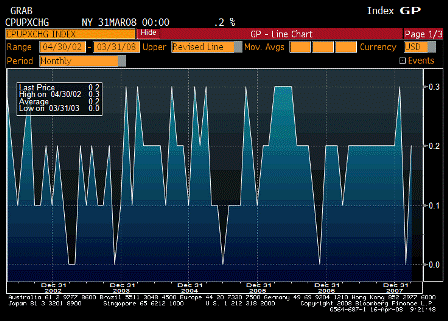
2008-04-16 CPI Ex Food & Energy MoM

CPI Ex Food & Energy MoM (Mar)

Survey 0.2%
Actual 0.2%
Prior 0.0%
Revised n/a

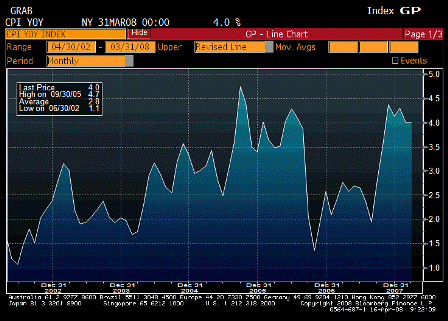
2008-04-16 Consumer Price Index YoY

Consumer Price Index YoY (Mar)

Survey 4.0%
Actual 4.0%
Prior 4.0%
Revised n/a

2008-04-16 CPI Ex Food & Energy YoY

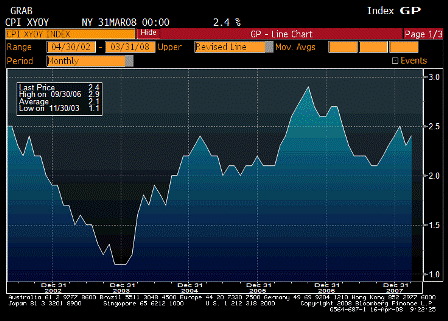
CPI Ex Food & Energy YoY (Mar)

Survey 2.4%
Actual 2.4%
Prior 2.3%
Revised n/a

From Karim:

Headline/Core divergence->limited passthrough

  • Headline 0.343% and stays at 4% y/y

  • Core rises 0.152% (after 0.04% last month), showing limited pass-through from headline and even more limited pass-through from wholesale level (PPI from yday).

  • Core rises from 2.3% to 2.4%, equates to about 1.9-2.0% on core PCE basis due to measurement differences

  • Food up 0.2% and gas up 1.3%

  • OER up 0.2%, apparel down 1.3%, vehicles down 0.1%

  • Lodging away from home down 0.6% and medical up only 0.1%, a bit below trend

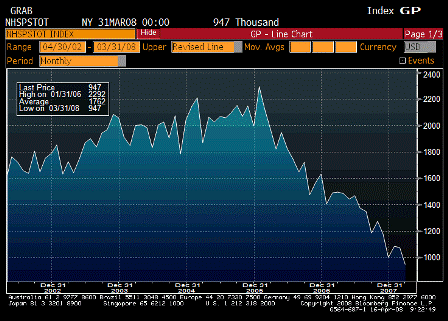
Housing starts not looking good. The glimmer of hope is that prior months have been revised up for the last two reports, so there’s a chance this number could be revised substantially as well.

2008-04-16 Housing Starts

Housing Starts (Mar)

Survey 1010K
Actual 947K
Prior 1065K
Revised 1075K

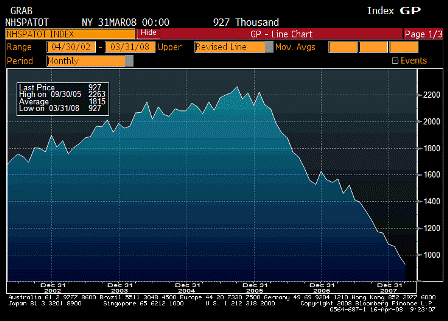
2008-04-16 Building Permits

Building Permits (Mar)

Survey 970K
Actual 927K
Prior 978K
Revised 984K

From Karim:

Housing data shows drag continuing with at least the same intensity

  • Starts down 11.9%, boding poorly for current GDP

  • Permits down 5.8%, boding poorly for future GDP

  • Best news is not adding to inventories

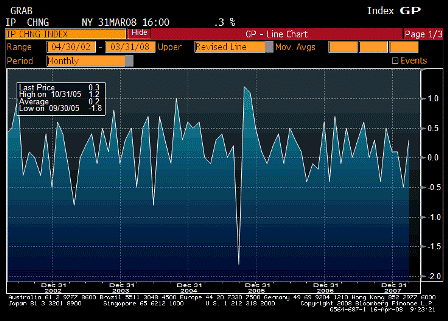
2008-04-16 Industrial Production

Industrial Production (Mar)

Survey -0.1%
Actual 0.3%
Prior -0.5%
Revised -0.7%

May be due to exports, which are keeping GDP and employment muddling through


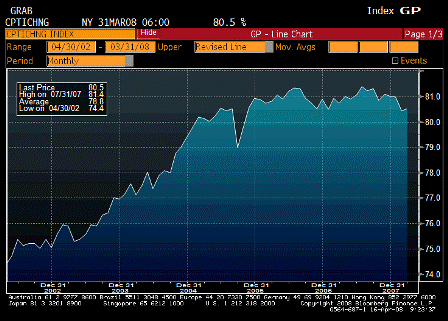
2008-04-16 Capacity Utilization

Capacity Utilization (Mar)

Survey 80.3%
Actual 80.5%
Prior 80.9%
Revised 80.3%

Staying too high for the typical recession.

2008-03-14 US Economic Releases

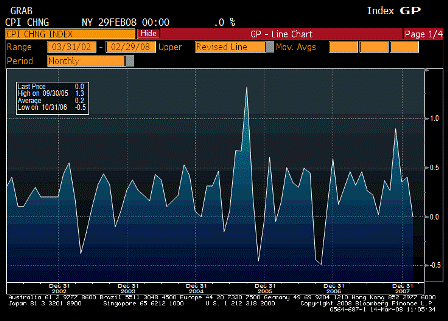
2008-03-14 Consumer Price Index MoM

Consumer Price Index MoM (Feb)

Survey 0.3%
Actual 0.0%
Prior 0.4%
Revised n/a

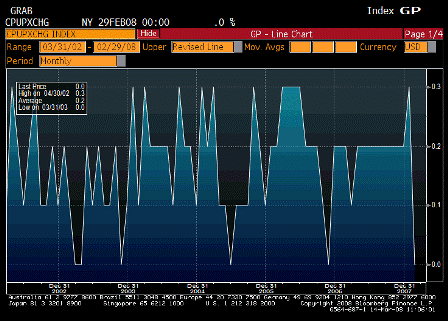
2008-03-14 CPI Ex Food & Energy MoM

CPI Ex Food & Energy MoM (Feb)

Survey 0.2%
Actual 0.0%
Prior 0.3%
Revised n/a

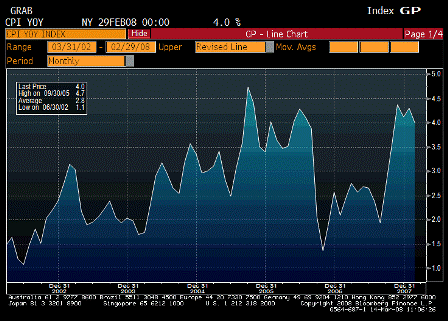
2008-03-14 Consumer Price Index YoY

Consumer Price Index YoY (Feb)

Survey 4.3%
Actual 4.0%
Prior 4.3%
Revised n/a

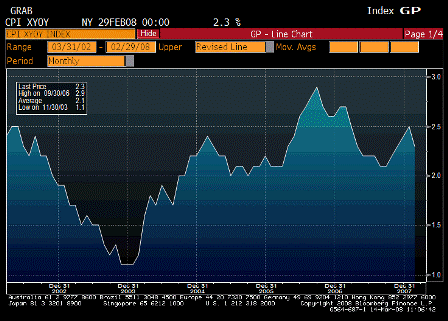
2008-03-14 CPI Ex Food & Energy YoY

CPI Ex Food & Energy YoY (Feb)

Survey 2.4%
Actual 2.3%
Prior 2.5%
Revised n/a

The calm during the storm.  March numbers are already being forecast at up 0.7% for headline CPI.

The individual components have been volatile.

Also, gasoline prices fell 2%.  Retail sales of gasoline was reported down 1% earlier this week.  Together this implies physical demand (gallons sold) went up.


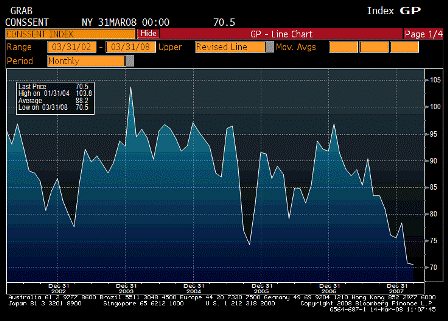
2008-03-14 U. of Michigan Confidence

U. of Michigan Confidence (Mar P)

Survey 69.5
Actual 70.5
Prior 70.8
Revised n/a

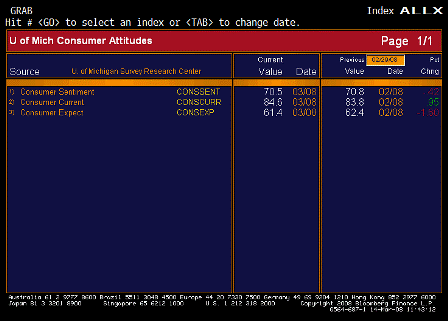
2008-03-14 U. of Michigan TABLE

Current conditions improved, expectations fell.

Inflation expectations one year forward rose from 3.6% to 4.5% which complicates the Fed’s decision on Tuesday.  The 5 year number fell from 3.0% to 2.9% which is somewhat of an offset.

2008-01-16 US Economic Releases

2008-01-16 Mortgage Applications

Average Mortgage Purchasing Index (Jan 11)

Survey n/a
Actual 461.20
Prior 414.00
Revised n/a

2008-01-16 Mortgage Applications

Mortgage Refi’s (Jan 11)

Survey n/a
Actual 3575.50
Prior 2494.20
Revised n/a

Purchase index back on uptrend, refi way up. Lower rates and return of market functioning coming together nicely.

Still looks like housing could have bottomed October/November, but jury is still out pending data and revisions.

JP Morgan mtg revenue spiked up as JPM gains market share in mtg markets.

Houses are cheaper, lenders aggressive with real buyers, and income has continued higher.

See Mortgage applications soar.


2008-01-16 Consumer Price Index MoM

Consumer Price Index MoM (Dec)

Survey 0.2%
Actual 0.3%
Prior 0.8%
Revised n/a

2008-01-16 CPI Ex Food & Energy MoM

CPI Ex Food & Energy MoM (Dec)

Survey 0.2%
Actual 0.2%
Prior 0.3%
Revised n/a

2008-01-16 Consumer Price Index YoY

Consumer Price Index YoY (Dec)

Survey 4.1%
Actual 4.1%
Prior 4.3%
Revised n/a

2008-01-16 CPI Ex Food & Energy YoY

CPI Ex Food & Energy YoY (Dec)

Survey 2.4%
Actual 2.4%
Prior 2.3%
Revised n/a

See Food/fuel/$ bakes in core.


2008-01-16 Industrial Production

Industrial Production (Dec)

Survey -0.2%
Actual 0.0%
Prior 0.3%
Revised n/a

Graph looks OK – holding its own!


2008-01-16 Capacity Utilization

Capacity Utilization (Dec)

Survey 81.2%
Actual 81.4%
Prior 81.5%
Revised 81.6%

Drifting off some, but still at a relatively high level.


2008-01-16 NAHB Housing Market Index

NAHB Housing Market Index (Jan)

Survey 19
Actual 19
Prior 19
Revised 18

Rounding bottom?


♥