[Skip to the end]
Twin themes remain – weakness and higher prices.
![2008-07-08 Financial Obligations Ratio, Debt Service Ratio, Renter's Financial Obligation Ratio, Homeowner's Financial Obligation Ratio](https://moslereconomics.com/wp-content/graphs/2008/07/2008-07-08-financial-obligations-ratio-debt-service-ratio-renters-financial-obligation-ratio-homeowners-financial-obligation-ratio-small.gif)
![click for larger graph](https://moslereconomics.com/wp-content/uploads/Zoom_In.gif)
In Q2 2006 it seemed to me that the financial obligations ratio couldn’t get much higher which meant consumer debt could not grow at a faster pace.
With the budget deficit in decline and the trade gap still widening, it would have taken increasing rates of growth of consumer debt to sustain GDP, so my forecast was for gradually declining GDP growth rates over time.
At the same time, I was calling for ever higher crude prices as I saw the Saudis as a swing producer/price setter intent on hiking prices.
This was all temporarily derailed in Aug 2006 when Goldman changed the composition of its commodities index and liquidated substantial amounts of gasoline and crude from the basket of futures purchased and held by its fund, and another fund that followed the Goldman index also re-weighted funds and liquidated substantial numbers of futures contracts. This action pushed prices down until the liquidation was over, but then at year end Goldman and also AIG at year end changed their indexes and again drove prices down. Shortly thereafter it was announced that Goldman was turning its index over to S&P to avoid related party conflicts, or something like that, and the Saudis have resumed their clandestine price hiking.
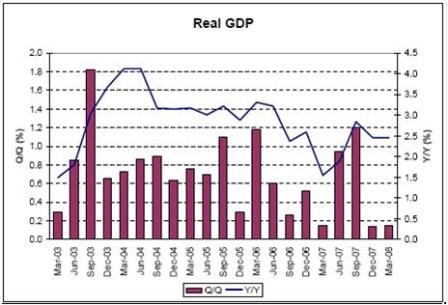
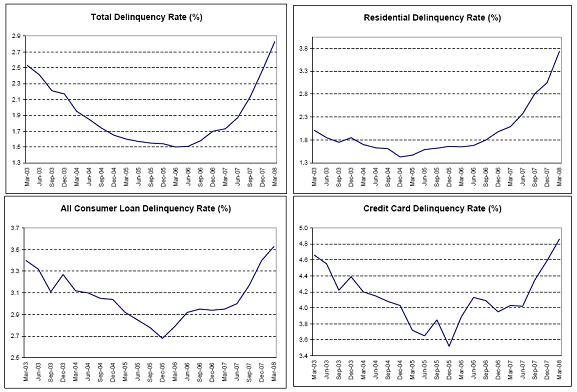
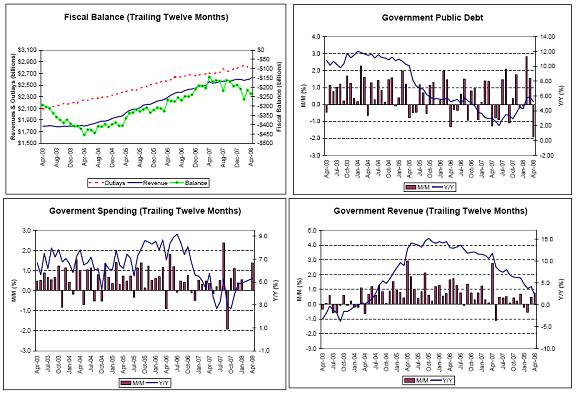
In general, the Valance charts show economic weakening since Q2 2006. The subprime blow up took away demand in the housing sector as fewer buyers qualified for mortgages when the number of undetected fraudulent applications was reduced, with exports first picking up the slack in 07, and government kicking in soon after in 08.
With the government deficit now proactively growing again, and the financial obligations ratios starting to relax, GDP should continue to muddle through.
“Muddling through†also means, however, that demand will be high enough to support the current level of crude/food/import prices and allow core prices to catch up with headline CPI as the rising food/crude/import prices are also factors of production that are driving up costs.
![2008-07-08 Real GDP, Industrial Production, Capacity Utilization, ISM Manufacturing](https://moslereconomics.com/wp-content/graphs/2008/07/2008-07-08-real-gdp-industrial-production-capacity-utilization-ism-manufacturing-small.gif)
![click for larger graph](https://moslereconomics.com/wp-content/uploads/Zoom_In.gif)
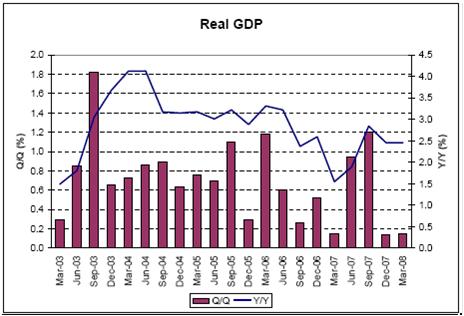
So far, GDP has muddled through as domestic demand has weakened.
![2008-07-08 Philly Fed Index Orders, Chicago PMI Orders, ISM Non-Manufacturing Orders, Empire Manufacturing Orders](https://moslereconomics.com/wp-content/graphs/2008/07/2008-07-08-philly-fed-index-orders-chicago-pmi-orders-ism-non-manufacturing-orders-empire-manufacturing-orders-small.gif)
![click for larger graph](https://moslereconomics.com/wp-content/uploads/Zoom_In.gif)
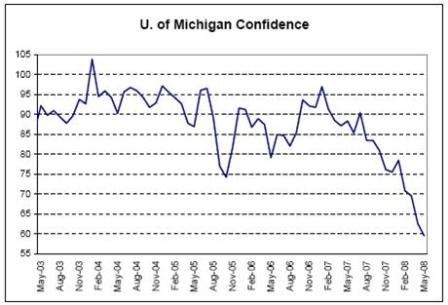
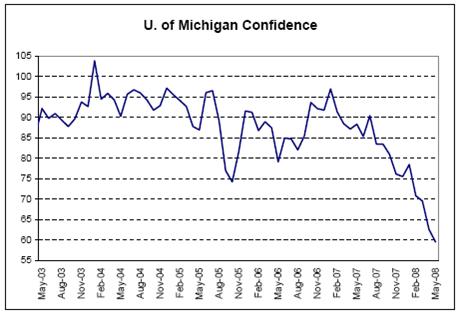
All the surveys look about like these – working their way lower over time, with some turning up recently from the lowest levels.
![2008-07-08 Fiscal Balance, Government Spending](https://moslereconomics.com/wp-content/graphs/2008/07/2008-07-08-fiscal-balance-government-spending-small.gif)
![click for larger graph](https://moslereconomics.com/wp-content/uploads/Zoom_In.gif)
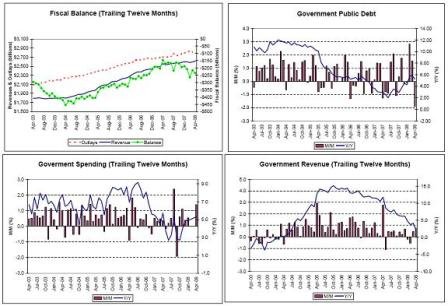
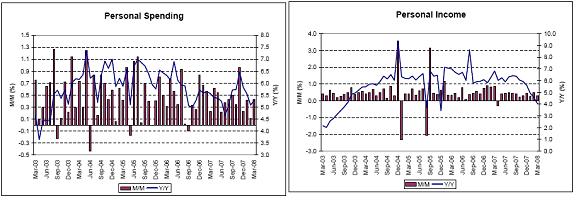
Government spending is on the rise, as a conspicuous drop in the rate of spending in 2007 is making a comeback in 2008, along with the fiscal package now kicking in.
![2008-07-08 Housing Starts, Building Permits, Housing Affordability, Pending Home Sales](https://moslereconomics.com/wp-content/graphs/2008/07/2008-07-08-housing-starts-building-permits-housing-affordability-pending-home-sales-small.gif)
![click for larger graph](https://moslereconomics.com/wp-content/uploads/Zoom_In.gif)
Housing is way down, to the point where it could recover by 50% and still be depressed.
Rising affordability and the passage of time to digest the disruption of the subprime related issues along with increased government spending and increasing exports are beginning to turn things around from the bottom that may have been reached last October/November.
![2008-07-08 NAHB Housing Index, NAHB Present Sales Index, NAHB Future Sales Index, Conference Board Home Buying Intentions](https://moslereconomics.com/wp-content/graphs/2008/07/2008-07-08-nahb-housing-index-nahb-present-sales-index-nahb-future-sales-index-conference-board-home-buying-intentions-small.gif)
![click for larger graph](https://moslereconomics.com/wp-content/uploads/Zoom_In.gif)
The outlook for the future may have bottomed at these very low levels.
![2008-07-08 New Home Sales, New Home Sales Median Prices, New Homes Months of Supply, New Homes Supply (Actual Units)](https://moslereconomics.com/wp-content/graphs/2008/07/2008-07-08-new-home-sales-new-home-sales-median-prices-new-homes-months-of-supply-new-homes-supply-actual-units-small.gif)
![click for larger graph](https://moslereconomics.com/wp-content/uploads/Zoom_In.gif)
Actual inventories of unsold new homes are steadily falling and median prices are showing signs of a bottom also pointing to a possible bottom for the housing sector.
![2008-07-08 Durable Goods Orders, Factory Orders](https://moslereconomics.com/wp-content/graphs/2008/07/2008-07-08-durable-goods-orders-factory-orders-small.gif)
![click for larger graph](https://moslereconomics.com/wp-content/uploads/Zoom_In.gif)
Government spending and exports have kept the economy from getting a lot worse.
![2008-07-08 Total Hours Worked, Labor Participation Rate, Duration of Unemployment, Household Job Growth](https://moslereconomics.com/wp-content/graphs/2008/07/2008-07-08-total-hours-worked-labor-participation-rate-duration-of-unemployment-household-job-growth-small.gif)
![click for larger graph](https://moslereconomics.com/wp-content/uploads/Zoom_In.gif)
![2008-07-08 Non-farm Payrolls, Average Hourly Earnings, Average Weekly Hours, Unemployment Rate](https://moslereconomics.com/wp-content/graphs/2008/07/2008-07-08-non-farm-payrolls-average-hourly-earnings-average-weekly-hours-unemployment-rate-small.gif)
![click for larger graph](https://moslereconomics.com/wp-content/uploads/Zoom_In.gif)
No matter how you look at it, the ‘labor markets’ are on the soft side.
Productivity increases have allowed positive GDP growth with reduced labor input.
![2008-07-08 Personal Spending, Personal Income](https://moslereconomics.com/wp-content/graphs/2008/07/2008-07-08-personal-spending-personal-income-small.gif)
![click for larger graph](https://moslereconomics.com/wp-content/uploads/Zoom_In.gif)
Government to the rescue! GDP will be sustained as long as this holds up.
![2008-07-08 Retail Sales, Total Vehicle Sales, Redbook Retail Sales Growth](https://moslereconomics.com/wp-content/graphs/2008/07/2008-07-08-retail-sales-total-vehicle-sales-redbook-retail-sales-growth-small.gif)
![click for larger graph](https://moslereconomics.com/wp-content/uploads/Zoom_In.gif)
Not terrible here either, apart from the auto industry getting caught out with too many large trucks to sell.
![2008-07-08 CPI, Core CPI, PCE Price Index, Core PCE](https://moslereconomics.com/wp-content/graphs/2008/07/2008-07-08-cpi-core-cpi-pce-price-index-core-pce-small.gif)
![click for larger graph](https://moslereconomics.com/wp-content/uploads/Zoom_In.gif)
Inflation will only get a lot worse as crude keeps rising.
NOTE: The dip from the Goldman effect in August 2006 has been largely reversed in CPI with the others following with a lag.
![2008-07-08 PPI, Core PPI, Import Prices](https://moslereconomics.com/wp-content/graphs/2008/07/2008-07-08-ppi-core-ppi-import-prices-small.gif)
![click for larger graph](https://moslereconomics.com/wp-content/uploads/Zoom_In.gif)
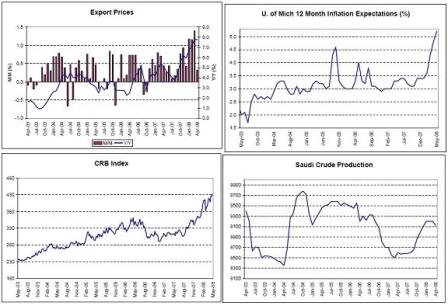
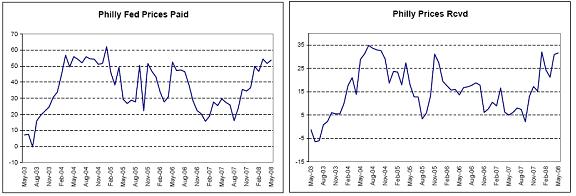
And these are the wholesale prices and import prices that have also more than recovered from the Goldman effect and are in the process of getting passed through to retail prices.
![2008-07-08 Export Prices, U. of Michigan 12 Month Inflation Expectations, CRB Index, Saudi Crude Production](https://moslereconomics.com/wp-content/graphs/2008/07/2008-07-08-export-prices-u-of-michigan-12-month-inflation-expectations-crb-index-saudi-crude-production-small.gif)
![click for larger graph](https://moslereconomics.com/wp-content/uploads/Zoom_In.gif)
Export prices are booming, expectations way too high for the Fed, the CRB back on trend after the Goldman dip, and demand for Saudi crude holding firm at current prices.
![2008-07-08 Empire Prices Paid, Empire Prices Rcvd, Philly Fed Prices Paid, Philly Prices Rcvd](https://moslereconomics.com/wp-content/graphs/2008/07/2008-07-08-empire-prices-paid-empire-prices-rcvd-philly-fed-prices-paid-philly-prices-rcvd-small.gif)
![click for larger graph](https://moslereconomics.com/wp-content/uploads/Zoom_In.gif)
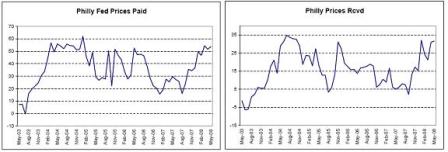
All the price surveys look about like this.
![2008-07-08 Copper, Iron & Steel Scrap Pieces](https://moslereconomics.com/wp-content/graphs/2008/07/2008-07-08-copper-iron-steel-scrap-pieces-small.gif)
![click for larger graph](https://moslereconomics.com/wp-content/uploads/Zoom_In.gif)
Demand looks strong here as well.
![2008-07-08 Unit Labor Costs, Employment Cost Index, Non-farm Productivity](https://moslereconomics.com/wp-content/graphs/2008/07/2008-07-08-unit-labor-costs-employment-cost-index-non-farm-productivity-small.gif)
![click for larger graph](https://moslereconomics.com/wp-content/uploads/Zoom_In.gif)
Meanwhile wages remain ‘well-anchored’ as real wages go negative after being about flat for a few decades. And even the most liberal members of Congress seem to think this is a ‘good thing’ as they congratulate the Fed Chairman for keeping wage pressures low.
We are in the process of discovering it IS possible to have inflation without wages leading the way, just like the rest of the banana republics with weak currencies, rising import prices, export led growth, and declining real terms of trade.
[top]