
Weak euro zone lending data underscores need for ECB stimulus
By Eva Taylor
Sept 25 (Reuters) — Lending to euro zone households and companies contracted for the 28th month in a row in August, though at a slower pace, putting a keener spotlight on European Central Bank efforts to get credit flowing again.
Euro zone banks, particularly in the crisis-stricken countries, have tightened up on lending as they adapt to tougher capital requirements and undergo health checks, while companies are holding back on investments, unsure of the future.
The euro zone economy ground to a halt in the second quarter and with inflation in what ECB President Mario Draghi has called the “danger zone” below 1 percent for almost a year now, the ECB saw the need to add new stimulus steps in June and September.
The ECB has now started to offer banks four-year loans at ultra-cheap rates and plans to buy asset-backed securities and covered bonds from October to lighten the weight on banks’ balance sheets and entice them to lend.
But economists in a Reuters poll are skeptical about whether the plan will work, saying bank lending to private euro zone businesses needed to grow at a 3-percent annual rate on a sustained basis to stir inflation.
August lending rates are nowhere near such levels.
In August, loans to the private sector continued to fall, down 1.5 percent from the same month a year earlier after a contraction of 1.6 percent in July, ECB data showed on Thursday. Private sector loans have not grown since April 2012.
“It remains questionable as to how much all the liquidity measures announced by the ECB will encourage banks to lift their lending,” IHS Global Insight economist Howard Archer said.
“…it is also questionable how much businesses’ demand for credit will pick up while the economic and political outlook looks so uncertain,” he said.
WEAK LENDING IN IRELAND
Draghi told Lithuanian business daily Verslo Zinios in an interview published on Thursday a continued weakness in credit growth was likely to curb the euro zone recovery.
Euro zone companies rely mainly on bank funding rather than capital markets, which is why it is so crucial to fix lingering problems in the sector.
For that purpose, the ECB is putting the bloc’s top banks through a thorough review of their balance sheets to weed out bad loans, update collateral valuations and adjust capital.
The picture varies across the euro zone. While lending to companies in Ireland fell at an annual rate of 11.8 percent in August – the fastest decline in three years – and 8.8 percent in Spain, it rose in Finland, Germany and France.
Euro zone M3 money supply – a more general measure of cash in the economy – grew at an annual pace of 2.0 percent in August, up from 1.8 percent in July.
Category Archives: Uncategorized
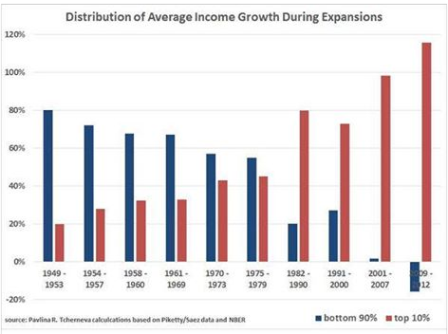
Chart from Pavlina Tcherneva
Business Roundtable survey falls from 95.4 to 86.6
Whoops…
Third quarter US growth outlook cloudy: Survey
Sept 6 (CNBC) — Corporate executives are scaling back plans for sales, capital spending and job creation this quarter, according to a the Business Roundtable (BRT) survey Tuesday, consistent with other indicators that have tempered growth expectations.
The group’s Economic Outlook Index—a snapshot of CEO expectations for the next six months of sales, capital spending and employment—fell to 86.4 from 95.4 in the second quarter of 2014, the association of top corporate CEOs said. The long-term average of the Index is 80.2.
The majority of the BRT’s members see plans for capital investment, hiring and revenues falling from the second quarter, with job plans declining the most. The 135 members who responded to the BRT’s survey expect 2014 gross domestic product of 2.4 percent, barely above last quarter’s 2.3 percent showing.
Industrial production
The chart looks true to the ‘down for the cold winter, followed by a bounce back, then back down’ narrative as previously discussed:
Industrial Production
Highlights
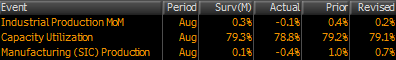
Industrial production slipped 0.1 percent in August after a gain of 0.2 percent the month before. Analysts expected a 0.3 percent boost for the month. The decline may be deceiving on auto assemblies on retooling schedules.
Manufacturing production fell 0.4 percent after a 0.7 percent increase in July. Weakness was led by motor vehicles which dropped a monthly 7.6 percent. In contrast, motor vehicle sales have been healthy, indicating that this is just a retooling timing issue. Manufacturing excluding motor vehicles rose 0.1 percent after a matching rise in July.
For other industries, mining rebounded 0.5 percent after slipping 0.3 percent in July. Utilities made a partial comeback of 1.0 percent, following a drop of 2.7 percent the month before.
Capacity utilization eased to 78.8 percent from 79.1 percent in July.
follow up on today’s releases
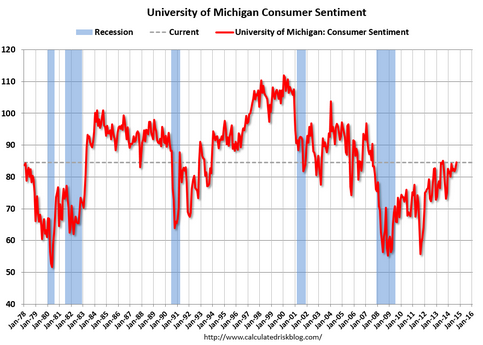
Consumer Sentiment up but stuck at historically low levels:
Full size image
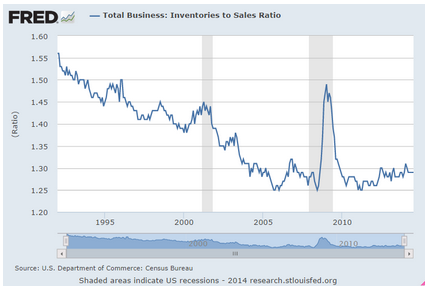
The chart shows how, over time, technology allows inventories to be lower than otherwise. The latest ‘counter trend’ drift to somewhat higher inventories have been ‘inflating’ GDP- adding over 1.5% to GDP in Q2- and could indicate inventories are getting excessive:
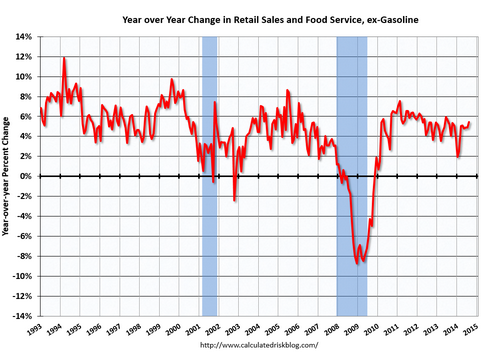
Retail Sales, Univ of MIch consumer sentiment
Seems 16 states had sales tax holidays in August that might have caused August sales to be up a bit and perhaps ‘borrow’ from September:
Tax Holidays
Note the area circled in orange shows a steady decline in the monthly growth rate, with a small uptick in August. We’ll see if that holds through September:
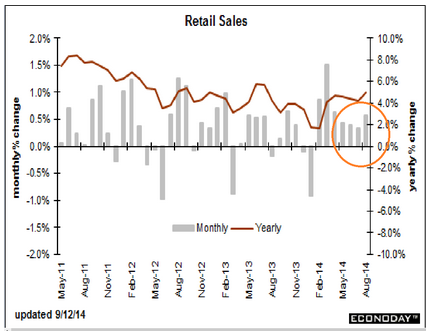
Retail Sales
Highlights
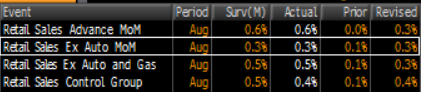
The consumer sector appears to be stronger than indicated by employment data. The consumer is out spending. Retail sales jumped 0.6 percent in August after a rise of 0.3 percent the month before. Analysts projected 0.6 percent for August. The July upward revision was significant-previous estimate of zero.
Excluding autos, sales gained 0.3 percent in both August and July, matching expectations. Excluding both autos and gasoline sales were quite healthy, increasing 0.5 percent, following a rise of 0.3 percent in July. Expectations were for 0.4 percent.
By detail, not surprisingly, motor vehicles increased 1.5 percent. Next, building materials & garden equipment gained 1.4 percent-suggesting some improvement in housing. Food services & drinking places sales were up 0.6 percent, showing healthy improvement in discretionary spending. This is a good sign for the consumer sector.
Weakness was led by a 0.8 percent decline in gasoline sales. Also, general merchandise dipped 0.1 percent.
Overall, August retail sales were healthy and point to moderately strong third quarter GDP growth. Economic news has oscillated in recent months but consumer spending may be suggesting that the economy is stronger than suggested by labor market numbers.
Full size image
Wholesale Sales
This came out today and was up some from last month, and touted as a show of strength.
Nothing to write home about best I can see:


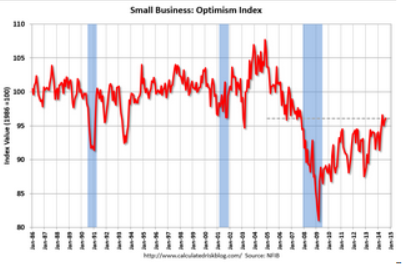
NFIB
Nothing happening here.
Note from the chart that it’s still near the lows of prior cycles.
From the National Federation of Independent Business (NFIB): NFIB SBET Sees Slight Bump in August
August’s Optimism Index rose 0.4 points to 96.1 making it the second highest reading since October, 2007. …
NFIB owners increased employment by an average of 0.02 workers per firm in August (seasonally adjusted), the eleventh positive month in a row but basically a “zero” net gain. emphasis addedHiring plans decreased to 10.
Full size image
ADP, productivity, trade, PMI services, Toll Bros. report

Maybe some evidence the 1.2 million who lost benefits at year end and took menial jobs phenomenon has run its course, and H2 will show substantially lower employment growth than H1?
When it was going up it was ‘accelerating’, so now it must be ‘decelerating’, right?
Hardly!
Mark Zandi, chief economist of Moody’s Analytics, said, “Steady as she goes in the job market. Businesses continue to hire at a solid pace. Job gains are broad based across industries and company sizes. At the current pace of job growth the economy will return to full employment by the end of 2016.”
Productivity and unit labor cost also figure into employment.
Higher unit labor costs and lower productivity can be a sign sales are falling and headcount is too high:
The current account continues to modestly narrow as a % of GDP, which supports GDP some but not a lot.
Not withstanding that it represents a reduction in real terms of trade/standard of living, of course.
International Trade
The trade deficit in July shrank marginally to $40.5 billion from $40.8 billion in June,
Exports rose 0.9 percent in July after no change the month before. Imports gained 0.7 percent, following a 1.1 percent drop in June.

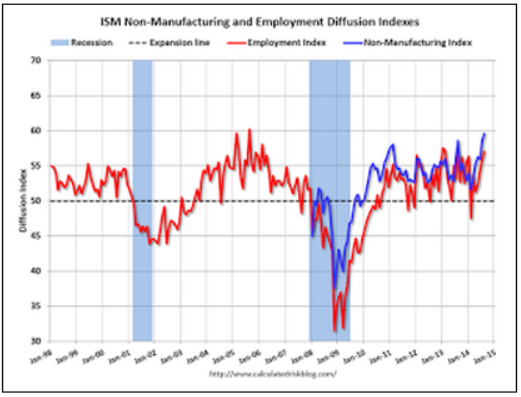
ISM Non-Mfg Index
Highlights
The ISM’s non-manufacturing sample is reporting extending acceleration in composite activity with the index rising 0.9 points to 59.6 from an already very strong 58.7 in July. The August reading is near the top end of the Econoday consensus.
The gain is led by the business index which rose 2.6 points to 65.0 in a reading that indicates exceptionally strong output. Employment is also a big plus, up 1.1 points to 57.1. This gain may offset to a small degree this morning’s weakness in ADP’s estimate for Friday’s jobs report.
One reading is not so positive and that’s new orders. Though coming in at 63.8, the rate of growth is down 1.1 points from July’s 64.9. Other readings include a slowing for supplier deliveries which is in line with the general rise in activity. Pressures on input prices slowed 3.2 points to 57.7 which is moderate for this reading.

Full size image
And this housing report:
Lawler on Toll Brothers: Net Home Orders Down, Price Gains Slow; Some “Lessening” in Pricing Power
From housing economist Tom Lawler: Toll Brothers: Net Home Orders Down, Price Gains on Orders Slows; Some “Lessening” in Pricing Power but No “Need” to Increase Incentives Much — Yet
Toll Brothers, the self-described “nation’s leading builder of luxury homes,” reported that net home orders in the quarter ended July 31, 2014 totaled 1,324, down 5.8% from the comparable quarter of 2013. Net orders per community last quarter were down 15.9% from the comparable quarter of 2013. The company average net order price last quarter was $717,000, up 1.4% from a year ago. Toll’s sales cancellation rate, expressed as a % of gross orders, was 6.6% last quarter, up from 4.6% in the comparable quarter of 2013. Home deliveries last quarter totaled 1,364, up 36.8% from the comparable quarter of 2013, at an average sales price of $732,000, up 12.4% from a year ago. The company’s order backlog at the end of July was 4,204, up 5.1% from last July, at an average order price of $737,300, up 4.1% from a year ago. The company controlled 49,037 home sites at the end of July, up 3.9% from last July and up 25.1% from two years ago.
For its “traditional” home building business (i.e., ex city living), net home orders totaled 1,281 last quarter, down 5.0% from the comparable quarter of 2014, at an average net order price of $700,500, up 3.4% from a year ago.
September govt rush to spend
I got this emailed to me. Makes sense.
Did US Macro Just Jump The Shark?
As in past years, this spike in activity is extrapolated by the smartest people in the room, leaving the reality to miss expectations for the rest of the year. A glance at the chart above might suggest, we just jumped the shark once more in US macro data for 2014…
* * *
As we concluded previously,
This begs the question: is the only reason why the economy tends to pick up momentum dramatically as the summer ends just a function of a surge in government spending permeating the broader economy as agencies scramble to spend all the money they have before the end of the September 30 Fiscal Year End (just so they get allocated the same or greater budget in the coming fiscal year), which subsequently plunges or is outright halted as the case may be right now?
If so, it would explain so much, and certainly why year after year, the US economy seems to pick up in the mid-to-late Q3 period, only to dramatically fade away in the coming months, as government spending goes from a waterfall to a trickle.
It would also put the government’s role in generating transitory periodic spikes in economic output under a microscope, especially since it is so clearly staggered to recur every September as one after another government agency spends like a drunken sailor. And if that is the case, how long until the BLS or some other agency (upon reopening of course) is taken to task to normalize not only for hedonic indicators and climate-related seasonal factors, but also for what is now clearly an annual aberration of economic output trends?