Saudi Pricing, Rail traffic, ISM non manufacturing index

Looks like the Saudis want prices to be a bit firmer:

http://www.bloomberg.com/news/articles/2016-09-04/saudi-arabia-raises-pricing-for-october-crude-to-asia-on-demand

Rail Week Ending 27 August 2016: All Rolling Averages Worsen And Remain In Contraction

Sept 2 (Econointerest) — Week 34 of 2016 shows same week total rail traffic (from same week one year ago) contracted according to the Association of American Railroads (AAR) traffic data. This week, all rolling averages’ contraction worsened.

90601

Analyst Opinion of the Rail Data

We review this data set to understand the economy – and one element continues to stand out. If I remove coal and grain from the analysis, rail is declining a steady 5% year-over-year for the last 14 weeks. I do not understand what is going on because this piece of data says goods consumption is down 5% – and it is not being confirmed by any data coming from the Federal Reserve, US Census or BEA. This piece of data says the USA is in a recession – but the monetary measures say the economy remains in expansion.

The contraction began over one year ago, and now rail movements are being compared against weaker 2015 data – and this is the cause periodic acceleration in the short term rolling averages. Still, rail is weak to very week compared to previous years.

This analysis is looking for clues in the rail data to show the direction of economic activity – and is not necessarily looking for clues of profitability of the railroads.

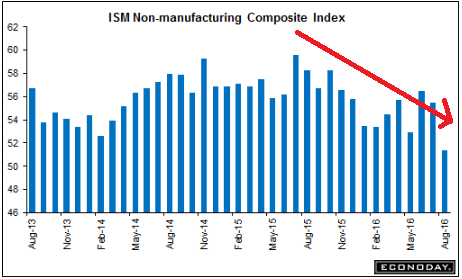
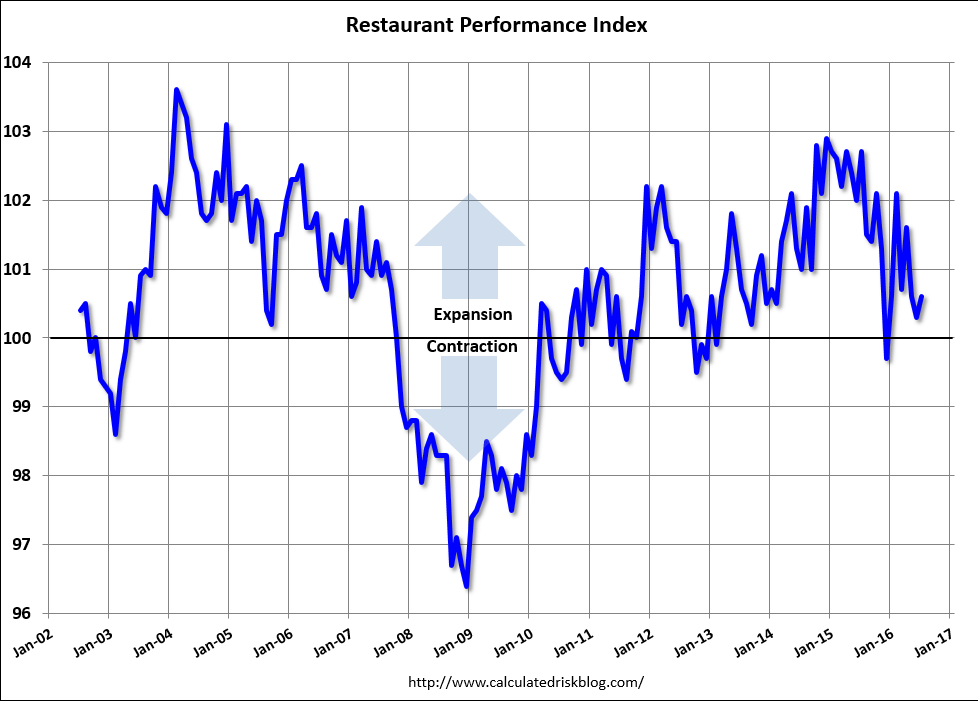
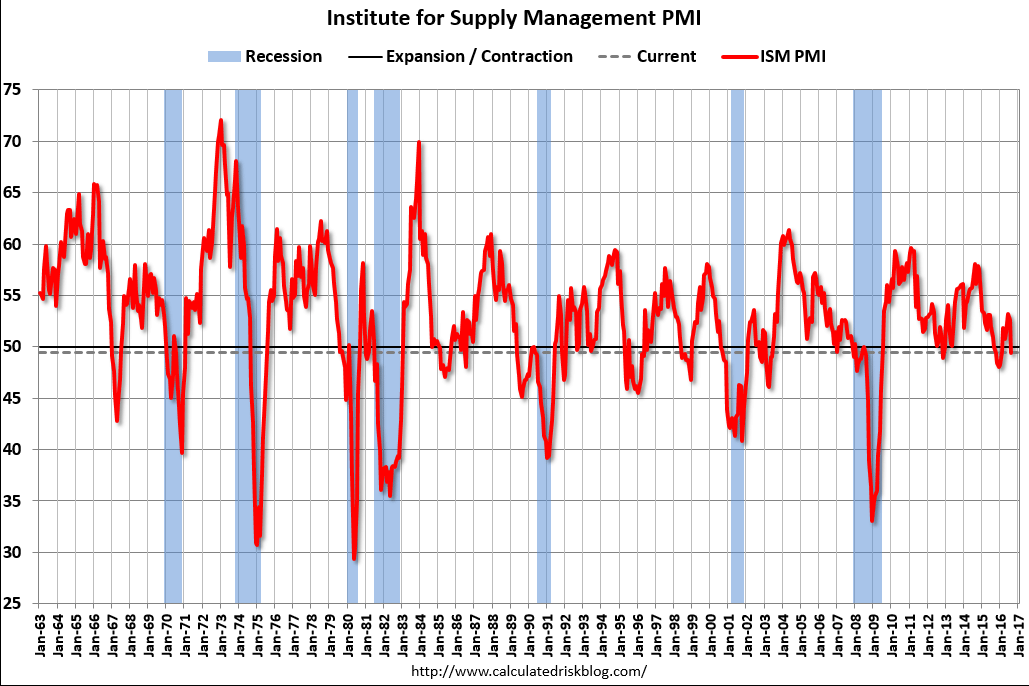
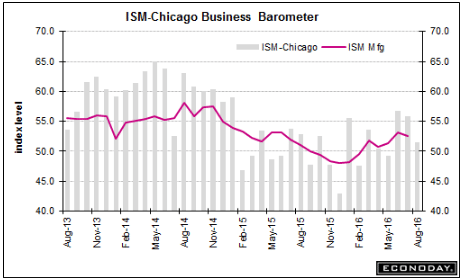
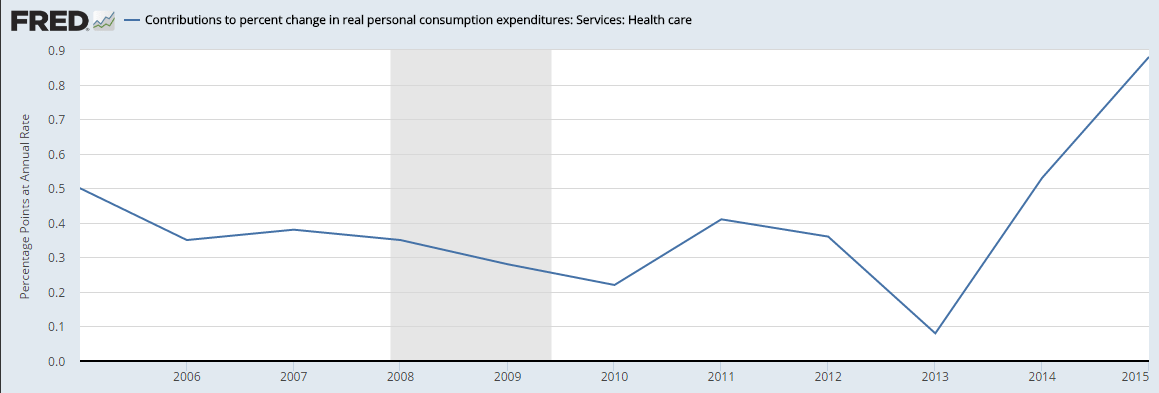
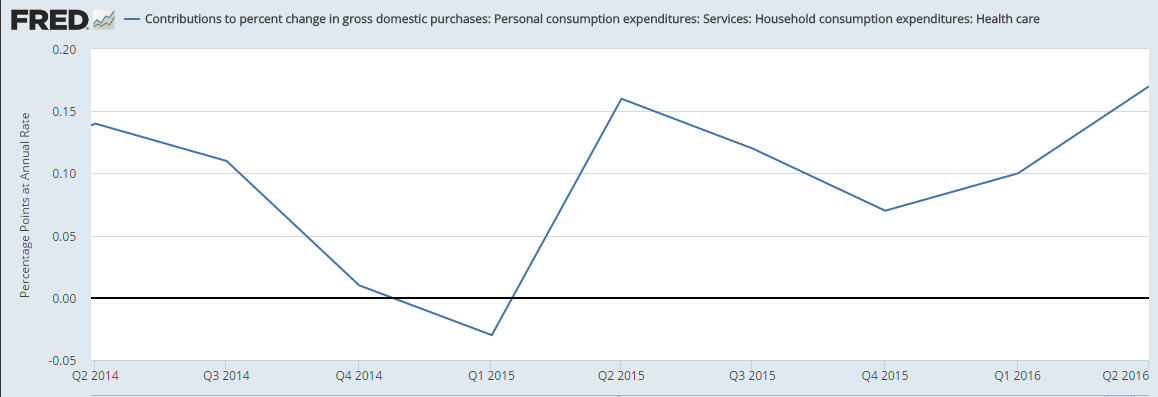
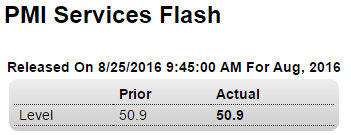
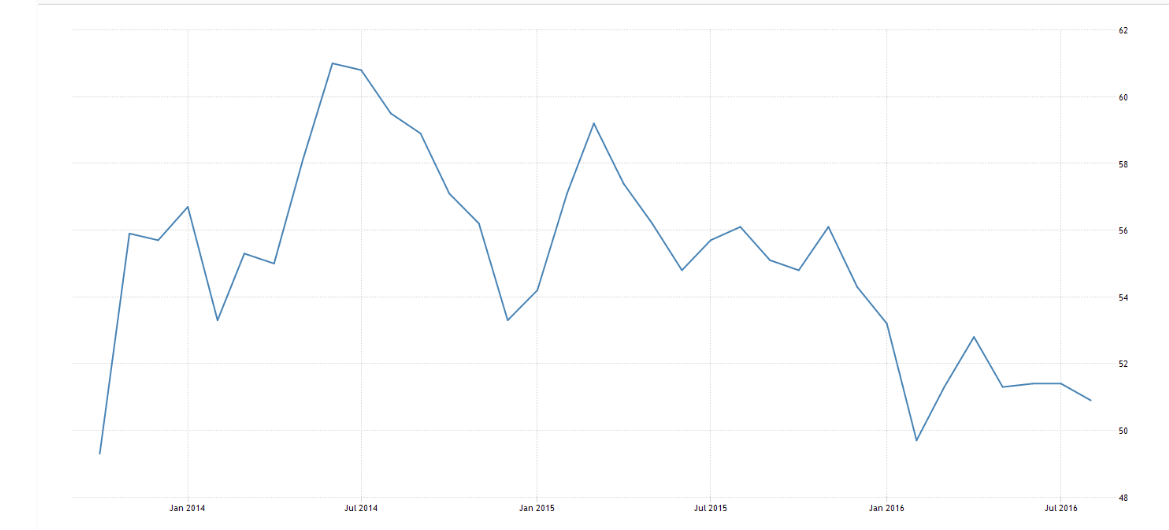
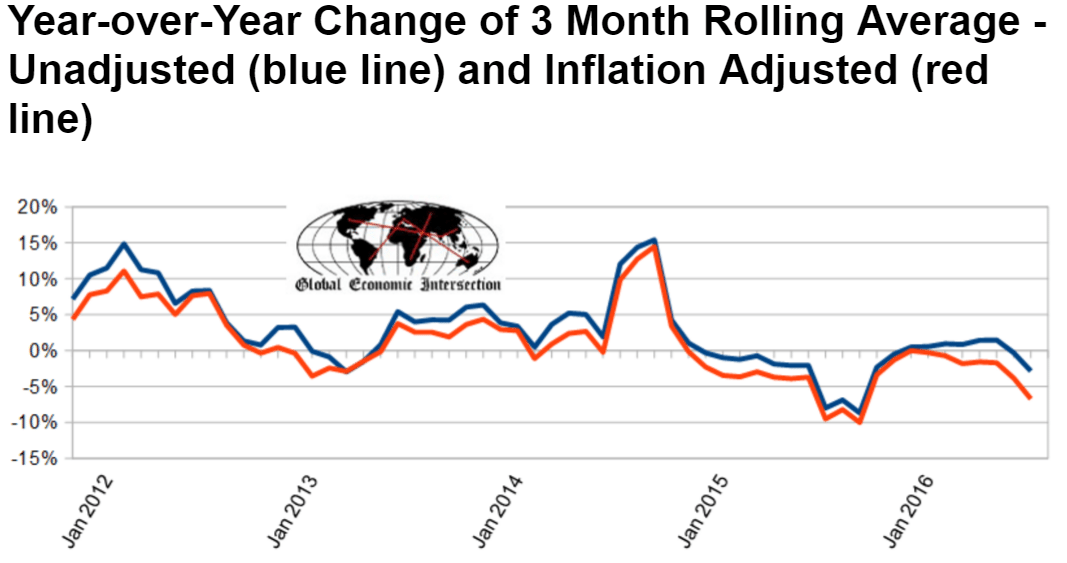
As previously discussed, the slowdown ‘spilled over’ into the service sector which has now been decelerating going on a year or so:
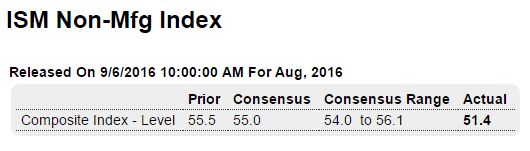
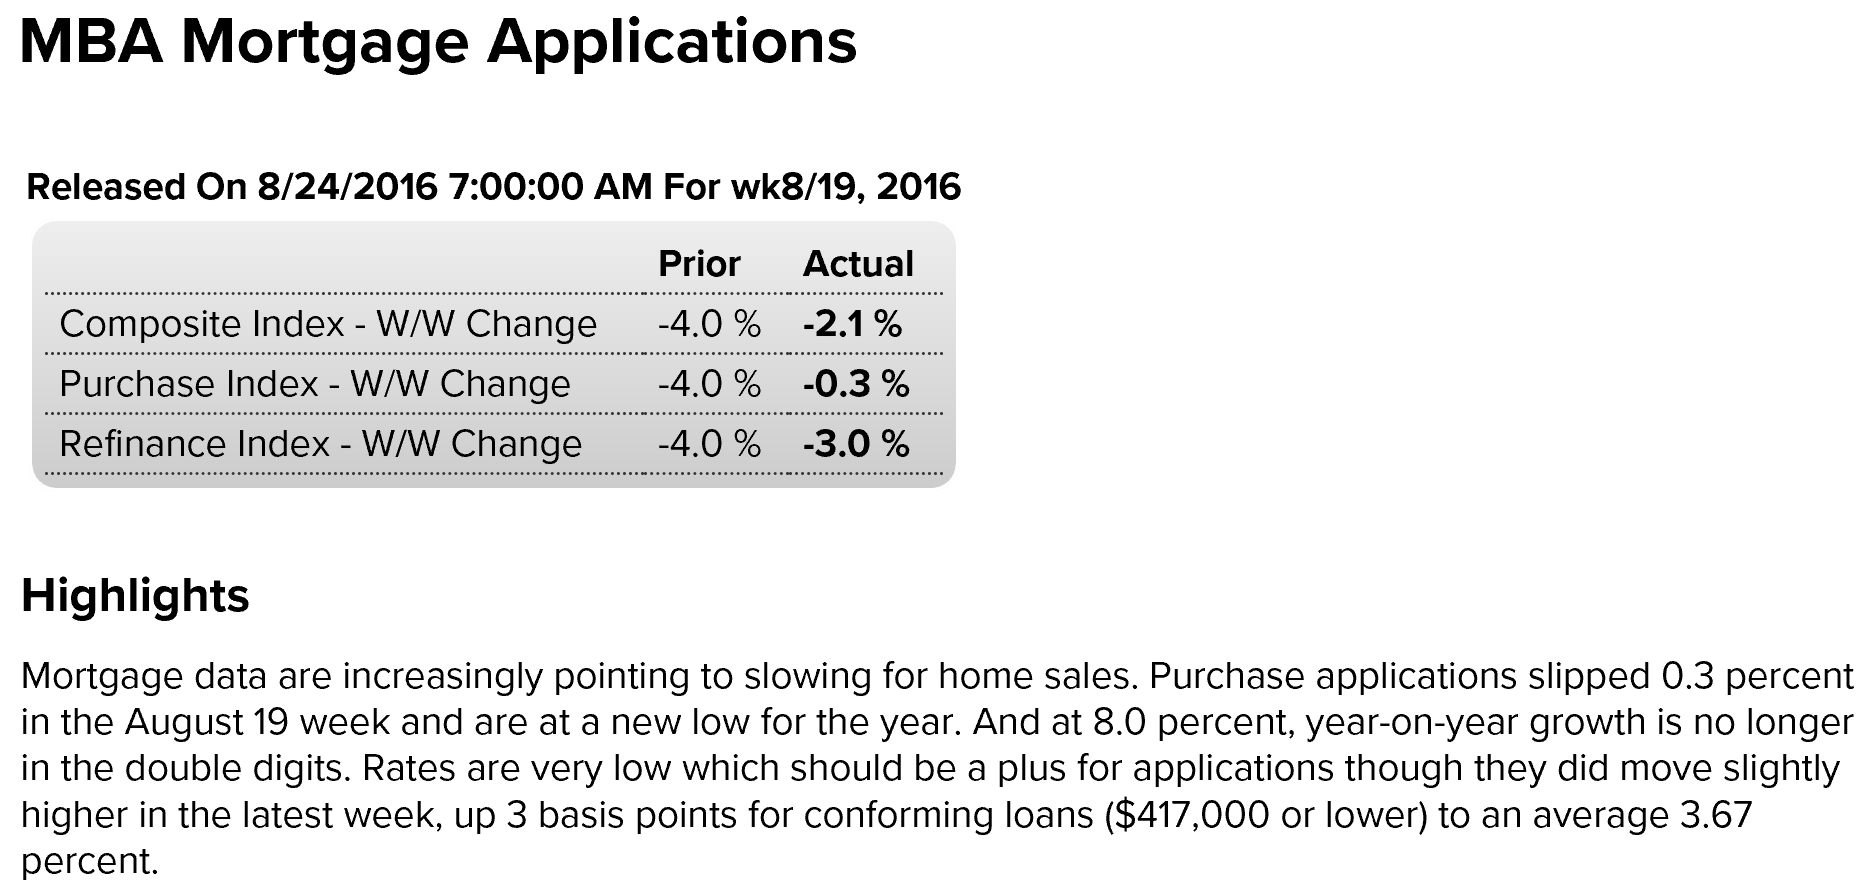
90602

Highlights

What had been one of the most consistently positive indicators stumbled badly in August as the ISM non-manufacturing index fell more than 4 points to 51.4. This is the lowest rate of composite growth for this sample of the whole cycle, since February 2010.

And the composite score is no fluke with new orders falling nearly 9 points to 51.4 for their lowest score since December 2013. New export orders are a particular disappointment, also down a steep 9 points and in contraction at 46.5 which is also the lowest score since December 2013. And backlog orders are also in contraction, down 1-1/2 points to 49.5.

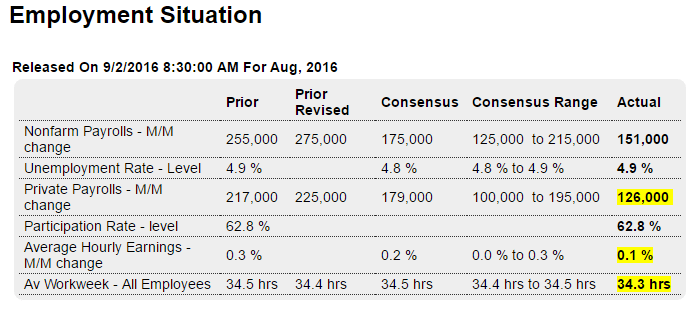
August’s lack of orders points to a weak spot ahead for other readings including business activity which has already slowed sharply, down 7-1/2 points to 51.8. Employment in the sample is still rising but only marginally, down 7 tenths to 50.7. Inventories are in contraction and prices paid are showing only modest pressure.

But there are positive spins to the report. New orders have been exceptionally strong in recent months including July’s 60.3 and the prior strength should help ISM’s sample bridge what hopefully will prove a one-month breakdown. Another positive is that most readings are still over 50 to indicate monthly growth which is underscored by what is still favorable breadth as 11 of 18 industries are still above 50. This report is not make-or-break for the economic outlook but it certainly will not raise pressure for a rate hike at this month’s FOMC meeting.

90603

Jobs, Factory orders

The deceleration of job growth continues since the collapse in oil capex:

90201

Highlights

The labor market is solid but maybe isn’t overheating, at least yet. Nonfarm payrolls rose a lower-than-expected 151,000 in August with revisions to July and June at a net minus 1,000. The unemployment rate holds at 4.9 percent with modest increases on both the employment and unemployment side of this reading. Earnings are very soft in this report, up only 0.1 percent in the month for a year-on-year plus 2.4 percent which is down a sizable 3 tenths from July and isn’t pointing to any wage-hike flashpoint. And the workweek is down, at 34.3 hours with July revised 1 tenth lower to 34.4.

Goods producing payrolls are down across the board reflecting weakness in mining, construction and manufacturing. But service sector jobs are once again strong and include further gains for professional & business services as well as a 25,000 increase in government jobs.

There are definitely weak spots in this report though the headline payroll gain of 151,000 is respectable but isn’t high enough to give the hawks the advantage at this month’s FOMC where a rate hike will, at least, be discussed.

90202
It’s been an ‘L’ shaped recovery, at best:

90203
Wage growth can’t even get back to levels of the last recession:

90204
Still in contraction vs last year, and inventories remain far too high:

90205

Highlights

The early indications for August are soft to mixed but July was definitely a solid month for the factory sector. After monthly declines of 1.2 and 1.8 percent in May and June, factory orders surged 1.9 percent in July for the best gain since October last year.

Orders for core capital goods (nondefense ex-aircraft) were especially strong in July, up 1.5 percent following June’s 0.5 percent gain in readings that upgrade what has been a very soft outlook for business investment. Aircraft, which is always volatile in this report, is July’s biggest plus, surging 90 percent in the month. But vehicles are a negative in the report, down 0.5 percent.

Other negatives include factory shipments which slipped 0.2 percent and include a 0.5 percent decline in shipments of core capital goods. The latter decline is an immediate negative for the nonresidential fixed investment component of the GDP report though the big order gains in July and June for core capital goods point to future strength for this reading. Factory inventories are stable and lean, edging 0.1 percent higher in the month to keep the inventory-to-shipments ratio unchanged at 1.35.

This report is mostly solid but is a bit dated. This morning’s employment report showed a decline in factory hours which points to a retreat for manufacturing in the next industrial production report, a report which, like factory orders, showed strength in June and July. On net, the factory sector doesn’t look like it will be contributing much to second-half economic growth but it doesn’t look to be a negative either.

90206

Vehicle sales

Not good. Pronounced slowdown. Negative contribution to growth:

Based on a preliminary estimate from WardsAuto (ex-Porsche), light vehicle sales were at a 16.89 million SAAR in August.

That is down about 5% from August 2015, and down 5.0% from the 17.77 million annual sales rate last month.

Read more at http://www.calculatedriskblog.com/#Zf1iZ5B4Y5kxSm5C.99

Highlights

The bulk of August’s sales data is out and vehicle sales are running below July, roughly in the low 13 million annualized area for North American-made models vs 14.3 million in July. Though sales levels remain solid, the decline from July points to trouble for the August retail sales report. Final sales totals will be posted at day’s end.

90107

Restaurant performance index, PMI manufacturing, ISM manufacturing, Construction spending

The downtrend looks intact, and on the edge of contraction:

90101

90102

Highlights

Markit’s U.S. manufacturing sample continues to report month-to-month growth but slow growth. The PMI for August came in at 52.0 which is only modestly above the 50 level that divides monthly growth from monthly contraction. Growth in new orders slowed which is a key negative in the report, along with slowing in employment. The sample is also cutting its inventories which points to lack of confidence in the business outlook. Price data are flat which is yet another indication that demand is soft. But there are positives including strength in production, which however won’t last long if orders remain weak. And there’s an important indication of strength in orders as new export orders posted a rare gain. This report in sum points to no better than flat conditions ahead for manufacturing.

90103
This one went negative:

90104

Highlights

August was a disappointingly flat month for ISM’s manufacturing sample where the composite index posted its first contractionary sub-50 reading since February, at 49.4 for a more than 3 point decline.

Details are likewise soft including new orders which, after a long solid run, fell nearly 8 points to 49.1 for their first sub-50 score since December. And backlog orders are in deepening contraction, at 45.5 for a 2.5 point decline. Production is just below 50 as are inventories and also employment, which at 48.3 is under 50 for the eighth time in nine months.

This report has been very solid in recent months especially new orders, important considerations that limit August’s negative indications. Factory data have been struggling all year and this report takes some of the shine off very solid government reports in July when both industrial production and durable goods orders posted good gains. Watch for July factory orders on tomorrow’s calendar.

90105
The deceleration is obvious:

90106

Mtg Purchase apps, Chicago PMI, ADP employment forecast, Pending home sales, Tax receipts

Mortgage purchase applications are now down to only 5% higher than a year ago:

83101
A lot worse than expected:

83102

Highlights

Business growth has slowed in Chicago this month based on the city’s PMI which fell more than 4 points but, at 51.5, is still over breakeven 50. New orders slowed while backlogs fell sharply and into sub-50 contraction. Production also slowed while inventories were drawn down. Employment posted a gain and is the strength of the August report, strength however that isn’t likely to improve further unless orders rebound.

83103
The downward slope in year over year growth since oil capex collapsed continues:

83104
Large downward revision to June, and July remains suspect for another month when it gets revised. Meanwhile, the year over year numbers show little or no growth, much like the growth in permits for new construction:

83105

Highlights

Pending home sales jumped higher in July but from a June that is now revised sharply lower. The July index came in at 111.3, a level that is only marginally above June’s initial reading of 111.0 but is 1.3 percent above the revised level of 109.9. The index hit a recent peak in April at 115.0.

Looking at the year-on-year rate, pending sales are up 1.4 percent which doesn’t point to much acceleration ahead for final sales of existing homes where this rate in July slipped into the negative column for the first time in two years.

Regional data show the West out in front after a sharp rise in July, at a year-on-year plus 6.2 percent followed by the Northeast at 1.1 percent and the South at 0.4 percent. The Midwest is only the region in the negative column, though only at 1.1 percent.

Sales of existing homes aren’t showing the life that sales of new home sales are showing though strength in the latter does point to strength ahead for the resale side.

83106

Personal income and spending, Dallas Fed

In line with expectations as real disposable income growth remains at or below ‘stall speed’, as per the charts. And the total growth of that measure of income since the 2008 peak remains very low. On the consumption side, the mini jump in auto sales provided the (small) boost for the month, though down year over year, and auto sales forecasts for August are all pointing to a resumption of weakness:

82901

Highlights

Income picked up slightly in July and consumption slowed slightly in what was another constructive month for the consumer.

Personal income rose 0.4 percent in the month with June revised 1 tenth higher to plus 0.3 percent. Income got another solid boost from wages & salaries which rose 0.5 percent for a second straight month. The consumer put some of this money into the bank with the savings rate rising 2 tenths to 5.7 percent.

Consumer spending rose 0.3 percent in the month following 0.4 percent gains in the prior two months. Spending on durables got a big boost from the month’s strong auto sales while non-durables were pulled down by price effects for energy. Service spending was solid but down slightly from prior months.

Price data are not showing any pressure, unchanged in the month for the overall PCE price index and up only 0.1 percent for the core index (ex-food ex-energy). The year-on-year rate for the core PCE, which is the Fed’s central price gauge, is unchanged to extend a long string, stuck at 1.6 percent.

The respectable showings for income and spending are no surprise given the strong employment report for July, strength that is the underpinning of the consumer. The outlook for August will unfold this week, with vehicle sales on Thursday and the employment report on Friday.

82902

82903
Production up a bit but General Activity Index down:

82904

Highlights

There’s as many positives as negatives in the August manufacturing report from the Dallas Fed, which is a plus since negatives usually dominate this report. The production index rose more than 4 points to 4.5 while the new orders index jumped more than 13 points and is in positive ground at a modest but still respectable 5.3. Another positive is the future assessment of general activity, in positive ground for three months in a row and at 7.0 in August.

But there are negatives including the current assessment of general activity, falling nearly 4 points to minus 6.2 for the 20th straight negative result. Employment is at minus 5.0 and hours worked edged lower. Price data show pressure for inputs but continued declines for selling prices, all at the same time that wages & benefits continue to rise.

This along with the Kansas City Fed report have been depressed the past 2 years due to the drop in energy prices. But today’s report, though no better than mixed, does show signs of improvement, in a reminder of last week’s solid strength in the durable goods report.

United States Dallas Fed Manufacturing Index

The Federal Reserve Bank of Dallas’ general business activity index for manufacturing in Texas came in at -6.2 in August of 2016 from -1.3 in July, worse than market expectations of -3.9. Production (4.5 from 0.4 in July); new orders (5.3 from -8) and shipments (9.9 from 0.1) improved while job creation (-5 from -2.6) and hours worked (-4.5 from -0.2) worsened. The index of general business activity for the next six months fell to 7 from 18.4.

Car sales, Bank loans

More evidence the wheels are coming off, not that there have been any doubts…

From WardsAuto: Forecast: U.S. Light Vehicles Sales Weaken in August

A WardsAuto forecast calls for August U.S. light-vehicle sales to reach a 17.4 million-unit seasonally adjusted annual rate, less than like-2015’s 17.7 million and July’s 17.8 million, but ahead of the 17.2 million recorded over the first seven months of this year.

From J.D. Power: August Decline in New-Vehicle Sales Fourth in Last Six Months

The SAAR for total sales is projected at 16.8 million units in August 2016, down from 17.7 million units a year ago.

Read more at http://www.calculatedriskblog.com/#vt6cCRe2JUOvoVoB.99

This chart is through July:

82701
This keeps decelerating as well:

82702

This is not about one month’s numbers. It’s been a full retreat ever since the collapse of oil capex at the end of 2014, with no sign yet of anything but more of same until deficit spending- private or public- picks up sufficiently to offset the ‘normal’ amount of unspent incomes.

And as previously discussed, it wouldn’t surprise me if future revisions show that the recession started a year ago or maybe even before that.

From 1998, Q2 GDP revision, Corporate profits, Trade, Consumer sentiment

Something I wrote that got published in 1998:

82608
Revised down, note how the year over year growth has been continuously decelerating ever since the collapse of oil capex, and the strength in consumer spending looks like it could be about healthcare premiumus, which portends cutbacks elsewhere, hence the weaker q3 retail sales, etc. And with inventories still looking way too high, proactive inventory building doesn’t seem likely. Nor does the most recent housing data bode well for housing in q3:

82609

Highlights

Second-quarter GDP proved very soft, at only a plus 1.1 percent annualized rate for the second estimate following even softer rates in the prior two quarters of 0.8 and 0.9 percent. But masked in the latest quarter is a very strong 4.4 percent annualized growth rate for consumer spending which is 2 tenths higher than the first estimate. Inventory draw is the quarter’s culprit, pulling down GDP by a very steep 1.3 percentage points. But, in a counter-intuitive twist, lighter inventory in times of slow economic growth is a major positive for future production and employment and is a major plus for the ongoing quarter.

Residential investment is a disappointment in the second-quarter data, falling at a 7.7 percent annualized rate but following large gains in prior quarters. And building strength in new home sales points to a rebound for this reading in the third quarter. The biggest disappointment in the quarter is another decline, at a 0.9 percent rate, in nonresidential fixed business investment which points to business caution and continuing problems ahead for worker productivity. Price data show some pressure tied to oil with the GDP price index up 1 tenth from the first estimate to a year-on-year 2.3 percent.

The major takeaway from the second quarter is not the headline growth rate but the strength of the consumer, evident in the solid 2.4 percent rise in final sales, which is double the pace of the two prior quarters. The early outlook for the third quarter is positive, with estimates trending at about 3 percent growth.

82610
This one’s the contribution to PCE from July 29 data:

82611
This is the contribution to GDP from today’s data:

82612
Decelerating year over year:

82613
Not quite as bad but still negative:

82614

United States Corporate Profits

Corporate profits in the United States decreased by 2.4 percent or $36.3 billion to $1469.7 billion in the second quarter of 2016, after rising an upwardly revised 8.1 percent in the previous period, preliminary estimates showed. Dividends decreased 0.9 percent or $8.2 billion in the second quarter (compared to a gain of 0.8 percent or $7.3 billion in Q1) and undistributed profits dropped 5.2 percent or $28.1 billion (compared to a rise of 24.3 percent or $106.1 billion in Q1). Also, net cash flow with inventory valuation adjustment, the internal funds available to corporations for investment, fell 1.1 percent or $22 billion, after going up by 5.7 percent or $112.7 billion in the previous period.

82615
82616

Highlights

A surge in food exports helped cut the nation’s goods gap in July to $59.3 billion from June’s revised $64.5 billion. Exports of foods, feeds & beverages rose 31 percent in the month though export prices of agricultural goods actually dipped slightly in the month. Other export readings are less favorable including a decline for capital goods, reflecting weak global investment in new equipment, and a small dip for consumer goods. A dip in imports also helped narrow the headline gap in July as capital goods imports and especially consumer goods imports fell sharply. The improvement in today’s headline is a big plus for early third-quarter GDP estimates but it doesn’t point to strength in underlying cross-border demand.

Looks like inventories continue to decline which doesn’t bode well for current output, as previously discussed:

82617

Highlights

Wholesales inventories are unchanged in the preliminary reading for July following a 0.2 percent build in June. Retail inventories fell 0.4 percent in July vs a 0.3 percent build in June. These results point to the need for inventory rebuilding and are a positive for the economic outlook.

Less than expected and declining, with the move up 4 months ago now completely reversed:

82618

Highlights

Consumer sentiment is steady and respectable, at 89.8 for the final August reading and a 6 tenths dip from mid-month and a 2 tenths dip from final July. The expectations component edged higher in the month to 78.7 which hints at confidence in the jobs outlook. Hinting at marginal softening in the current jobs market is the current conditions index which is down 2.0 points to a still solid 107.0. Inflation readings are especially weak in this report, reflecting in part this month’s downturn in gasoline prices. One-year expectations are down 2 tenths to 2.5 percent with the 5-year outlook down 1 tenth and also at 2.5 percent.

81619

PMI services, Durable goods orders, KC Fed

Weakness now includes the service sector:

82601

United States Services PMI
The Markit Flash US Services PMI came in at 50.9 in August of 2016, down from 51.4 in the previous month and below market expectations of 52. It is the lowest reading since February with business activity, new orders and employment all slowing due to subdued demand conditions and uncertainty ahead of the presidential election.

82602
Up a bit more than expected for the month, but remains in contraction year over year:

82603

Highlights

The factory sector, after a frustrating first half of the year, is now definitely showing life. Durable goods orders jumped 4.4 percent in July in a headline gain exaggerated by a swing higher for commercial aircraft but including gains across most readings. Excluding the gain for aircraft and no change for autos, orders rose a very sizable 1.5 percent. And the strength includes core capital goods where orders jumped 1.6 percent to show new demand for business equipment and machinery.

Though the gain for new orders points to future strength for shipments, shipment data for July are soft. Total shipments rose only 0.2 percent in the month with core capital goods shipments, which are an input into the nonresidential investment component of the GDP report, down 0.4 percent to get the third-quarter off to a slow start. And immediate negatives for tomorrow’s second estimate of second-quarter GDP are incremental downward revisions to core capital goods shipments in June and May, now at minus 0.5 and minus 0.7 percent.

Unfilled orders are also a concern in the report, down 0.1 percent in July on top of June’s very steep 0.9 percent decline. Lack of unfilled orders is not only a negative for production but also for employment. On the plus side, inventories broke a long run of contraction with a 0.3 percent rise and are still very lean with the inventory-to-shipments ratio unchanged at 1.64.

Turning back to new orders, other areas of monthly strength include both primary and fabricated metals, electrical equipment, and defense aircraft. A general trend reading underscoring the report’s strength is the year-on-year new order rate for ex-transportation, now at only minus 0.6 percent vs minus 3.4 percent in June.

The 3 month moving average, which smooths out some of the month to month volatility, isn’t looking so good:

82604

  • Inflation adjusted but otherwise unadjusted new orders are down 9.9 % year-over-year.
  • Backlog (unfilled orders) decelerated 0.2 % month-over-month, but is still contracting 2.2 % year-over-year.
  • The Federal Reserve’s Durable Goods Industrial Production Index (seasonally adjusted) growth decelerated 0.2 % month-over-month, up 0.6 % year-over-year [note that this is a series with moderate backward revision – and it uses production as a pulse point (not new orders or shipments)] – three month trend is decelerating, but the trend over the last year is relatively flat.
  • 82605

    82606
    Remains in contraction, while the head of that Fed keeps calling for rate hikes:

    82607

    Highlights

    Conditions in the Kansas City manufacturing sector, hit as it is by weakness in the energy sector, remain very difficult. The composite index is at minus 4 this month to extend a nearly unbroken string of contraction going back through last year. New orders are at minus 7, backlog orders at minus 4, and employment is at minus 10. Production is down, shipments are down, and inventories are down. Price data are soft with selling prices in a second month of contraction. This morning’s durable goods report is very positive but doesn’t extend to this report which, like other regional Fed reports and to a greater degree, is pointing to weakness this month for the factory sector.