Housing market index, Redbook retail sales, Housing starts

Up a bit, but until permits increase not much chance of home building increasing:

92001
92002

Been going from bad to worse:

Highlights

Redbook’s sample is not pointing to any September improvement for core retail sales. Year-on-year same-store sales rose only 0.2 percent in the September 17 week, about in line with August and noticeably lower than July — two months when the government’s ex-auto ex-gas reading posted 0.1 percent monthly declines. Rates in this report don’t always match those in actual government data which focuses our attention on trends, and the trend for this report is not favorable.

92003

Down for reasons previously discussed, and new permits are down as well:

92004

92005

92006

92007

Credit check

A very small move up but the deceleration trend is intact:

91801
This has been moving lower as well for a while now:

91802
As always, and by identity, if anyone spent less than his income, another must have spent more than his income, or the output would not have been sold.

So when the oil related capital expenditure collapsed late in 2014, it caused a general deceleration of growth that has yet to show any signs of reversal.

That is, spending continues to decelerate, causing inventory to go unsold, which leads to reduced production and reduced incomes, further slowing spending, in a downward spiral that can’t reverse until some entity spends sufficiently more than its income. At some point growth goes negative, and it wouldn’t surprise me if data revisions indicate that growth has already gone negative, perhaps as much as a year ago.

The current slowdown has begun to reduce the growth of tax revenues, which ‘automatically’ causes government to begin increasing its deficit.

If this is the only source of increased deficit spending the process of deceleration will continue until the Federal deficit gets large enough to offset the net desires to not spend incomes. Historically this has generally translated into a Federal deficit that exceeds 5% of GDP, depending on ‘non government’ (US residents + non residents) deficit spending, which accomplishes the same thing. In fact, the reason the Fed lowers interest rates is to support private sector deficit spending. Unfortunately lower rates hasn’t done that, and is unlikely to do that, for reasons previously discussed.

Currently the Federal deficit is running at something less than 3% of GDP, so there’s probably a long way to go:

91803

Retail Sales, Industrial production, Inventories, Empire survey, Phili Fed survey, Atlanta Fed

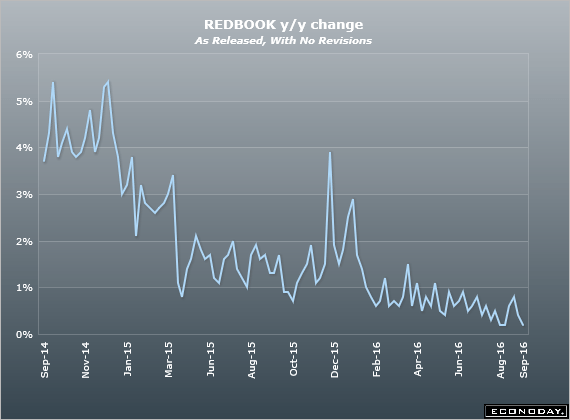
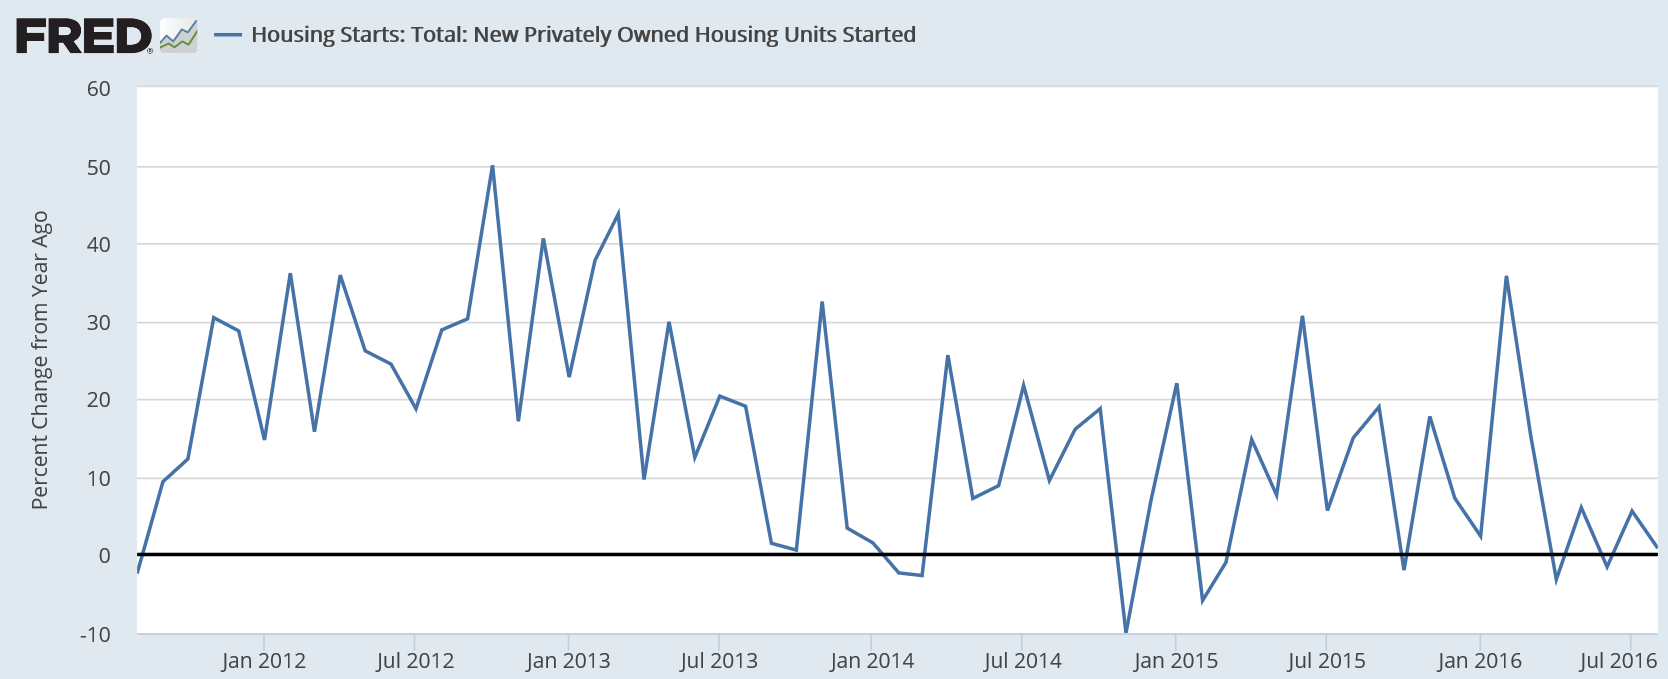
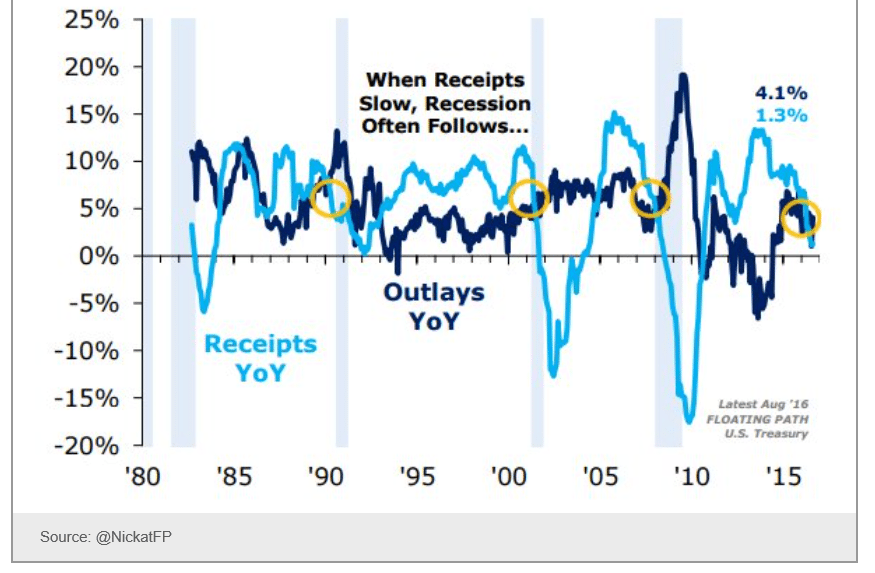
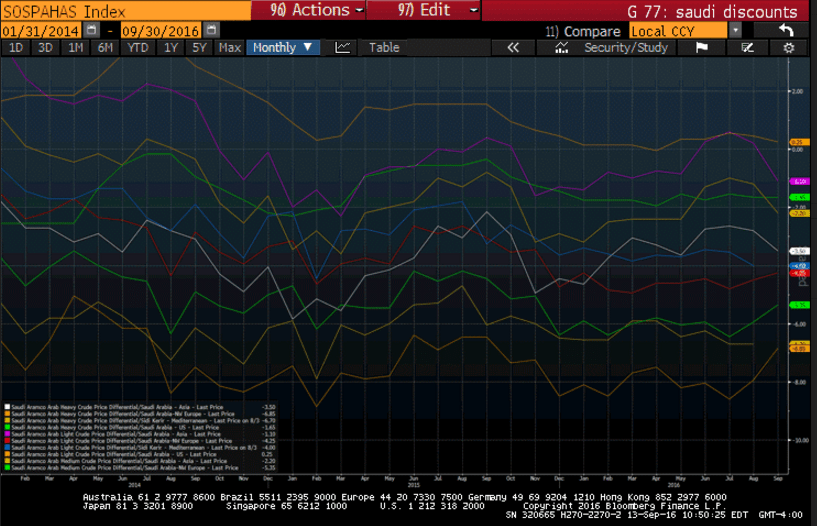
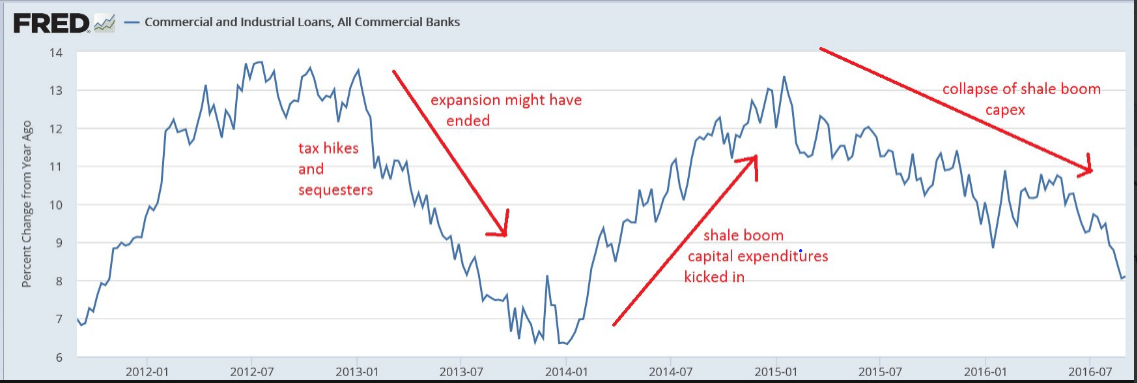
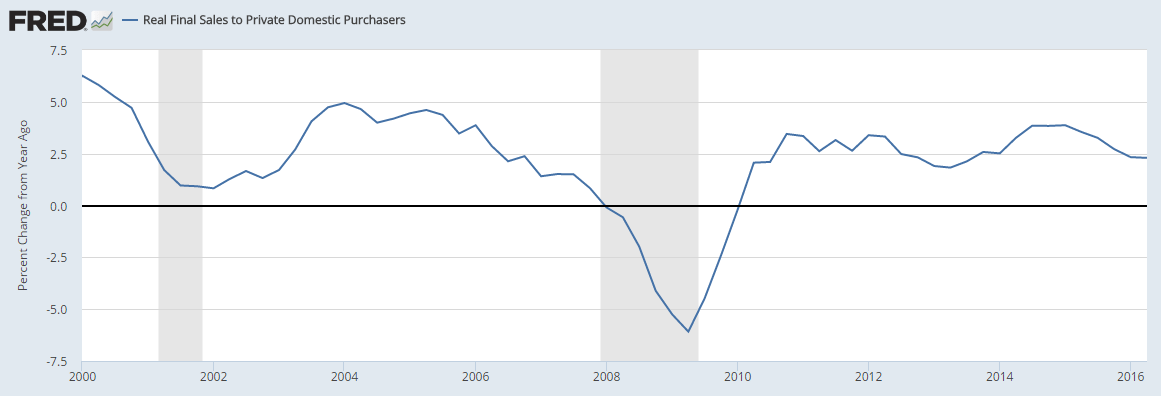
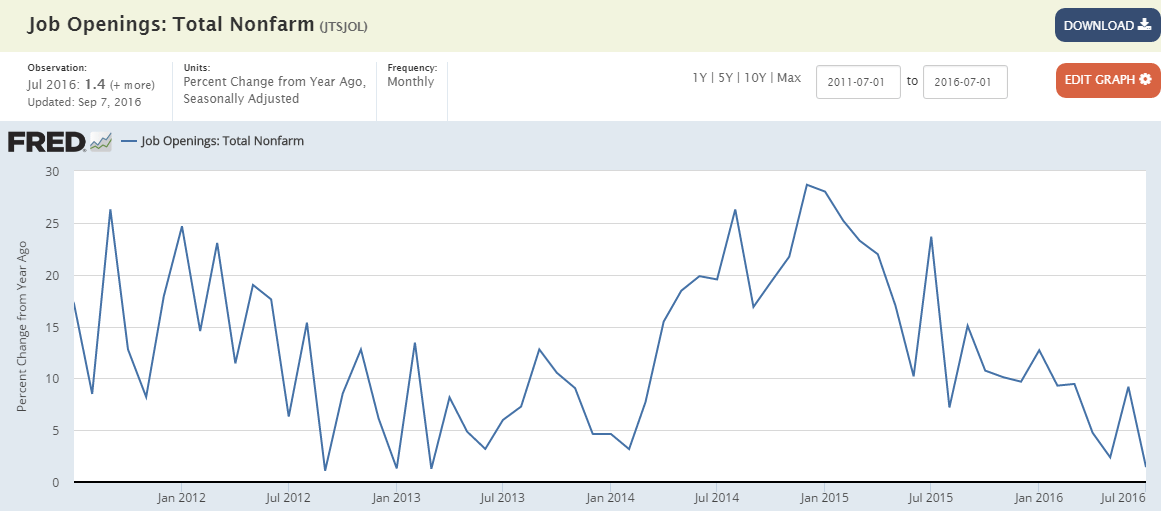
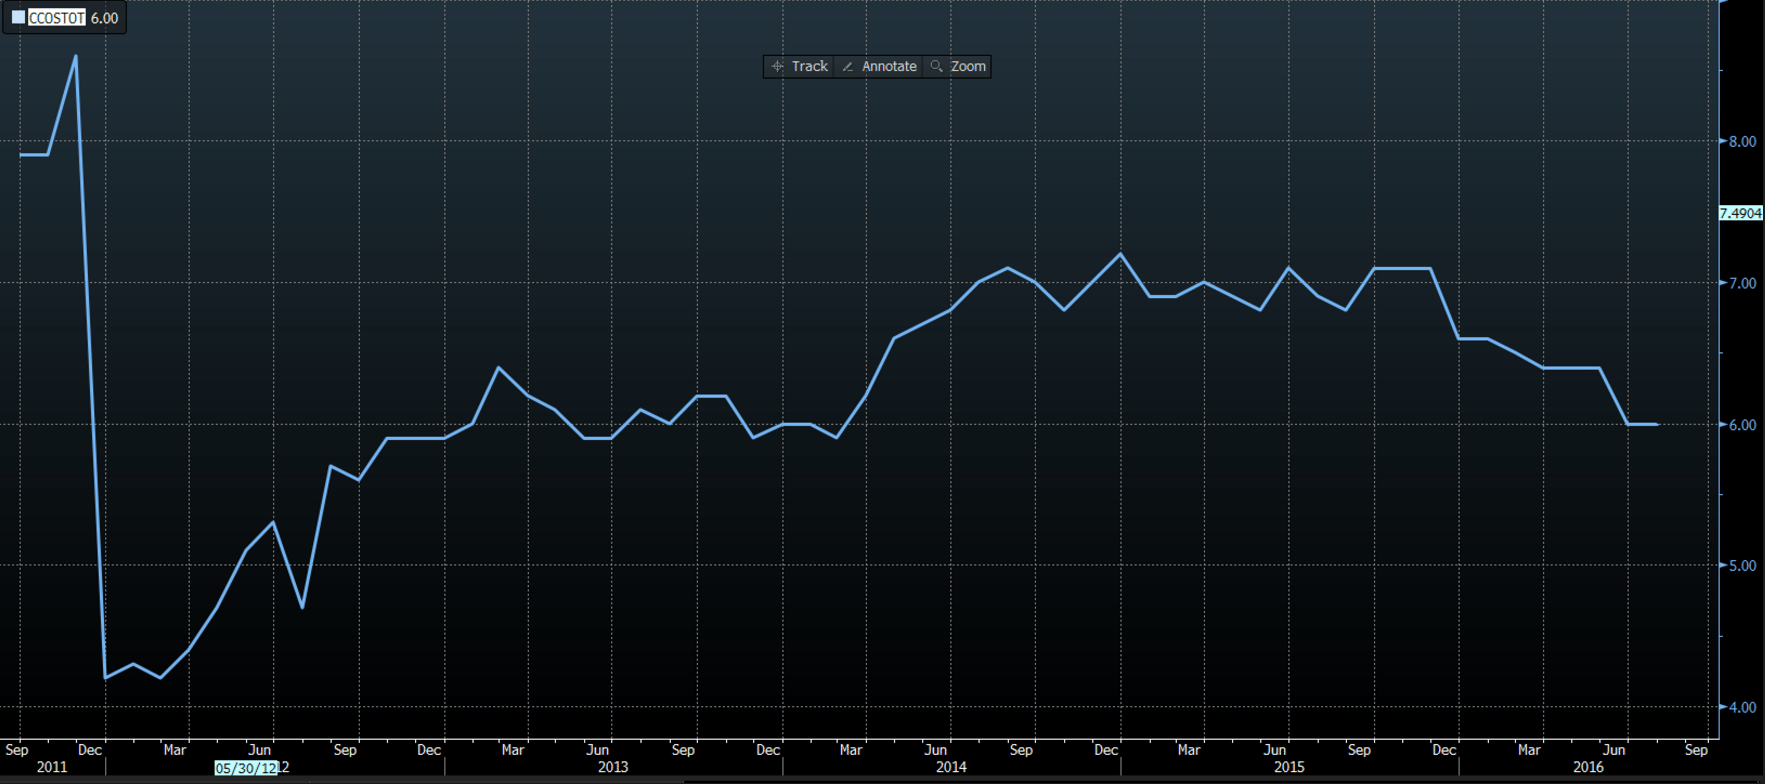
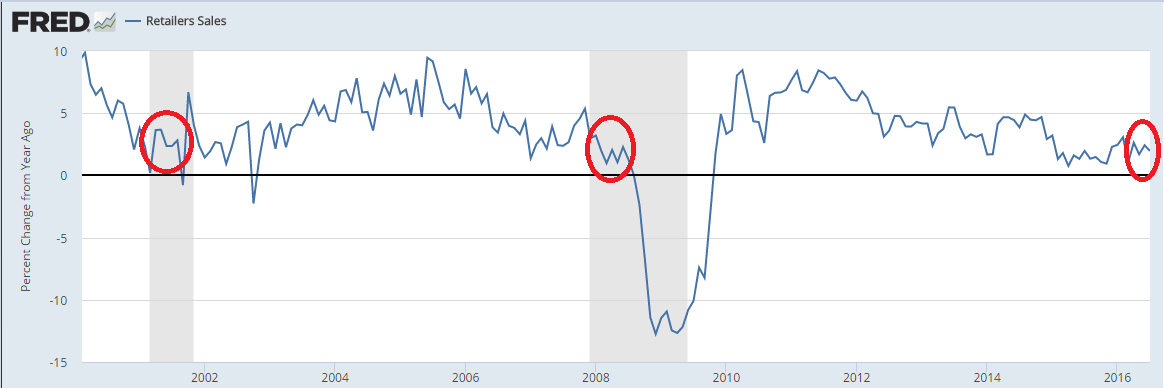
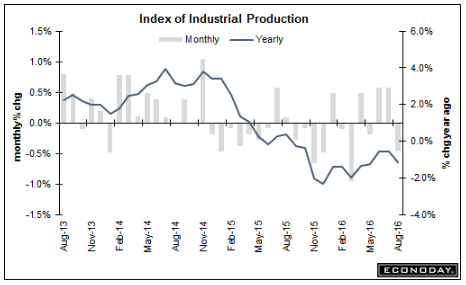
The slow motion train wreck that began in late 2014 with the collapse of oil capex continues unabated, with no sign of reversal that I can detect, and the annual rate of growth is consistent with prior recessions:
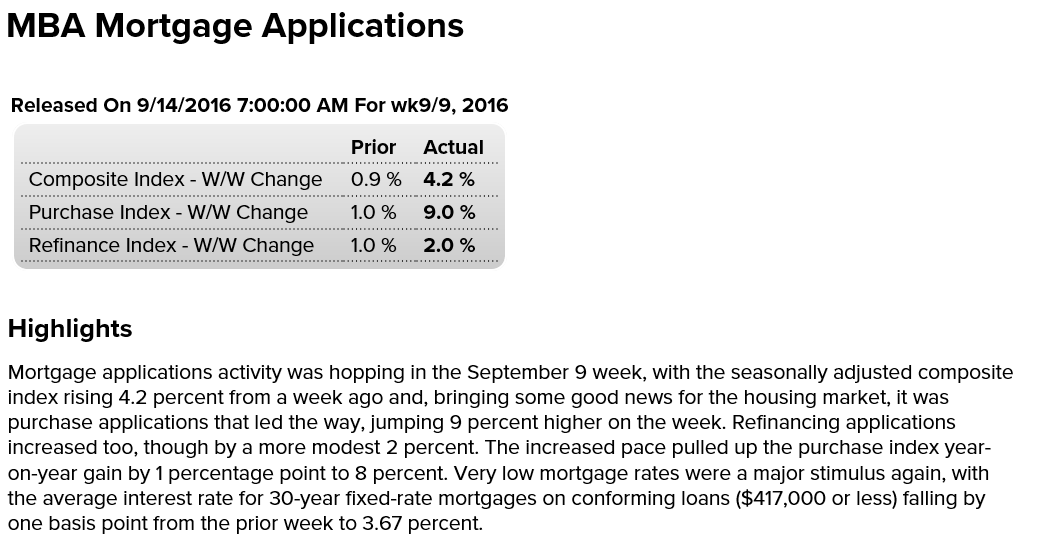
91501

Highlights

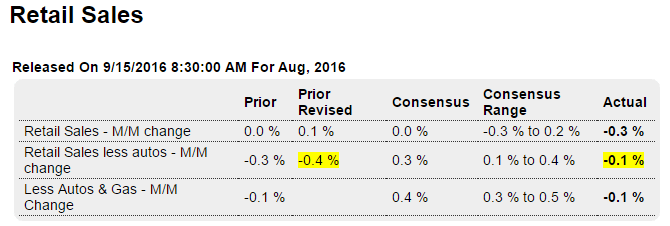
After spending heavily in the second quarter, the consumer has stepped back so far in the third quarter. Retail sales, after inching up a revised 0.1 percent in July, fell 0.3 percent in August and do not just reflect expected weakness in auto sales. Excluding autos, sales slipped 0.1 percent while excluding both autos and gasoline, which is an important core reading, sales also fell 0.1 percent which is the second straight decline.

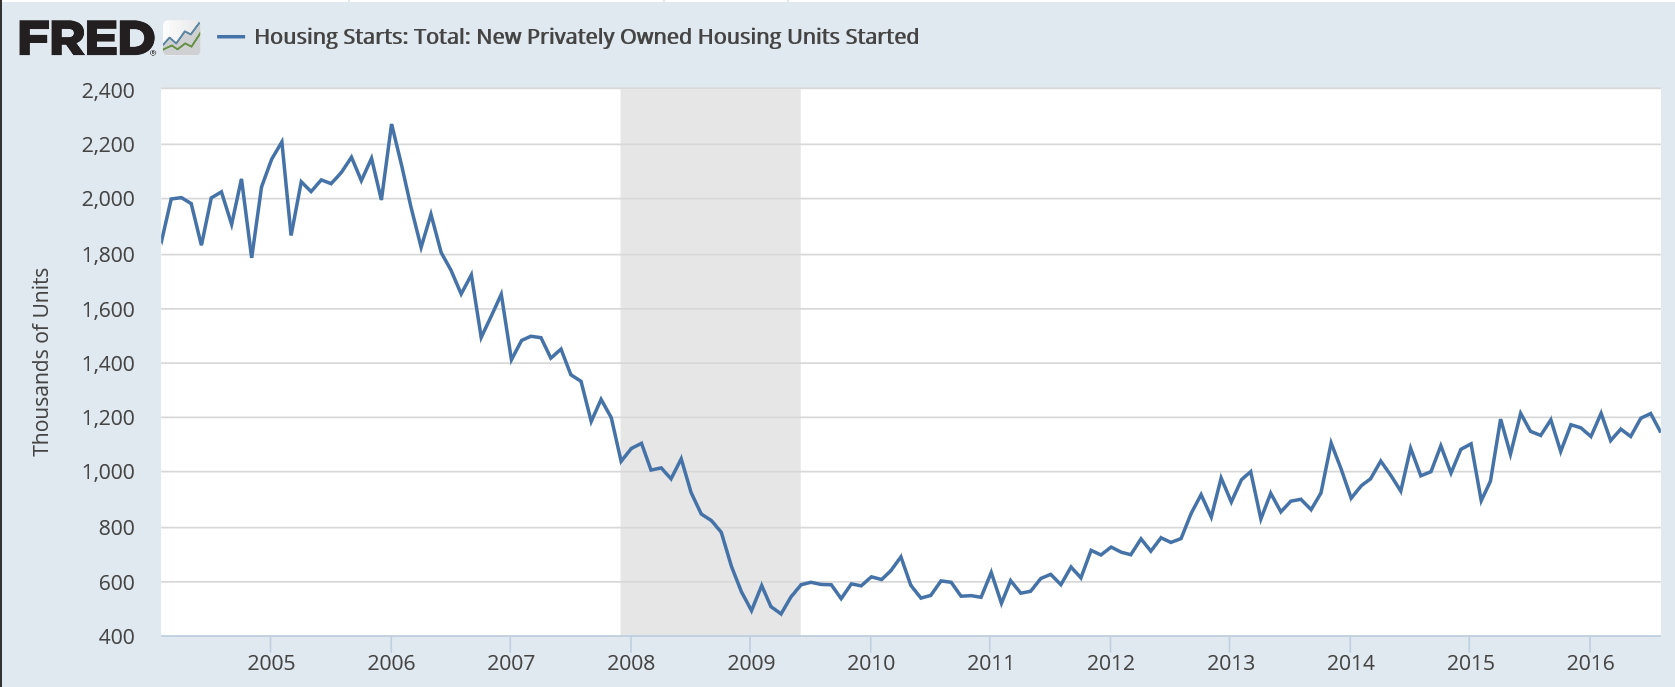
Details show special weakness for building materials and garden equipment, down 1.4 percent for what is also a second straight decline. This specific reading will lower estimates for the residential investment component of the third quarter GDP report. Non-store retailers, which were flying high in prior months, fell 0.3 percent to underscore the month’s disappointment. Motor vehicles fell 0.9 percent in the month though this does follow a 1.7 percent gain in July.

This report puts the backs of the policy hawks at the Fed to the wall, confirming other signs that the third quarter may not prove that strong after all.

91502
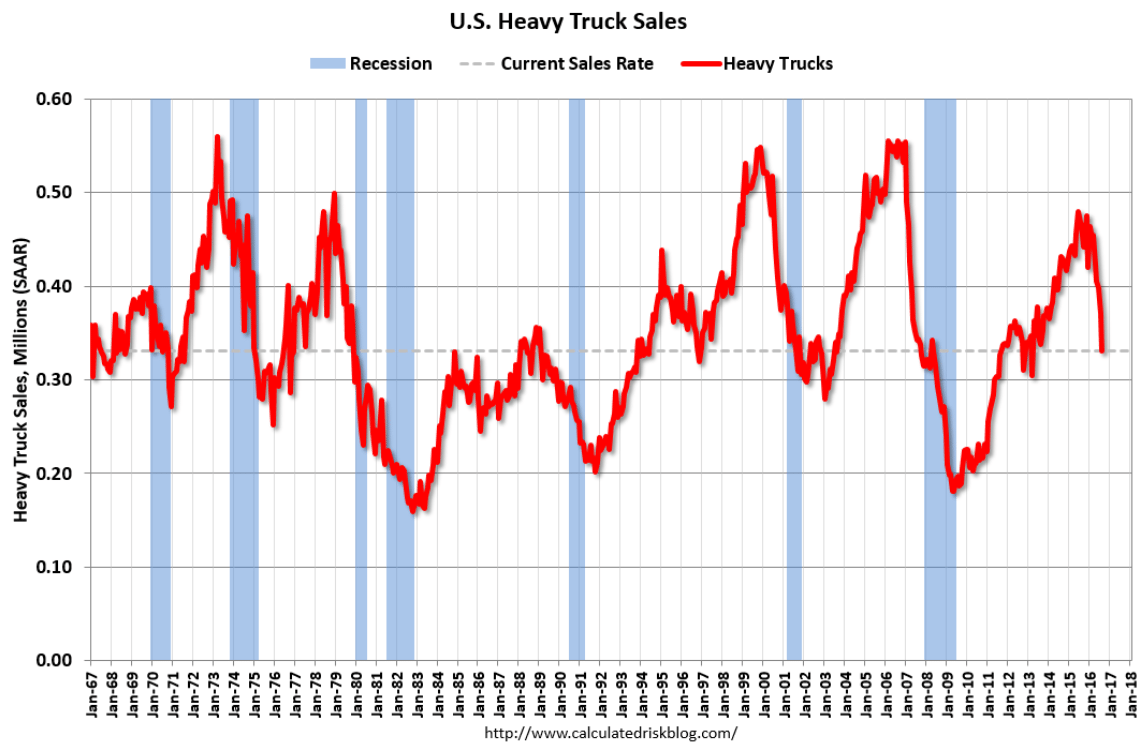
Industrial production tells much the same story. And watch for auto production to decline next month in line with falling sales:
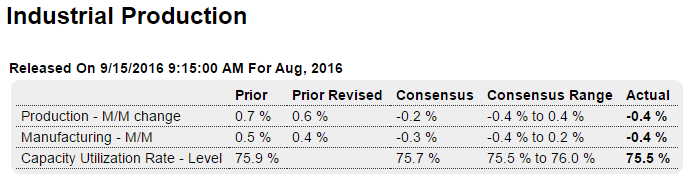
91503

Highlights

There was some life in the factory sector during July but it proved brief, at least for production. Held down by a 0.4 percent decline in the manufacturing component, industrial production also fell 0.4 percent in data for August. But motor vehicles continue to be a plus in the report, rising 0.5 percent and offsetting a 0.5 percent decline in hi-tech production.

And mining is an increasing plus in the report, emerging from deep weakness with a second straight gain and a solid one at plus 1.0 percent. Utility production, which had up in prior months, fell back 1.4 percent in August. Total capacity utilization edged 4 tenths lower to 75.5 percent.

This report isn’t as weak as the headline readings suggest but, given weakness in other data including this morning’s Philly Fed and Empire State reports, won’t build much confidence that the factory sector will contribute much to the nation’s third-quarter growth.

91504
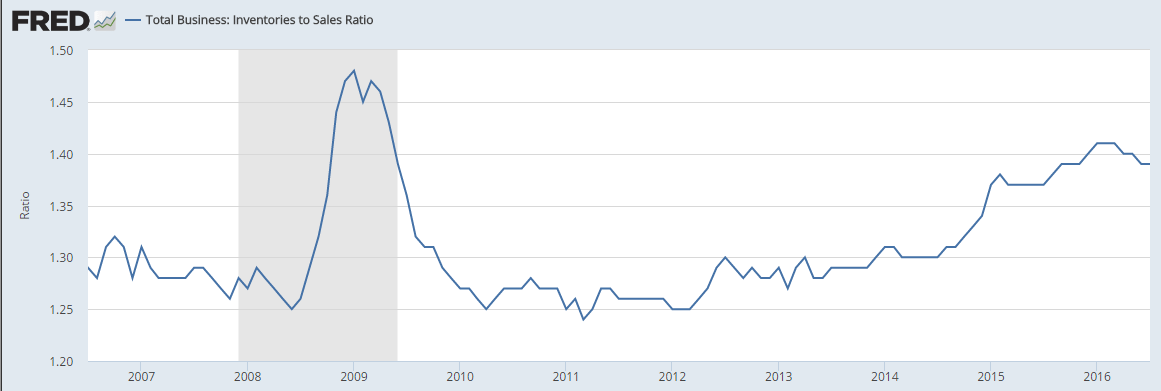
So far the expected boost to GDP from inventory building isn’t happening. Probably because, as previously discussed, sales are falling just about as fast as inventories, as the inventory to sales ratio remains elevated:
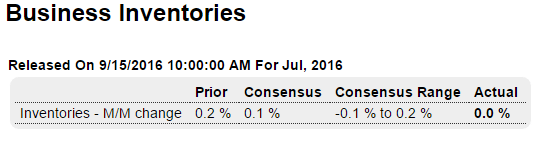
91505

Highlights

Inventories were unchanged in lagging data for July while sales retreated 0.2 percent. The stock-to-sales ratio was unchanged at 1.39. Retail inventories fell 0.3 percent with auto inventories down 0.2 percent. Wholesale inventories were unchanged in July while inventories at manufacturers, a sector where demand is soft, edged up 0.1 percent.

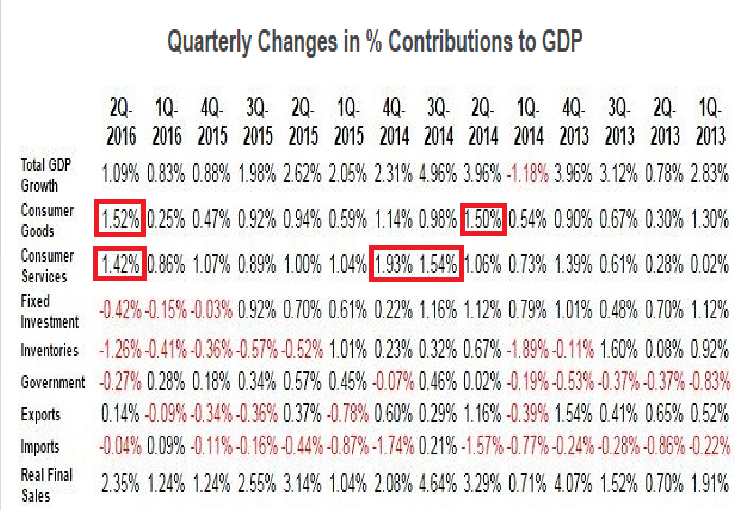
An outright drop in inventory investment subtracted almost 1.3 percentage points from second quarter GDP growth — the largest drag in more than two years. Inventories have weighed on GDP growth since the second quarter of 2015. Expectations are for inventory accumulation to rebound in the third quarter adding to GDP growth.
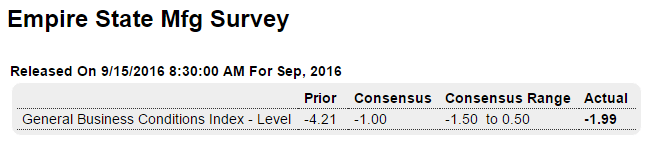
91506

91507

Highlights

The Empire State report, like the bulk of this morning’s Philly Fed report, points to continuing trouble for a factory sector that is being held down by weakness in exports and weakness in business investment. September’s headline came in at minus 1.99 for a second straight contractionary reading. New orders are even more negative at minus 7.45 with unfilled orders at minus 11.61. Employment is in deep contraction, at minus 14.29, as is the workweek at minus 11.61 (same as unfilled orders). Input costs do show some pressure but not selling prices which are flat. Watch later this morning for industrial production which will cover the month of August.

In this particular survey the headline number doesn’t add up to the individual categories:
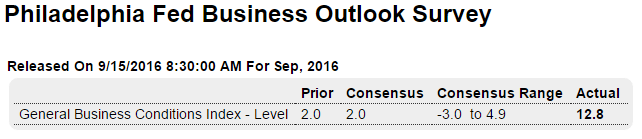
91508

Highlights

The headline and the details of the Philly Fed report continue to take their own paths, once again showing strength at the headline level, at plus 12.8 in September, and weakness elsewhere. New orders did move into the plus column, to 1.4 vs August’s minus 7.2, but the gain is marginal. And unfilled orders remain very weak at minus 10.8. Shipments are in contraction this month, at minus 8.8, with employment at minus 5.3. Price data show some pressure for inputs but less for selling prices. This report, outside the headline, matches the weakness of the Empire State also released this morning. The nation’s factory sector seems to be dead in the water.

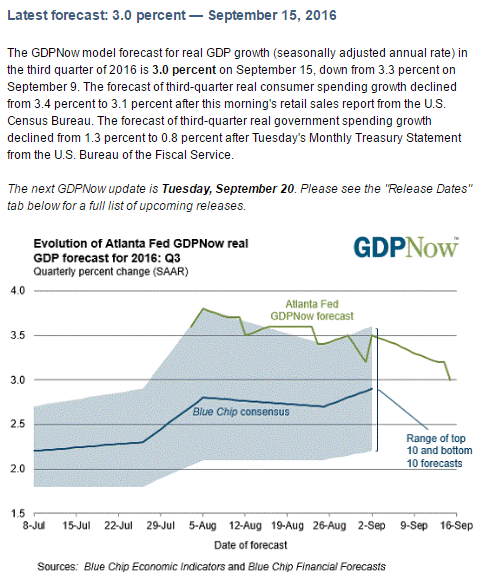
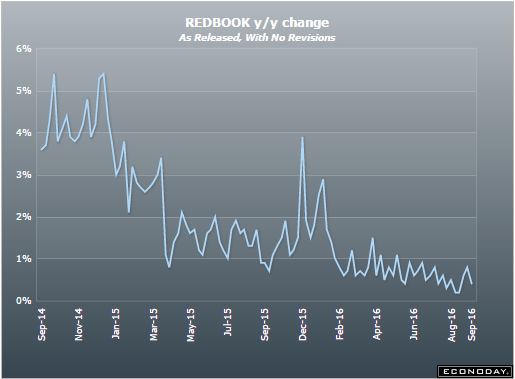
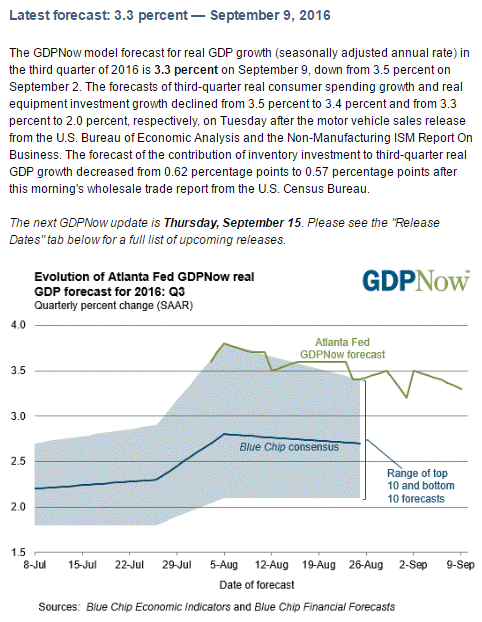
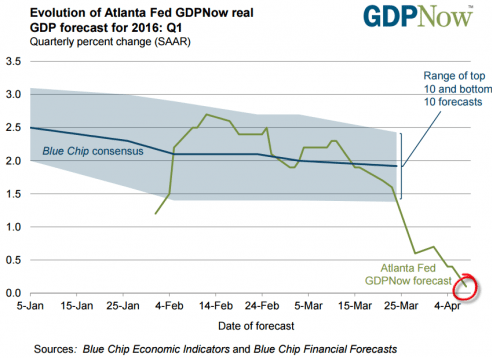
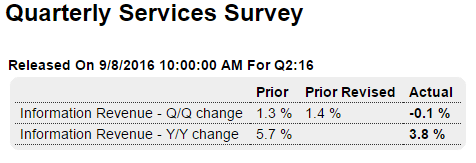
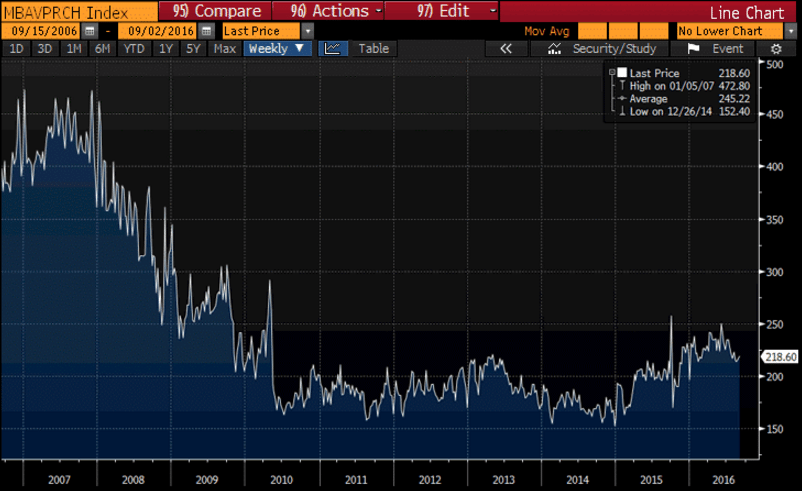
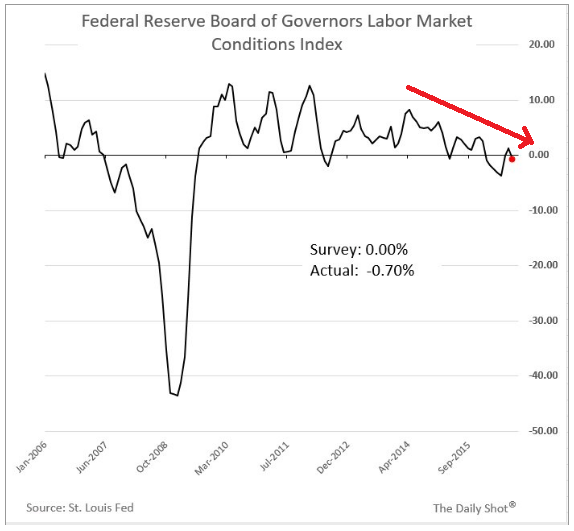
Working it’s way lower as actual data is released, as previously discussed:

91509

Bank loans, Profits, Heavy truck sales

91201

Decline in Profits Slows

By Stephen Grocer

Sept 12 (WSJ) — Analysts expect S&P 500 companies to report that revenue grew by 2.6% in the third quarter from the year-earlier period, according to FactSet. That would end a six-quarter period of sales contraction. Importantly, sales estimates for S&P 500 companies improved slightly since the third quarter began and companies began reporting second-quarter earnings. On June 30, analysts expected revenue to increase 2.5%, according to FactSet. Typically, the trend is toward worsening sales expectations as the quarter progresses. Analysts are still estimating companies in the S&P 500 will report a 2% decline in earnings for this quarter.

91202

Atlanta Fed and GDP commentary

As previously discussed, this ‘nowcast’ is working its way lower as more data is released, much like it did last quarter. Still to come are weaker retail sales due to weakening car sales, weaker residential investment due to weakening housing permits, more inventory reductions due to weaker sales, and generally weaker consumption as employment growth continues to decelerate. And I also suspect the trade deficit to resume it’s climb as exports continue to weaken and the import bill increases:
90901
Note the progression of the q1 and q2 nowcasts:

90902

90903
Rick Davis commentary on the Q2 GDP report:

  • As mentioned above, real per-capita annual disposable income was revised upward $101 in this report (and is now up $151 from the prior quarter), and the household savings rates was also revised upward. Although the household savings rate was revised upward in this report, it is still down from the prior quarter — and most of the increased quarter-to-quarter consumer spending came from that decreased savings rate. It remains important to keep this line item in perspective. Real per-capita annual disposable income is up only +6.32% in aggregate since the second quarter of 2008 — a meager annualized +0.77% growth rate over the past 32 quarters.
    1. The key items in this report:
  • All things not consumer either weakened or remained in contraction.
  • Consumer spending growth improved yet again, with most of that coming from savings.
  • All of the reported growth disappears when a third party deflator (the BLS CPI-U) is applied to the data.
  • Note that the consumption numbers outlined tend to revert:

    90904
    Consumption, like most everything else, has been decelerating ever since the collapse in oil related capital expenditures at the end of 2014, and is already very low vs prior cycles. And, at least so far, I have no reason to expect this general deceleration not to continue:

    90905

    JOLTS, German industrial production, Services Survey, Jobs revisions, Consumer credit

    Interesting how it peaked as oil capex collapsed
    ;)

    90804

    90805

    90806

    Highlights

    Information revenue fell 0.1 percent in the second quarter compared to the first quarter. Information revenue in the first quarter is revised 1 tenth higher to plus 1.4 percent. Year-on-year, information revenue rose 3.8 percent in the second quarter vs an unrevised 5.7 percent gain in the first quarter.

    This is the beginning of the ‘revisions’ previously discussed. The govt. estimates jobs created by net new businesses each month (called the birth/death model) and then makes revisions as they get hard data. And during ‘slow downs’ the revisions tend to be downward:

    BLS released the initial estimate of the annual benchmark revision to payrolls that will be released in February. They anticipate that payrolls in March 2016 will be revised down 150,000, or 0.1% The annual benchmark revision is to the level of payrolls in the benchmark month with backward revisions over the prior year. So a 150,000 downward adjustment would mean payroll growth from April 2015 through March 2016 being 12,500 a month lower. That would continue a run of only small benchmark revisions in recent years:

    90807

    90808
    With car sales fading next one will be lower still on a year over year basis. And note the deceleration since oil capex peaked:

    90809

    Highlights

    Consumer credit is up strongly at the headline level but there’s slowing in the revolving credit component which is where credit cards are tracked. Total credit rose $17.7 billion in July, up from an upwardly revised $14.5 billion in June. Revolving credit, however, rose only $2.8 billion in the month, down from June’s $9.2 billion. Reluctance to use credit cards may be a plus for long-term consumer health but it’s a short-term negative for the nation’s retailers and service providers. Non-revolving credit continues to post very strong gains, up $14.9 billion in July and reflecting strength in vehicle financing and student loans which are tracked in this component.

    90810

    Mtg purchase applications, Fed’s Williams, EU, Fed Labor mkt index, PMI services index

    Look at how many more new applications there used to be when rates were double where they are now:

    90801
    Just an fyi, his logic makes no sense to me whatsoever:

    Fed’s Williams says U.S. economy in good shape, wants rate hike (Reuters) It “makes sense to get back to a pace of gradual rate increases, preferably sooner rather than later,” San Francisco Fed President John Williams said. Targeting low inflation, as the Fed and many other central banks currently do, simply will not work well in a world where economic growth and interest rates are likely to be persistently lower than they were in the era before the Great Recession, he said. A low inflation target, he said, gives the Fed too small a buffer to fend off future shocks. The Fed could raise its 2 percent inflation target to 3 percent or even 4 percent, or shift away from inflation targeting altogether and instead target a nominal level of national economic output, Williams said. “Time is not on our side,” Williams said.

    One day it seems ok, next day not so good:

    German industry output posts steepest drop in almost two years (Reuters) German industrial production unexpectedly fell in July. Industrial output fell by 1.5 percent on the month, data from the Economy Ministry showed. “Companies in the industry sector continue to adopt a wait and see approach because of sluggishness in the global export markets,” the Economy Ministry said in a statement. A 1.8 percent rise in output in the construction sector and an surge of 2.6 percent in energy output were not enough to offset a 2.3 percent fall in manufacturing. The June reading was revised up to a rise of 1.1 percent from a previously reported rise of 0.8 percent.

    Eurozone Investment Spending Stalls in Second Quarter (WSJ) Eurostat confirmed that in the three months to June, the combined GDP of the eurozone’s 19 members increased by 0.3% from the first quarter of 2016, and by 1.6% from the second quarter of 2015. The statistics agency also released details of the pattern of growth for the first time, and they showed that investment spending was unchanged on the quarter, having grown by 0.4% in the three months to March, and 1.4% in the three months to December. Consumer spending increased by just 0.2% in the three months to June, while government spending rose by just 0.1%, having jumped by 0.6% in each of the two previous quarters.

    U.K. Manufacturing Shrinks Most in a Year After Brexit Vote (Bloomberg) Output fell 0.9 percent from June, far exceeding the 0.3 percent decline forecast in a Bloomberg survey, Office for National Statistics data show. Total industrial production rose 0.1 percent, thanks to a jump in oil and gas output. Nine of 13 manufacturing sectors saw output decline in July, led by pharmaceuticals and transport equipment, the ONS said. Overall production in July was boosted by a 5.6 percent increase in oil and gas extraction along with higher output at utilities. Industrial production rose 2.1 percent from a year earlier, with manufacturing gaining 0.8 percent.

    90802

    90803

    Highlights

    Growth in Markit Economic’s U.S. service sector sample remains limited, at 51.0 for the final August reading vs 50.9 for the August flash and 51.4 for July. New orders slowed in the month as did business activity with employment gains slowing to the weakest level since December 2014. The report continues to cite weakness in client demand and uncertainty over the presidential election as negatives. Price readings are muted. A positive, however, is relative strength in the 12-month outlook which continues to rise from a survey low in June. The results underscore the risk of second-half weakness for the bulk of the U.S. economy, as likewise indicated by yesterday’s ISM non-manufacturing report where headline growth came in at a cycle low.