The theme of trumped up expectations and actual data heading south continues:
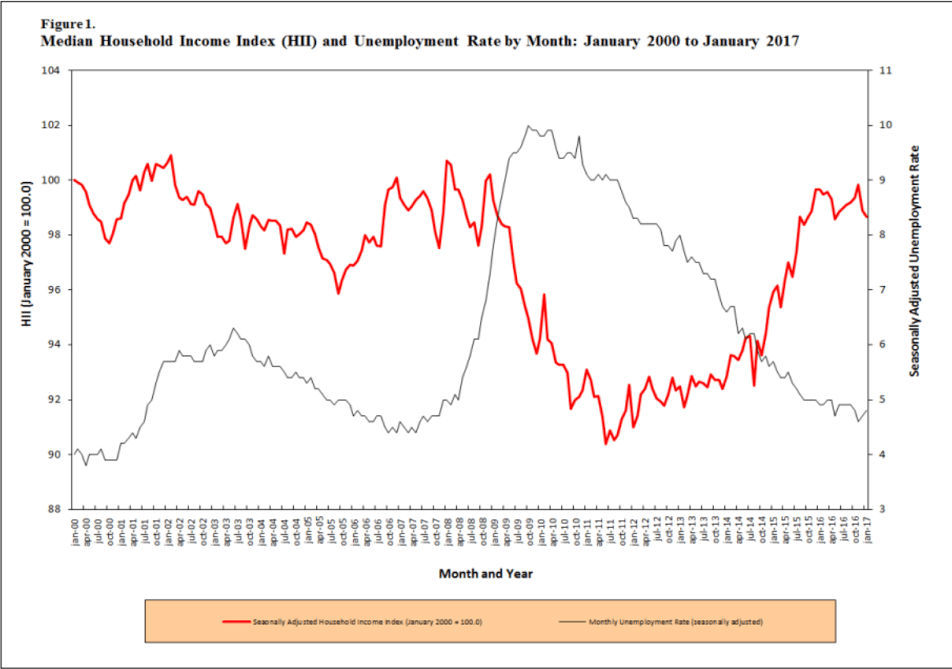
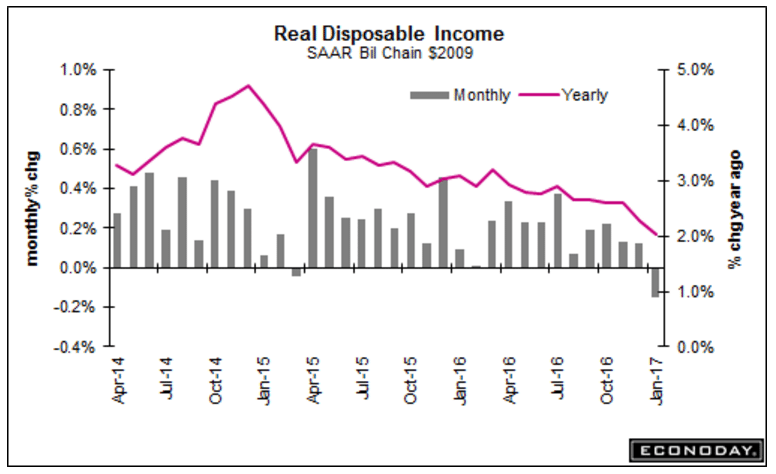
Note the real disposable personal income chart- not good!!

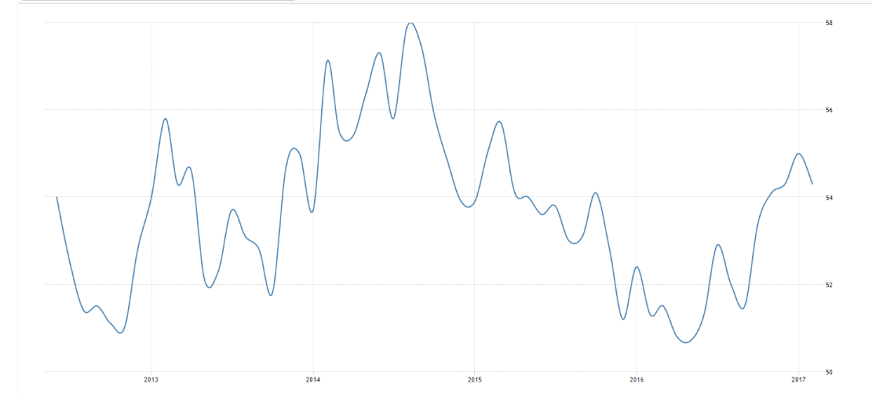
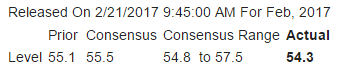
Highlights
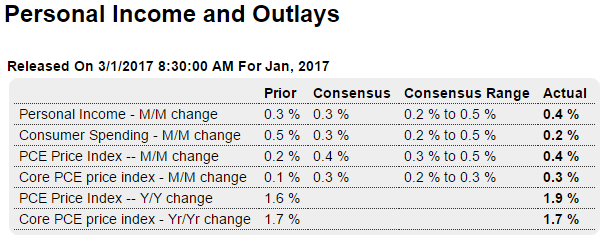
Inflation is nearly at the Fed’s 2.0 percent target, up a sharp 3 tenths to 1.9 percent for the PCE price index which is the strongest rate since April 2012. The monthly gain, reflecting rising energy costs, rose an outsized and higher-than-expected 0.4 percent for the highest reading since February 2013. But the core, which excludes food and also energy, held steady at 1.7 percent though the monthly rate for this reading did rise 0.3 percent which is the largest increase since January last year.
Turning to spending and income, personal consumption expenditures could muster only a 0.2 percent gain, 1 tenth below the Econoday consensus in a marginal gain that belies the enormous strength underway in consumer confidence. And when adjusted for inflation, spending fell 0.3 percent for the largest drop since September 2009.
But income is solid, at a monthly 0.4 percent with the wages & salaries component also rising 0.4 percent. The savings rate steadied in the month, up 1 tenth to 5.5 percent.
The PCE price index will put the pressure on the Fed to raise rates at the mid-month policy meeting. Though it’s not quite at target, its clear upward trajectory makes a successful breach all but certain. Turning back to spending, January’s weak opening points to downward revisions for first-quarter GDP estimates.
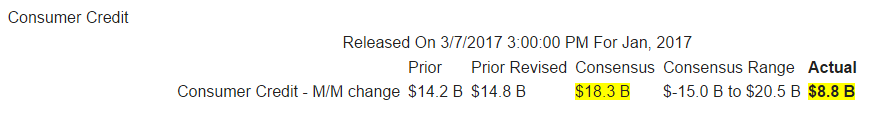
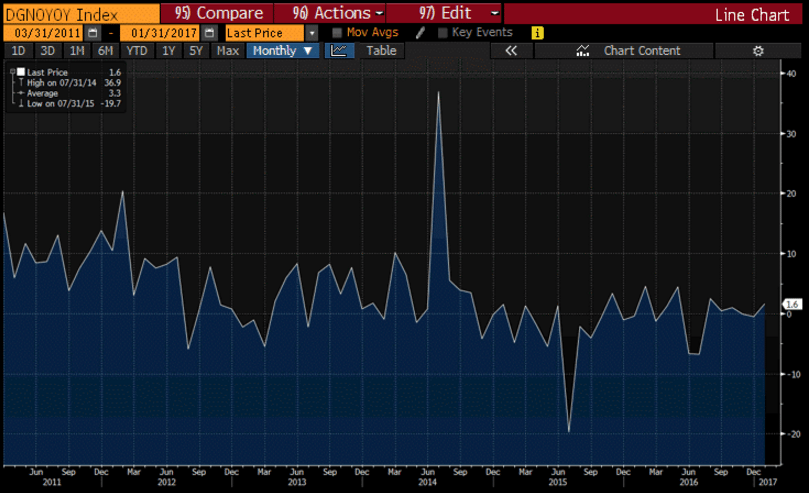
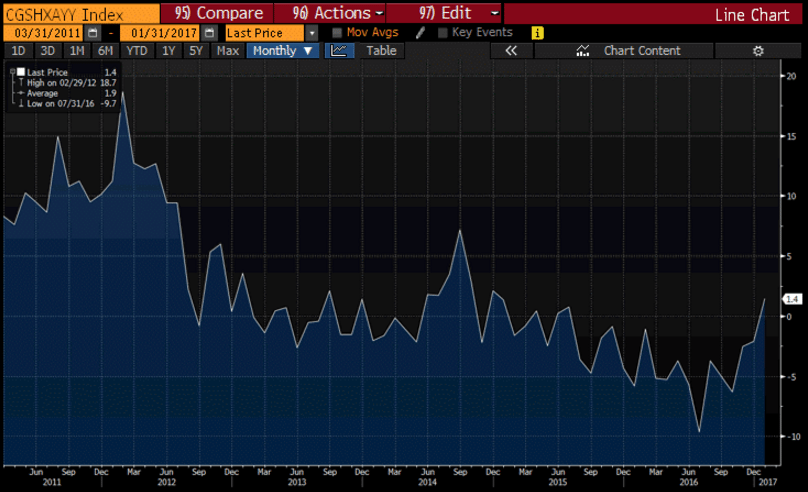
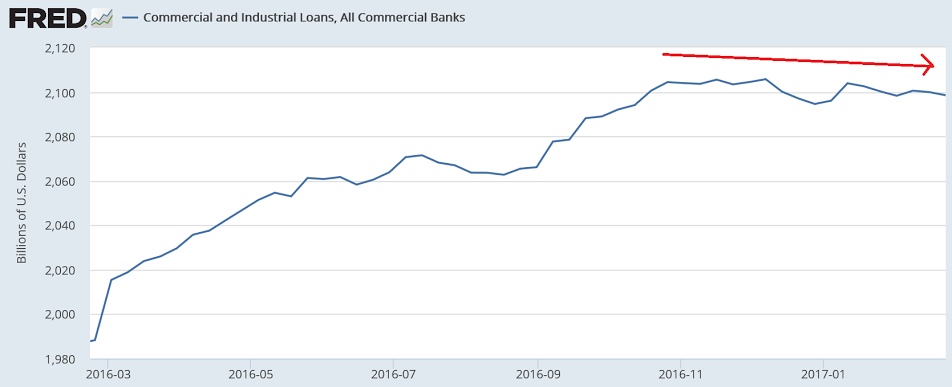
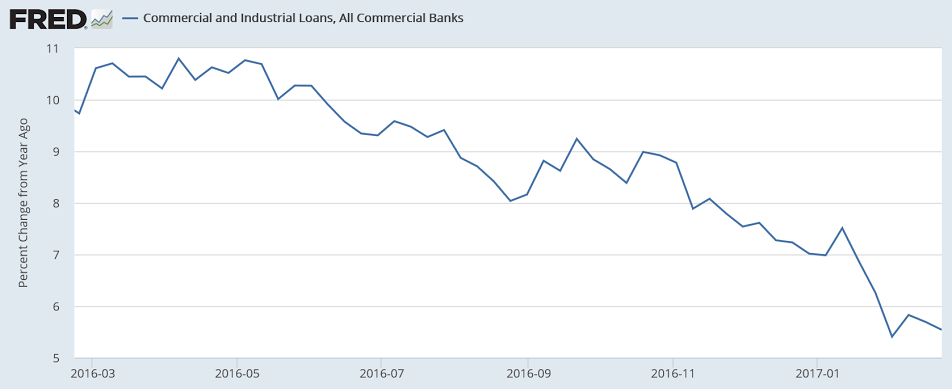
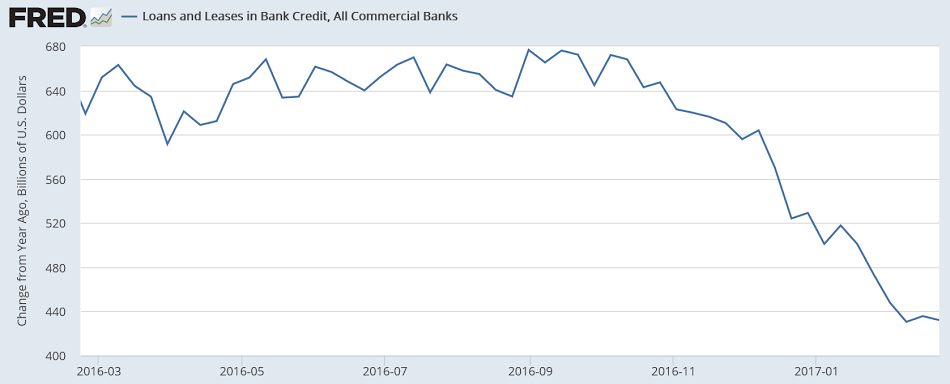
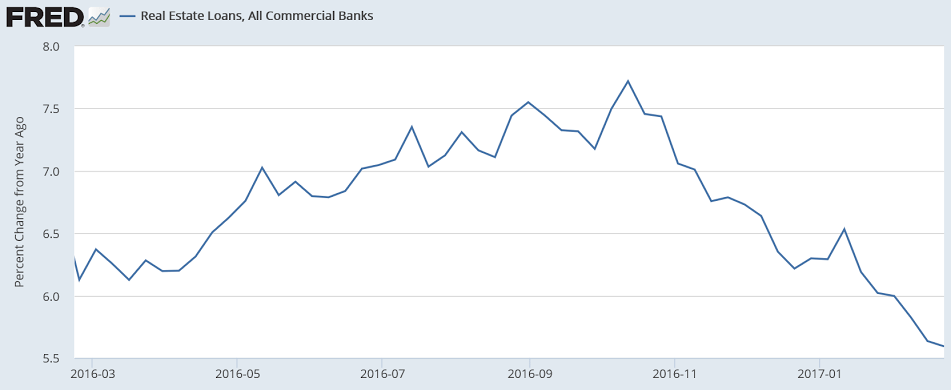
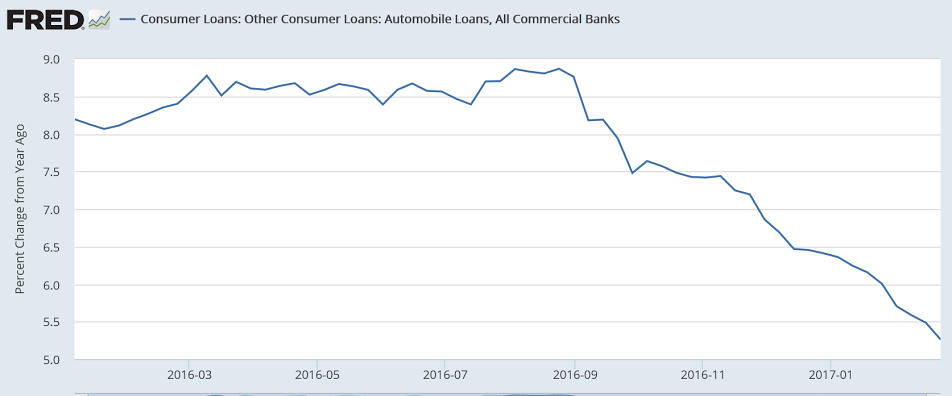
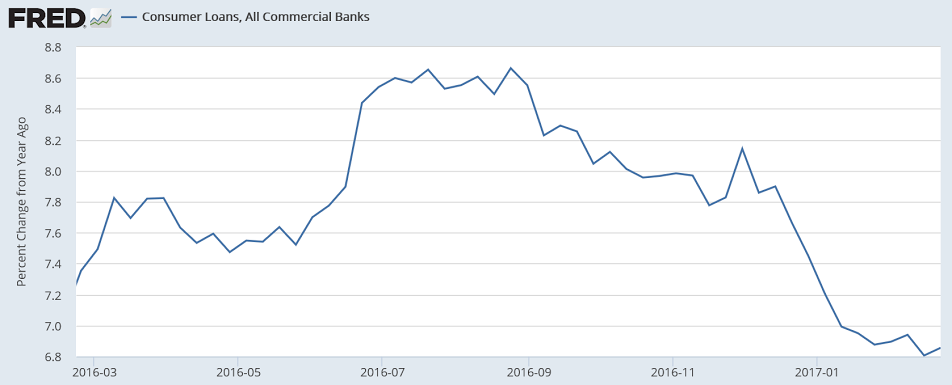
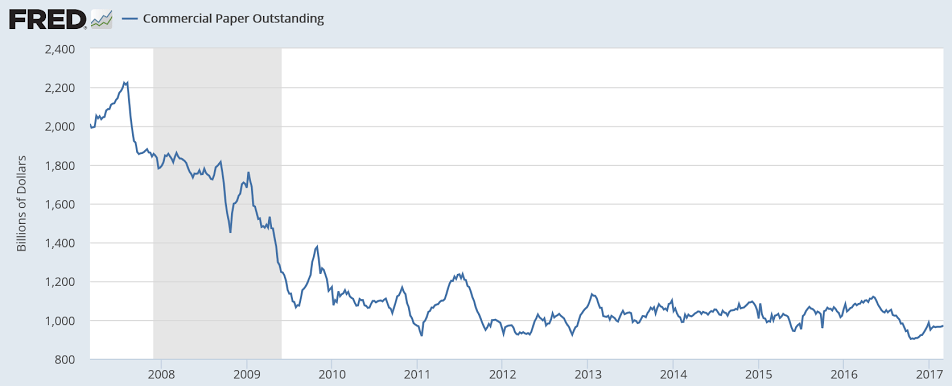
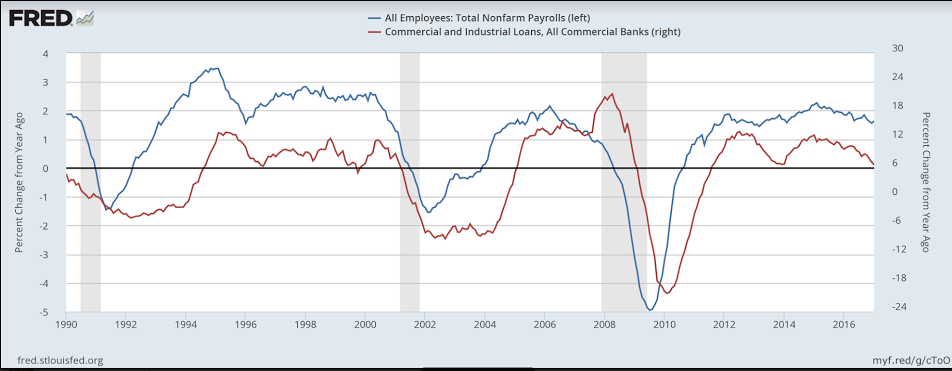
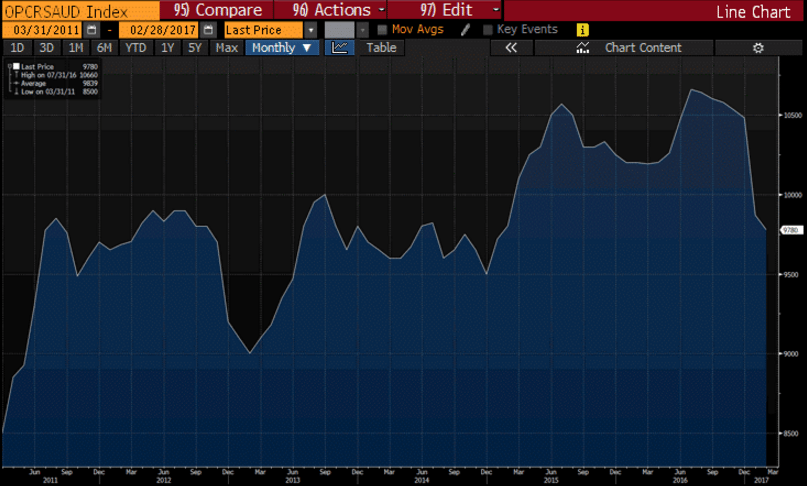
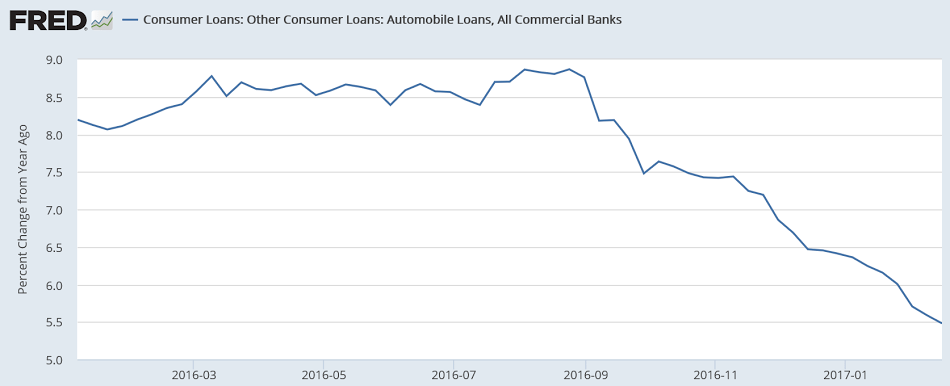
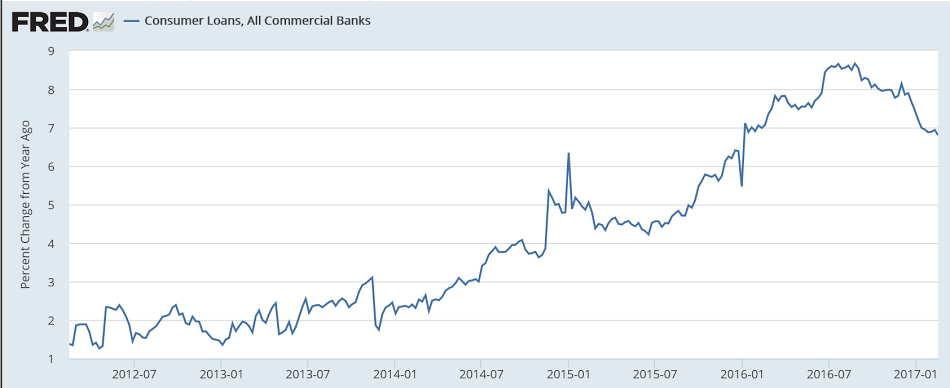
Net income is decelerating in line with previously discussed decelerating credit aggregates:
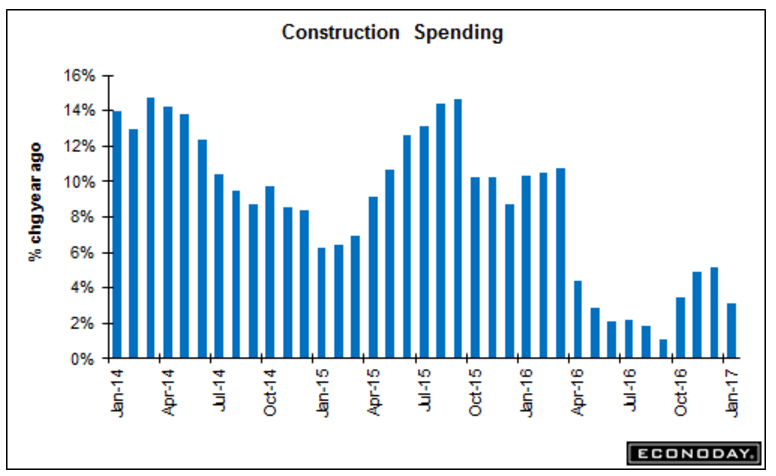
Yes, the weakness was in public spending, but it’s still spending and GDP etc. and hints at the possibility that public construction spending was a bit pumped up in front of the election, as per the chart?
;)
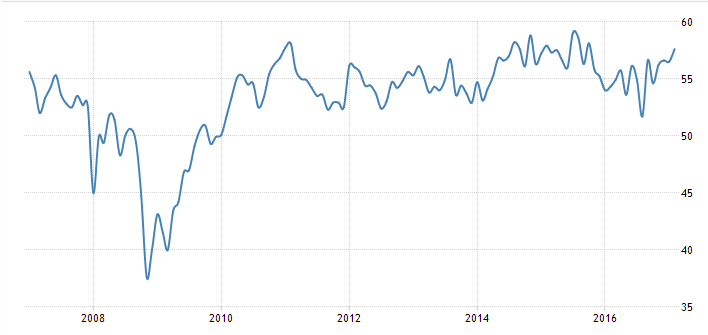
Highlights
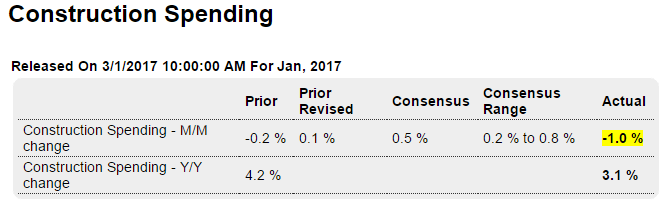
Construction spending fell a sharp 1.0 percent in January but the weakness is in public spending, not residential spending where gains are substantial. Spending on new single-family homes rose 1.1 percent in the month with multi-family spending up 2.2 percent. Year-on-year, single-family spending continues to improve with a 2.3 percent gain while the multi-family category remains very strong at 9.0 percent.
Now the weakness in the report. Public spending posted wide declines including the Federal component, down 7.4 percent in the month, and the state & local component, down 4.8 percent. Totals on educational buildings and highways & streets were all weak.
Private spending on nonresidential building was unchanged in the month with gains for power and manufacturing offsetting declines for transportation, office buildings as well as commercial construction.
But public spending looks to get a boost down the road with new fiscal initiatives while the strength of the report, residential investment, is very solid and looks to improve further given gains in related permits. The housing sector has gotten off to a bumpy start this year though this report is one of strength.
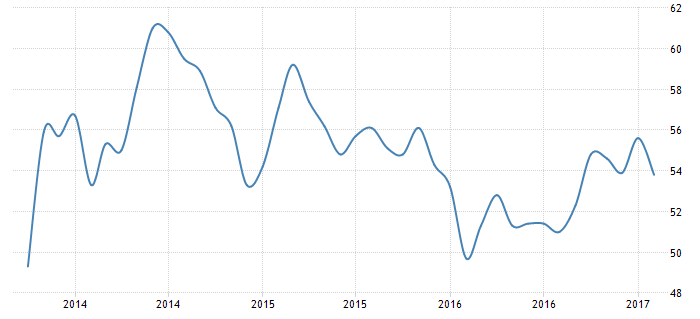
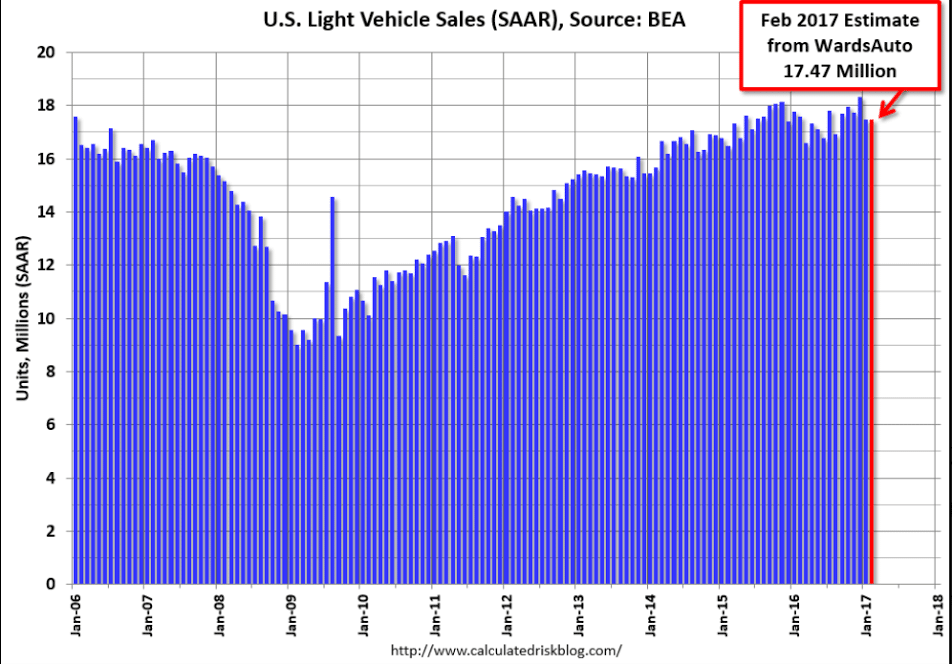
Vehicle sales looking soft again:
by Bill McBride on 3/01/2017 03:10:00 PM
Based on a preliminary estimate from WardsAuto, light vehicle sales were at a 17.47 million SAAR in February.
That is down about 1% from February 2016, and unchanged from last month.
Read more at http://www.calculatedriskblog.com/#pBORsUyEDpm03RrU.99
Released yesterday:
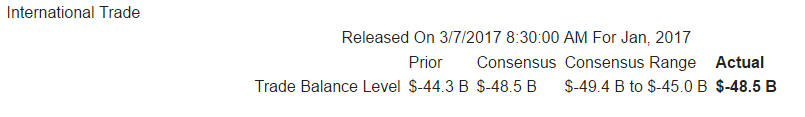
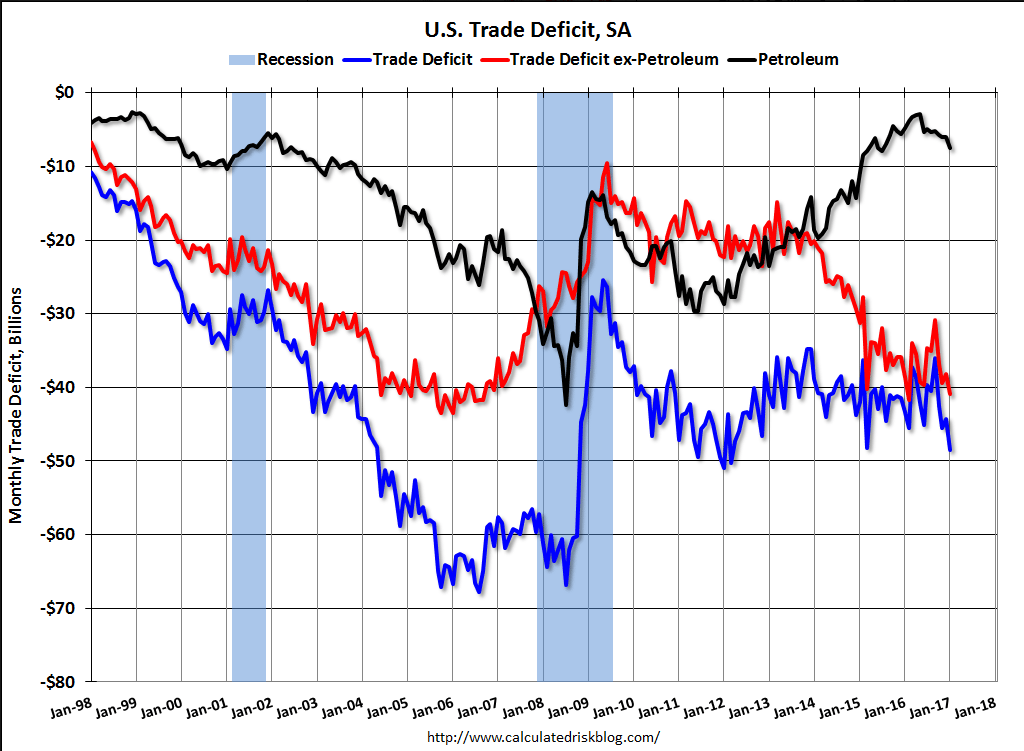
Trade deficit higher than expected, equals lower GDP estimates:
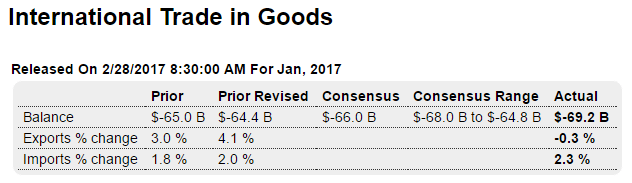
Highlights
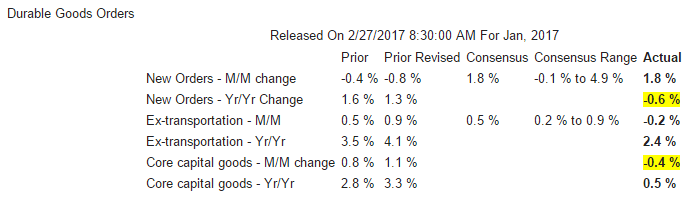
The nation’s goods gap widened sharply in January, to $69.2 billion which is well beyond December’s revised $64.4 billion and outside Econoday’s low estimate. Imports of consumer goods and also vehicles are once again the source of the trade mismatch, surging 4.8 percent and 2.9 percent respectively and helping to lift total imports by 2.3 percent. Exports fell 0.3 percent with weakness in capital goods, down a very sharp 4.6 percent, the unwanted standout feature, one that may deepen in the months ahead based on yesterday’s durable goods report where related orders proved weak. This report will be bringing down early first-quarter GDP estimates.
Not revised up as expected, and q1 at risk as well as we’ve already seen trade and inventories deteriorating:

Highlights
The second revision to fourth-quarter GDP shows little change, actually no change at the headline level which remains at 1.9 percent annualized growth. But good news comes from consumer spending which gets a 5 tenths of a percentage point upgrade to a 3.0 percent rate and a 2.1 percent contribution. Durables, reflecting vehicle sales, are the standout at an 11.5 percent rate (nondurables at plus 2.8 percent and services at plus 1.8 percent). Nonresidential fixed investment gets a small downgrade to a 0.2 percent contribution with residential investment also getting a small downgrade but still solid at a 0.4 percent contribution.
Inventories show little change in the revision, rising what may prove an unwanted $46.2 billion and contributing 9 tenths of a percentage point or nearly half of the quarter’s total growth. Net exports are unchanged, subtracting 1.7 percentage points as exports fell sharply and imports rose even more sharply. Government purchases get a downgrade, contributing only a small fraction to the quarter’s GDP.
The fourth quarter was mixed with negatives led by net exports and the questionable inventory build. But the positives are clear, a consumer that was spending and also investing in housing.