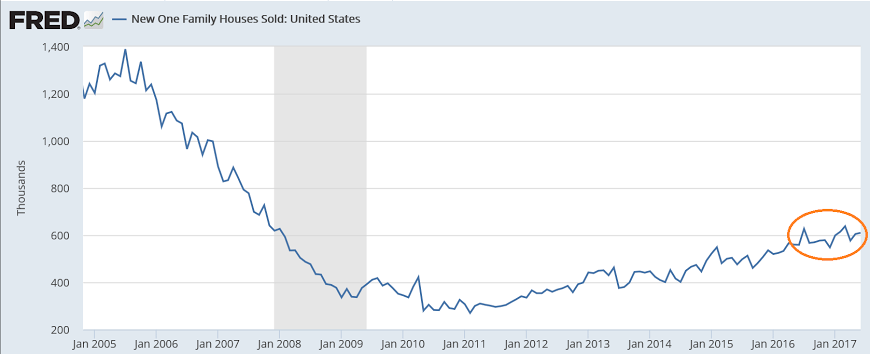
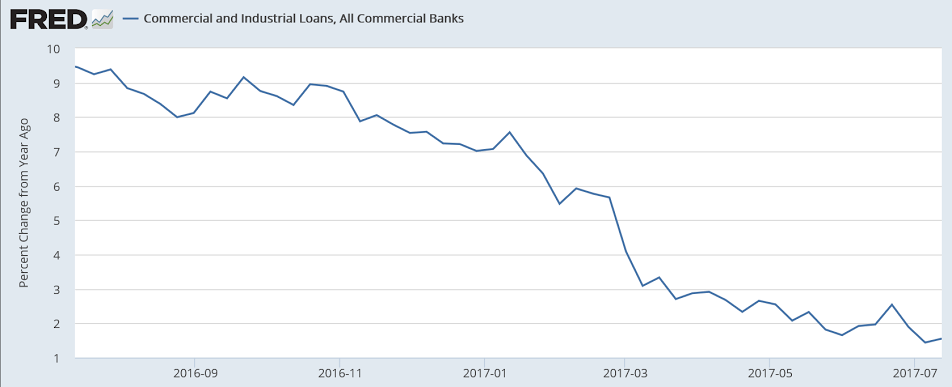
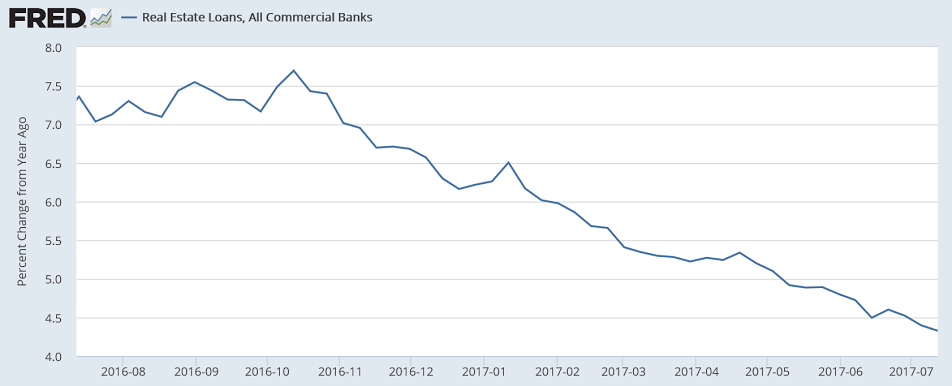
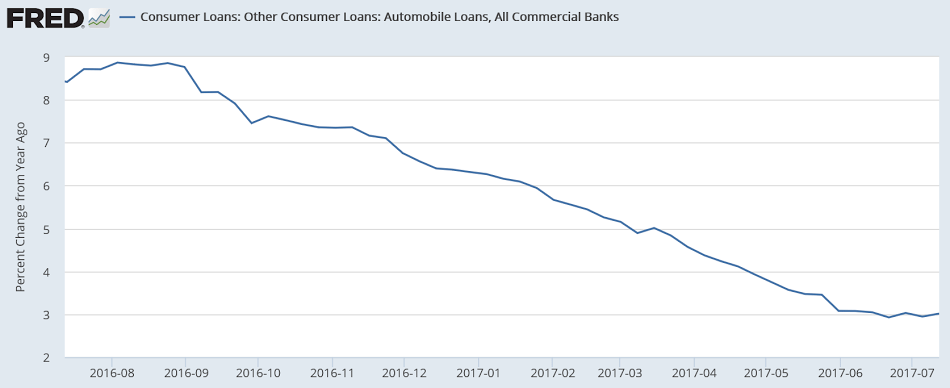
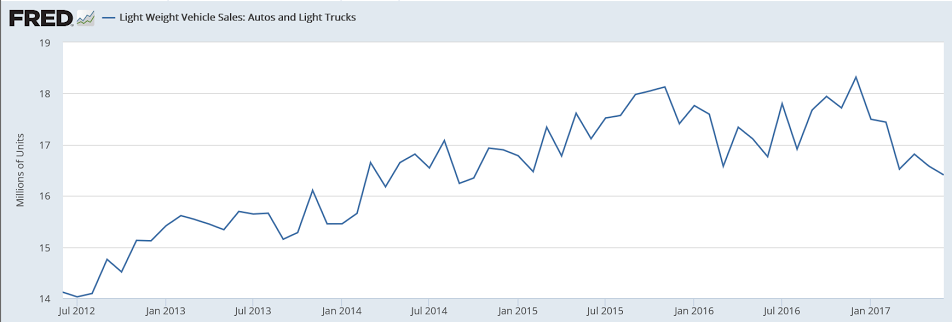
Up as expected though way down from initial forecasts as data deteriorated, and q1 was revised lower. More q2 data will be released over the next month when the first revision will be released. Consumer spending up vs prior quarter (but down year over year) even as consumer credit numbers decelerate, with ‘goods’ contributing over 1% to growth. Residential investment fell, in line with the deceleration in real estate lending, as did auto related spending, in line with decelerating auto related lending.
So with the decelerating lending reports somehow not seemingly reflecting a similar deceleration in total spending, there is either some other source of credit expansion I’m missing, or q2 will ultimately be revised a lot lower.
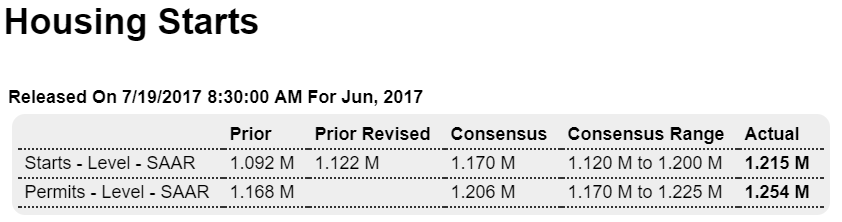
Highlights
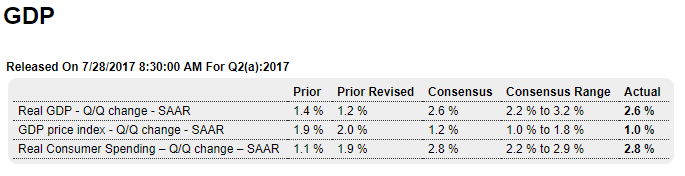
The second quarter was healthy, growing at an as-expected 2.6 percent annualized rate with the consumer spending component also healthy and as expected, at a 2.8 percent rate. Business investment, at 5.2 percent, was once again very strong and offset a bounce lower for residential investment which fell at a 6.8 percent rate. Inventories were slightly negative for the quarter while net exports improved and proved a slight positive. Government purchases added slightly to the quarter. Inflation was very weak, at only a 1.0 percent rate. The core is similar, at 1.1 percent and down from 2.4 percent in the first quarter.
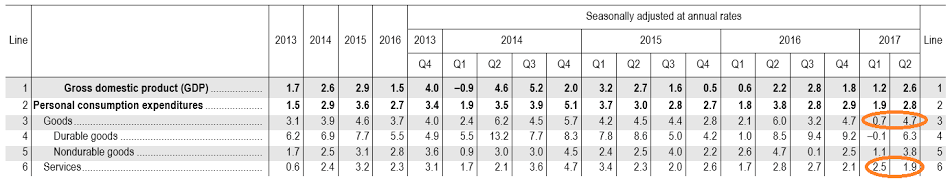
Turning back to consumer spending, durables were very strong at 6.3 percent despite the quarter’s weakness in vehicle sales. Nondurables rose 3.8 percent which is also strong and coming despite weakness in gasoline prices. Pulling down the consumer component was service spending, up a moderate 1.9 percent.
Benchmark revisions are included in the report, having little overall effect over the last 3 years but pulling down full-year 2016 slightly, by 1 tenth to 1.5 percent, and also the first-quarter by 2 tenths to 1.2 percent. There are no surprises in this report, one consistent with solid growth but also underscoring this year’s unexpected trouble for inflation.
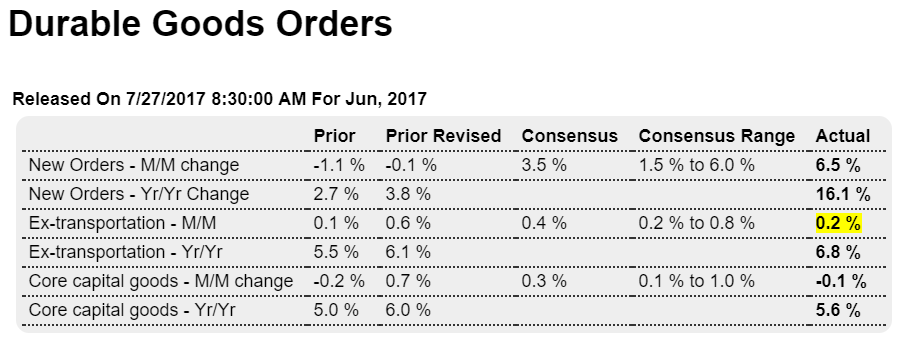
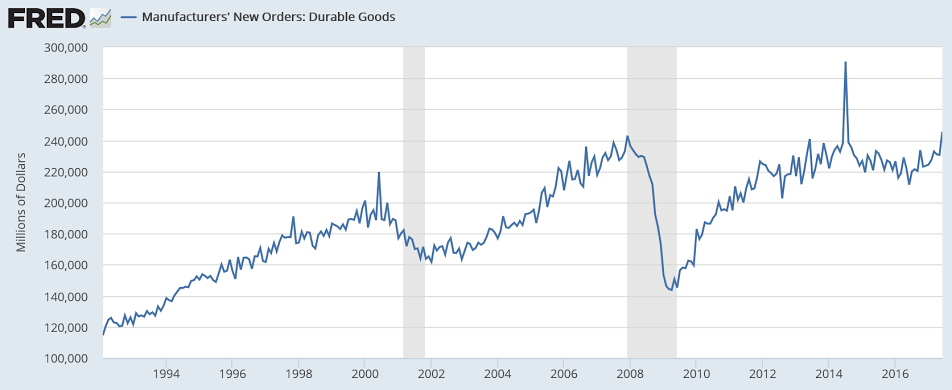
Large gain in ‘goods’ sales pushed up GDP by about 1% in this first release:
Personal Income (table 10)
Current-dollar personal income increased $118.9 billion in the second quarter, compared with an
increase of $217.6 billion in the first quarter (revised). The deceleration in personal income primarily
reflected decelerations in wages and salaries, in government social benefits, in nonfarm proprietors’
income, and in rental income, and downturns in personal interest income and in farm proprietors’
income. These movements were offset by an upturn in personal dividend income.
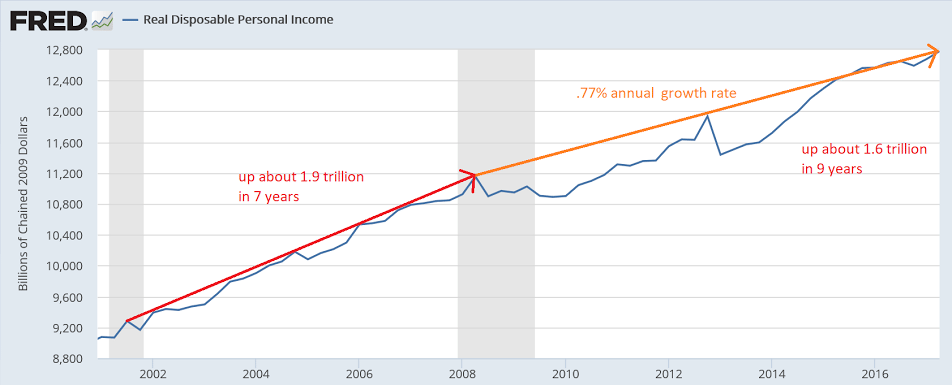
Disposable personal income increased $122.1 billion, or 3.5 percent, in the second quarter, compared
with an increase of $176.3 billion, or 5.1 percent, in the first quarter (revised). Real disposable personal
income increased 3.2 percent, compared with an increase of 2.8 percent.
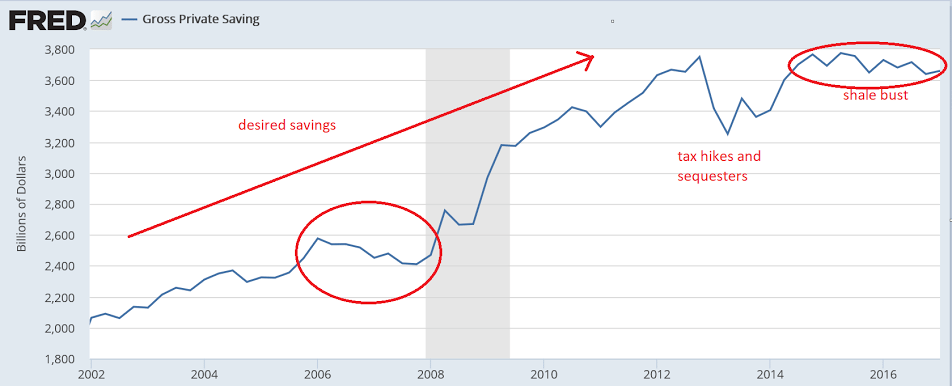
Personal saving was $546.8 billion in the second quarter, compared with $553.0 billion in the first
quarter (revised). The personal saving rate — personal saving as a percentage of disposable personal
income — was 3.8 percent in the second quarter, compared with 3.9 percent in the first.
These ares inflation adjusted and so are directly influenced by the deflator calculation.

From Morgan Stanley. Note comments about how some of the data is generally associated only with recessions. And I’m not so sure inventories will reverse, as retail sales, for example, have generally been decelerating:
Inventories subtracted fractionally from Q2 growth v. our +0.7pp expectation after cutting 1.5pp from Q1. In real dollar terms, inventory accumulation was close to zero in both Q1 and Q2, the lowest back-to-back quarters outside of recessions since 1986. Final sales (GDP ex inventories) gained 2.6% in Q2, better than our 2.4% forecast, and final private domestic demand (consumption and business and residential investment combined) grew 2.7%, matching our expectation.
Consumption picked up to 2.8% from an upwardly revised 1.9% in Q1 (previous surprising weakness in Q1 was largely smoothed out as seasonal factors were updated in annual revisions), business investment gained 5.2% on top of a 7.1% Q1 gain, residential investment fell 6.8% as supply-side restraints hurt after an 11.1% Q1 gain, and government spending rose 0.7% after a 0.6% drop, as federal spending rebounded to offset a further drag from state and local infrastructure investment. Within business investment, equipment was surprisingly strong, accelerating to 8.2% growth from 4.4% in Q1, turning higher after a 3.7% drop in 2016, one of the worst nonrecession years ever. The drilling rebound also continued, boosting mining investment to a 117% gain on top of 272% rise in Q1. Ex mining structures investment was weak dropping 9%, a third straight decline with more weakness to come based on our non-resi permits tracker. Intellectual property products investment also slowed on less robust growth in R&D investment largely.
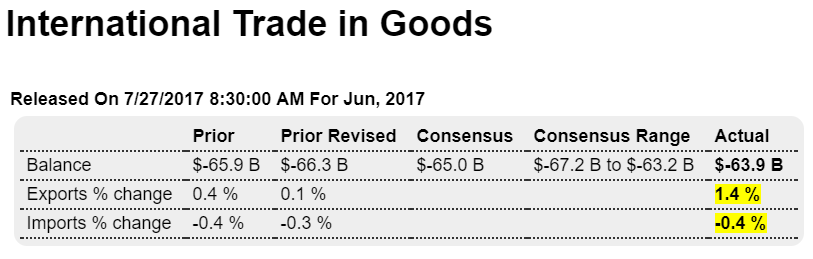
The synchronized global growth recovery that’s taken hold this year and a little bit of early impact of the weaker dollar (which would be expected to have a maximum impact one to two years out) helped boost exports to a 4.1% gain on top of a 7.3% rise in Q1, putting 2017 on pace for the best annual result since 2013. With imports up a more muted 2.1%, net exports added 0.2pp to GDP growth after also adding 0.2pp in Q1, a big improvement from persistent drags through 2014-16 that averaged -0.5pp a quarter.
Core PCE came in at 0.9% Q/Q annualized, a terrible result to be sure, but higher than the 0.7% implied by previously reported April and May monthly numbers and expectations for June based on the CPI and PPI reports. That should result in the year/year pace in June (which will be reported Monday) coming in at 1.5% instead of our previous expectation of 1.4%.
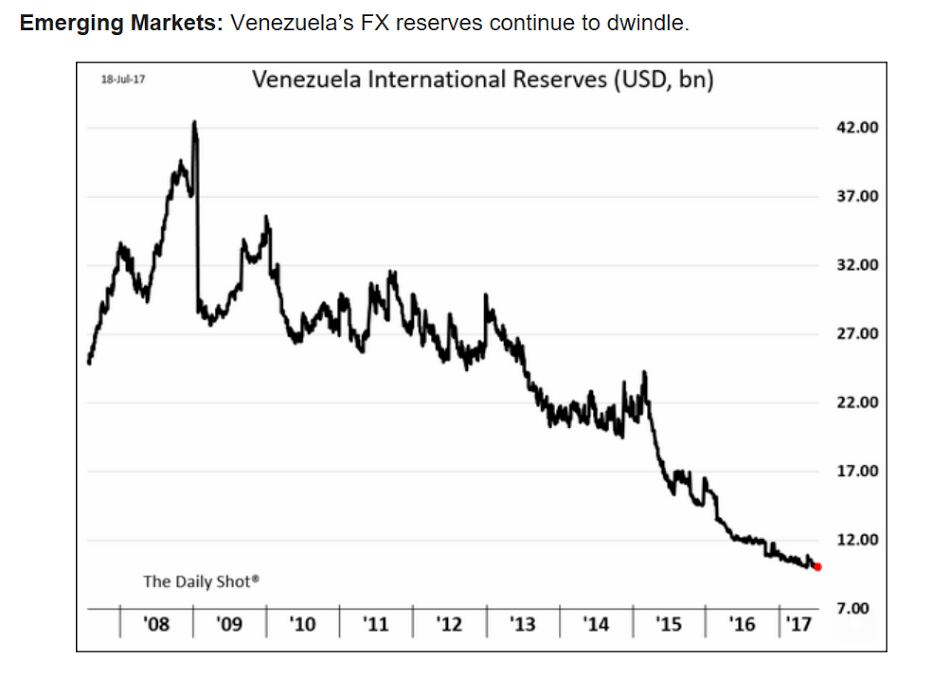
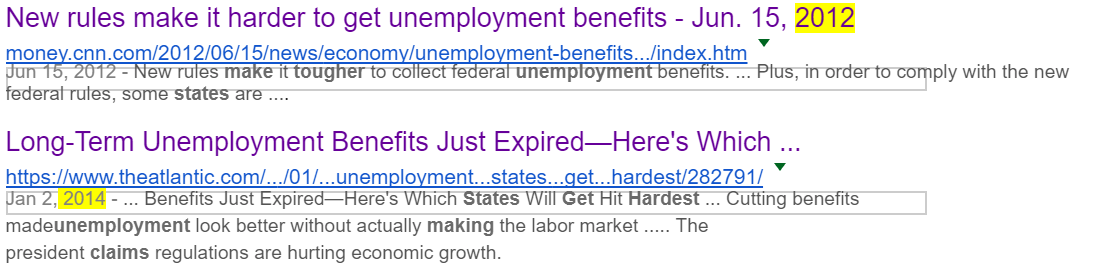
When savings desires can’t be met spending suffers and distressed voters respond:
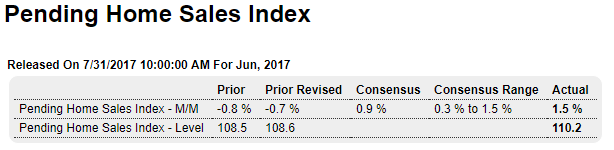
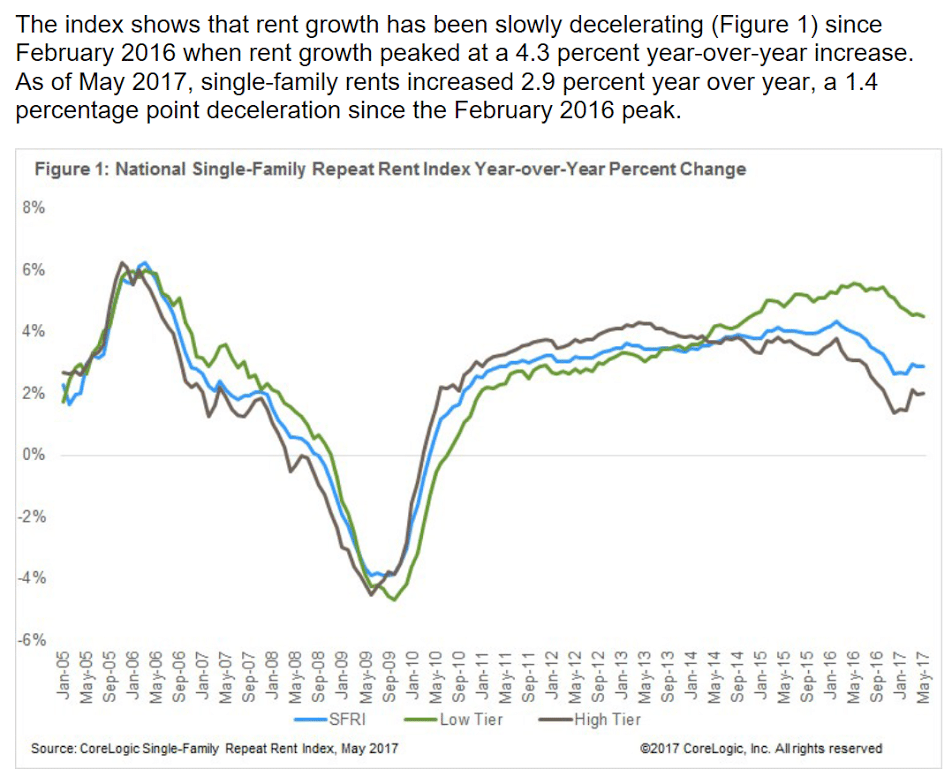
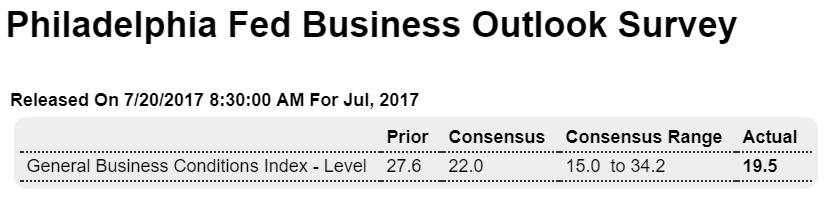
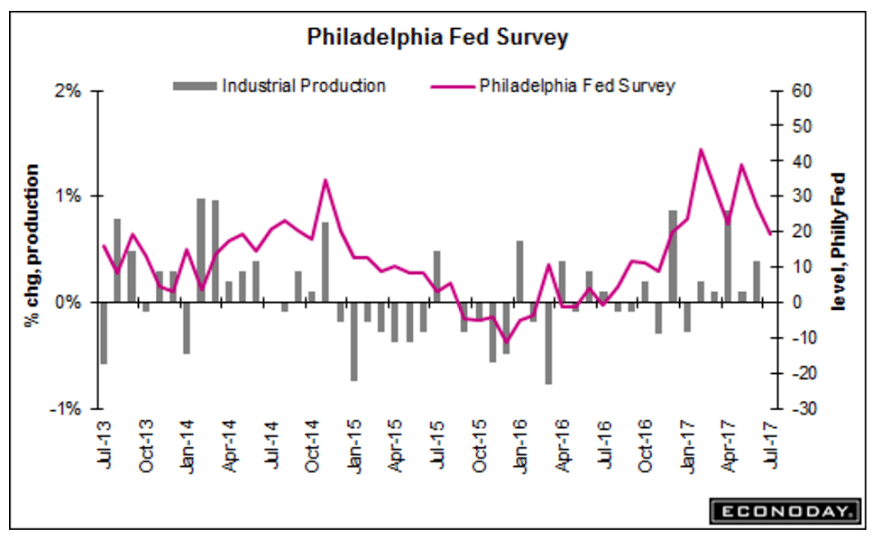
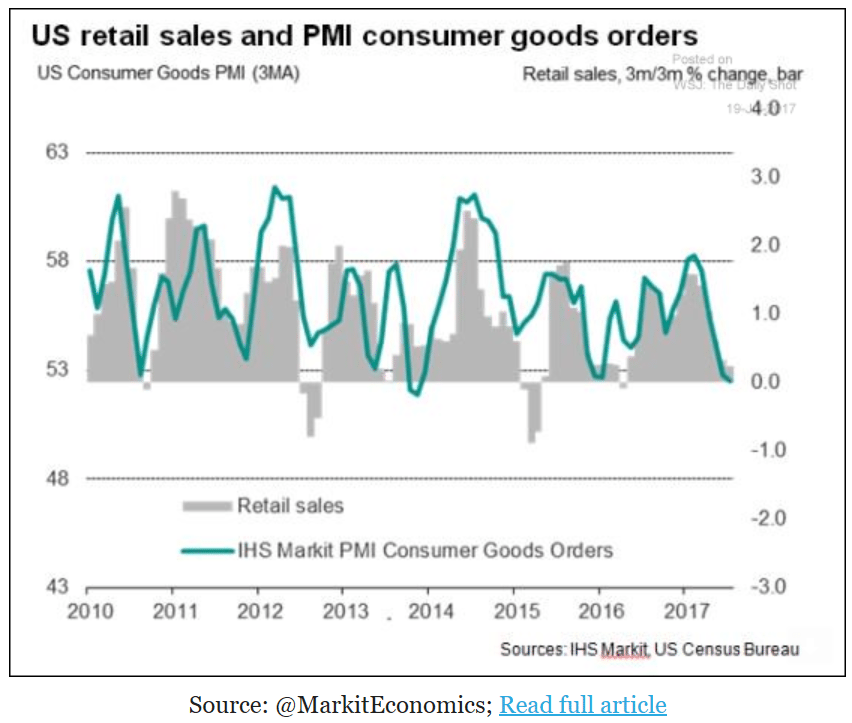
Fading:
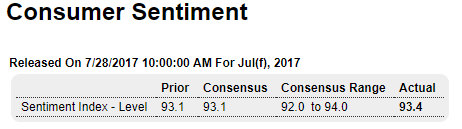
Highlights
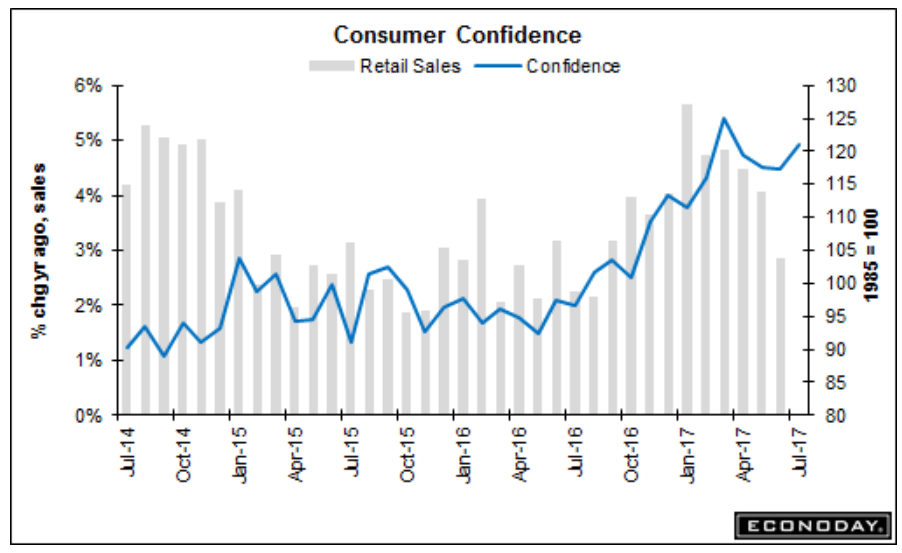
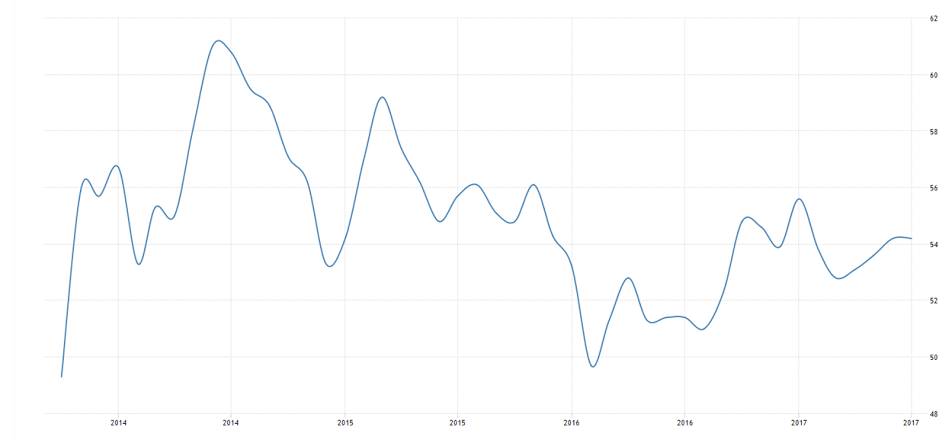
Consumer sentiment edged higher the last two weeks of this month, producing a final reading of 93.4 vs 93.1 at mid-month. Still, the result is noticeably lower from June’s 95.1 and reflects weakening in expectations, down 3.4 points to 80.5, that contrasts with strengthening in the current assessment, up nearly 1 point to 113.4. The report warns that this divergence hints at a shift lower for current conditions and the total index in the months ahead. Inflation expectations remain very subdued, at 2.6 percent for both the 1-year and 5-year outlooks.
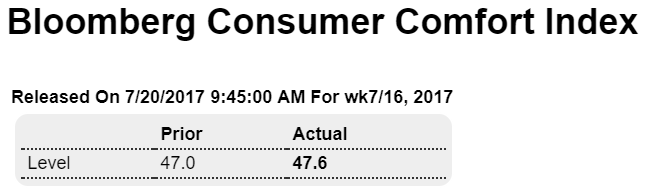
This report has been moving south in contrast to the consumer confidence report which has been holding firm at 17-year highs. But throwing the weekly consumer comfort index into the mix, which has also been moderating, points to slightly less optimism than earlier in the year.
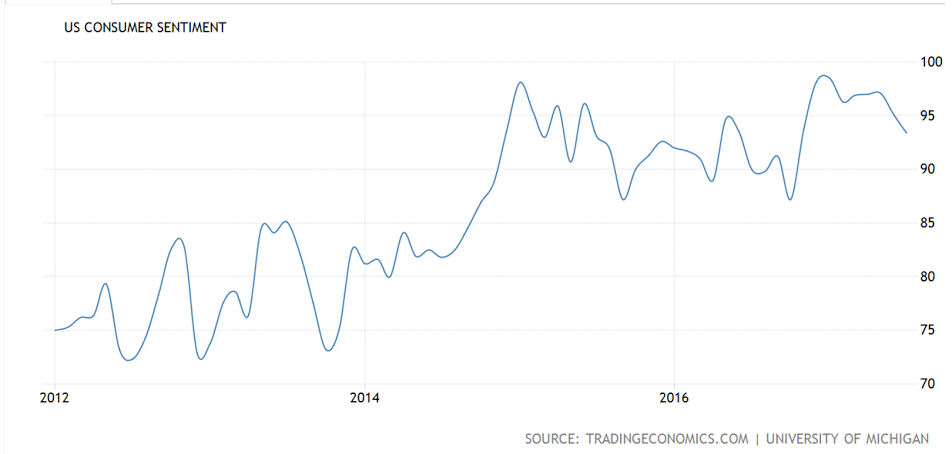
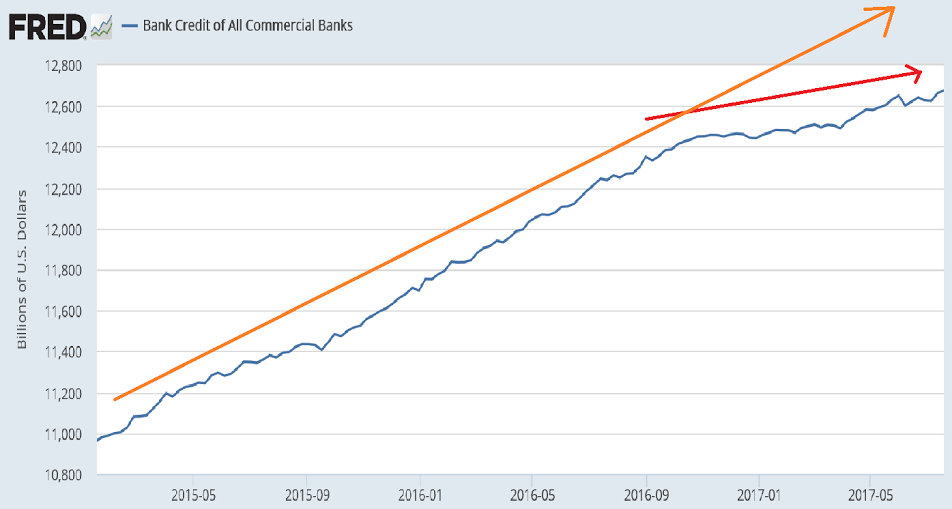
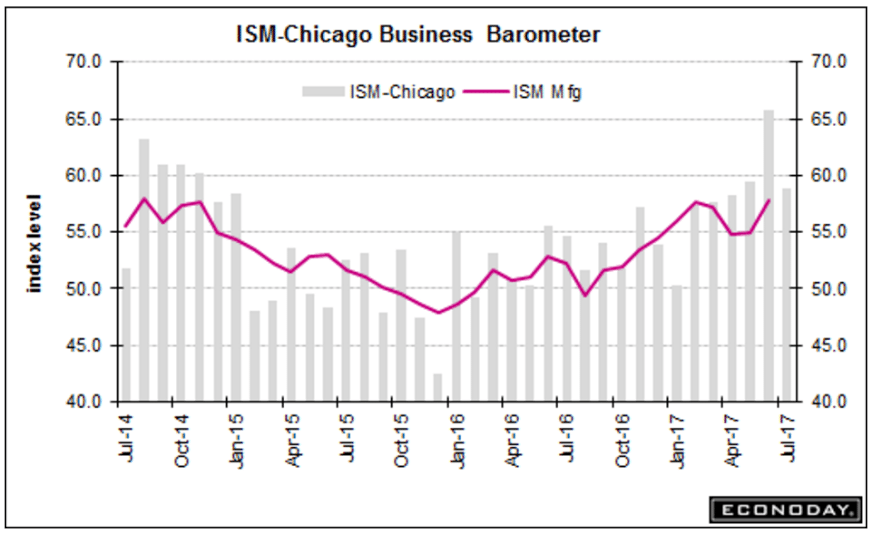
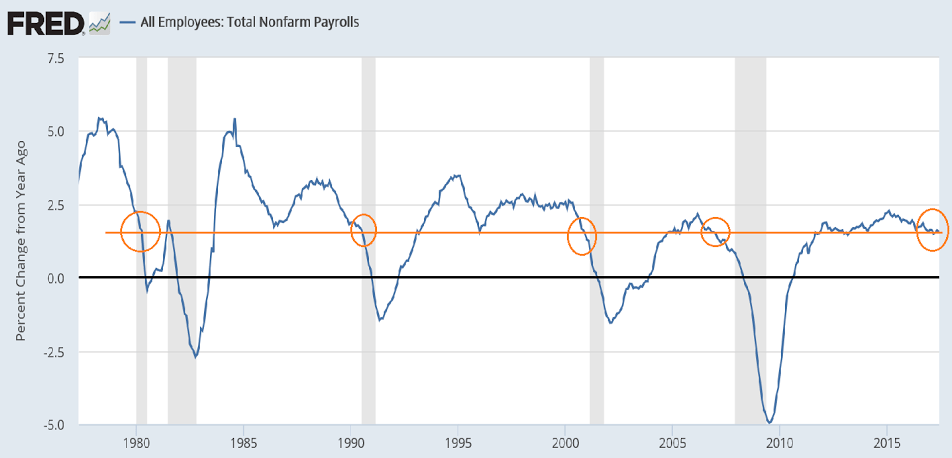
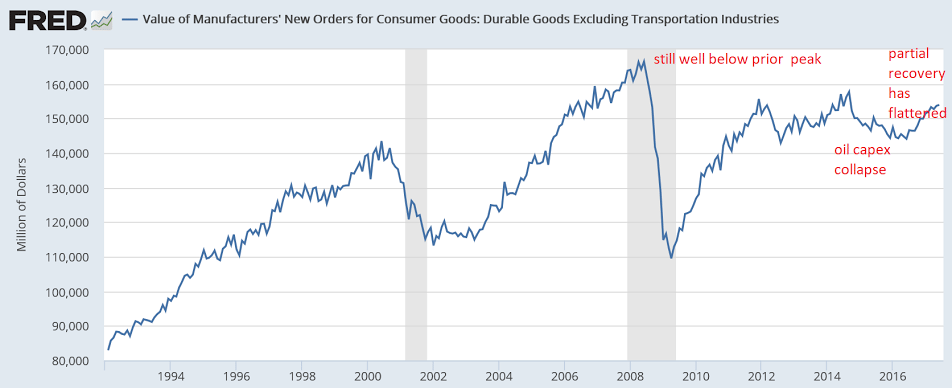
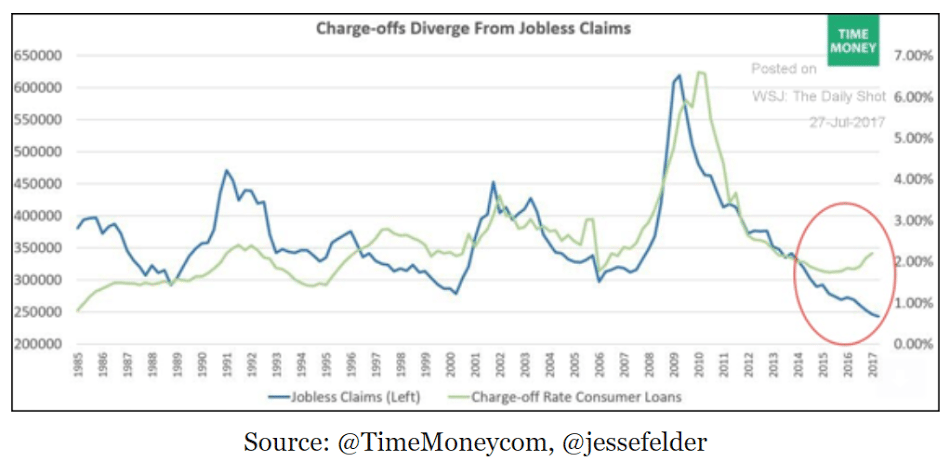
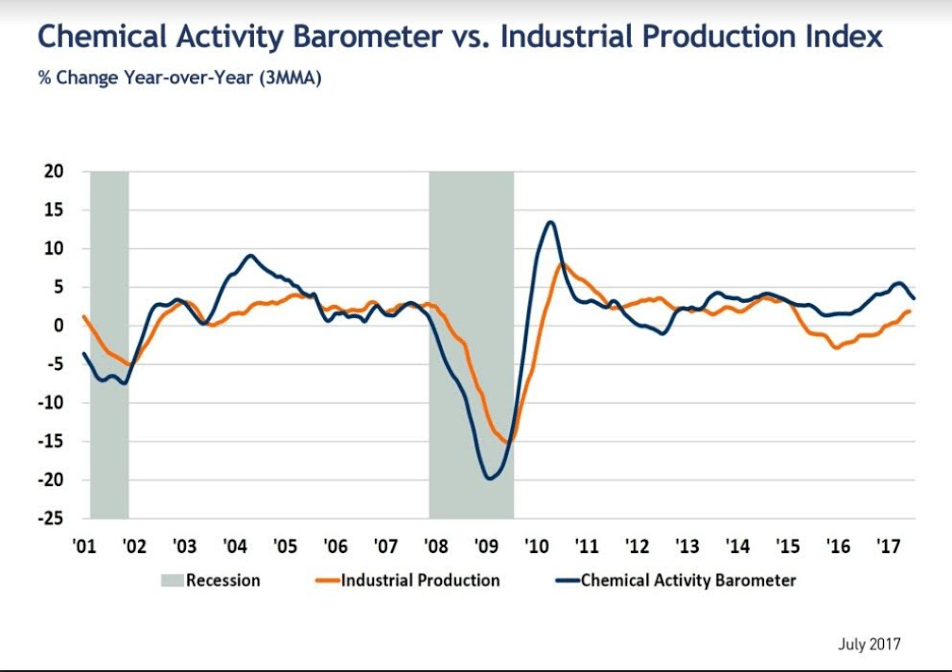
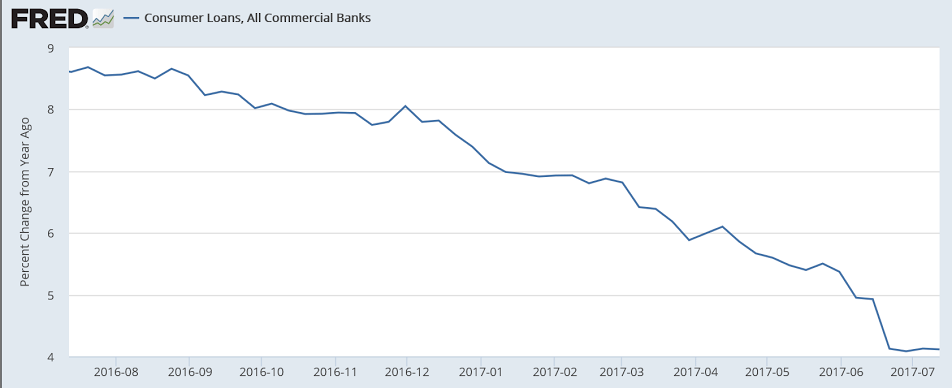
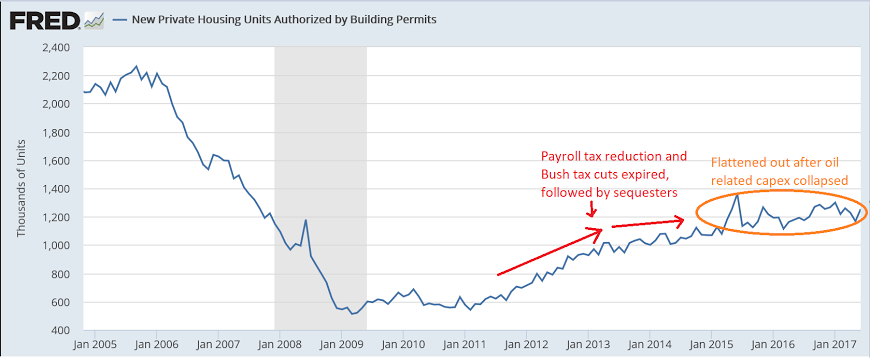
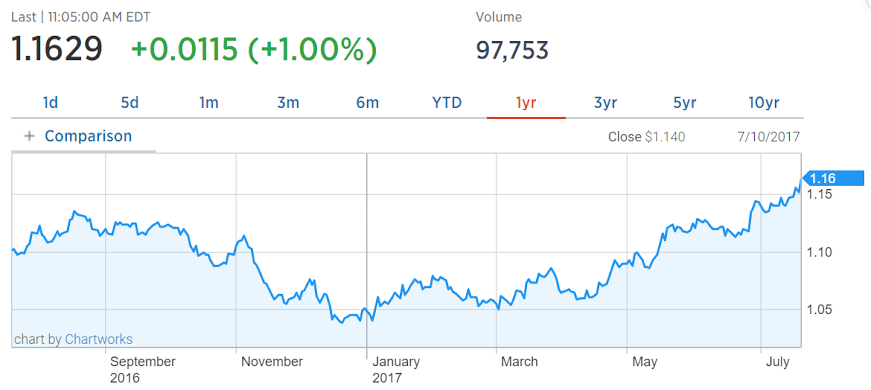
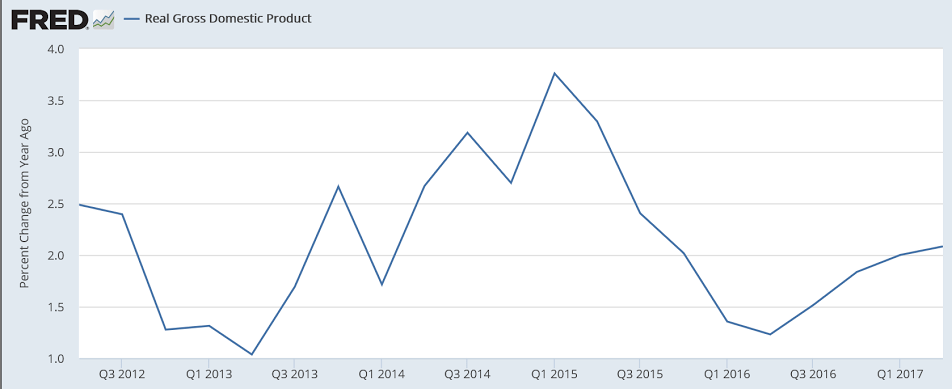
Note how the red line has stopped improving and flattened:
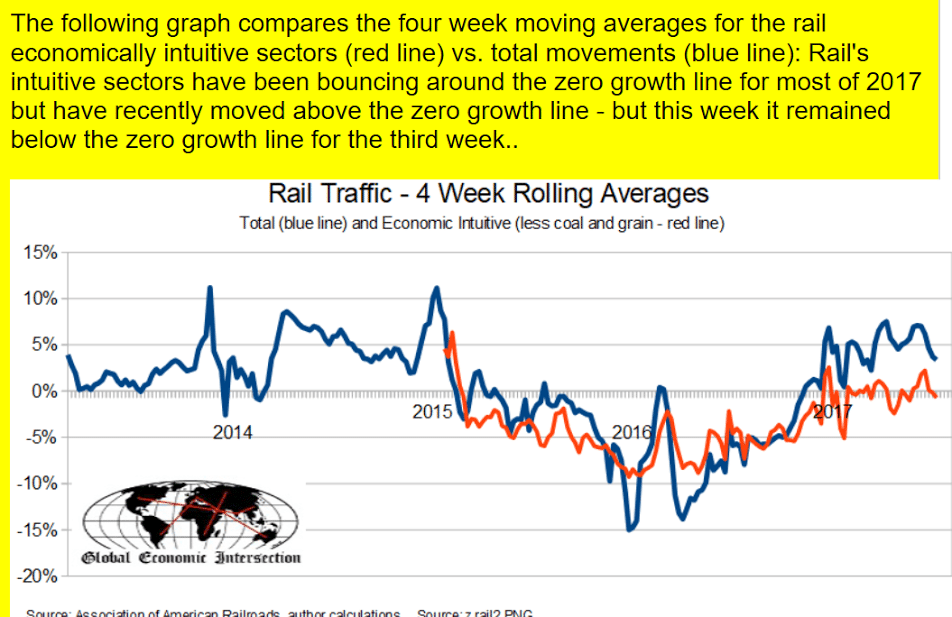
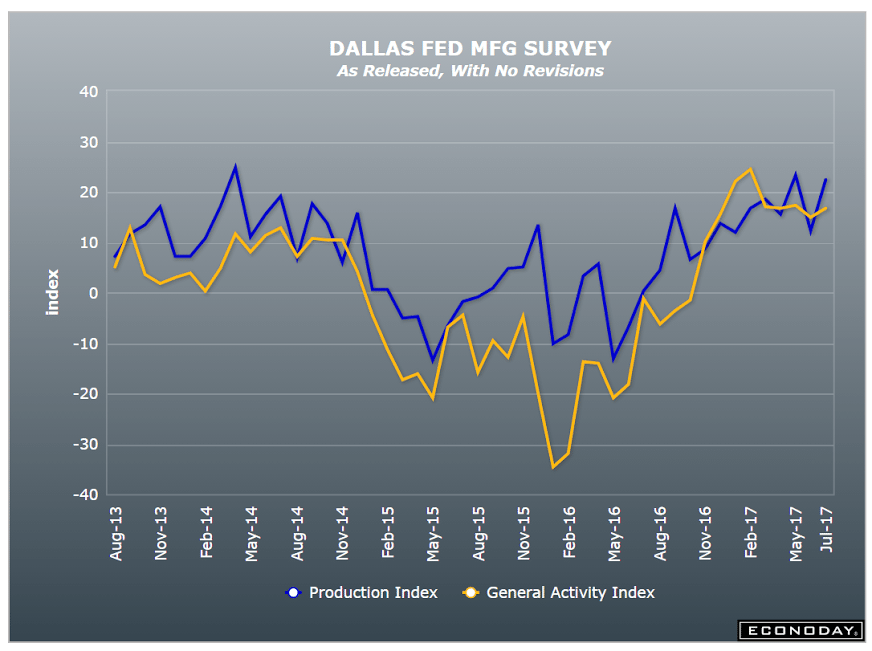
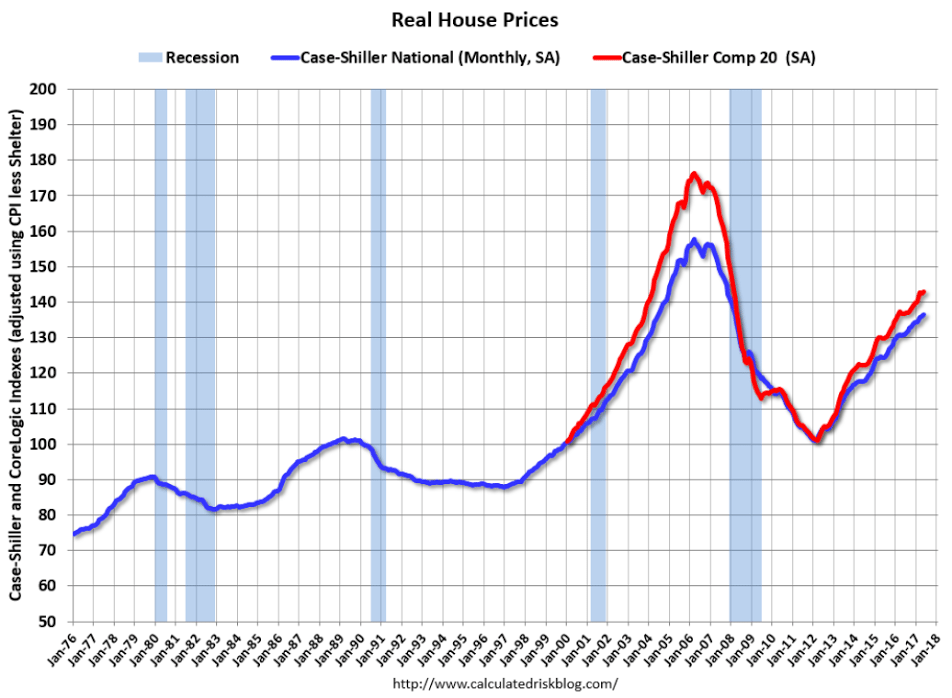
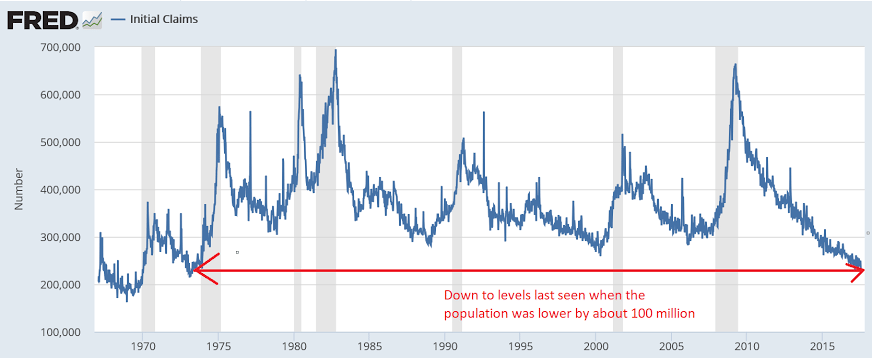
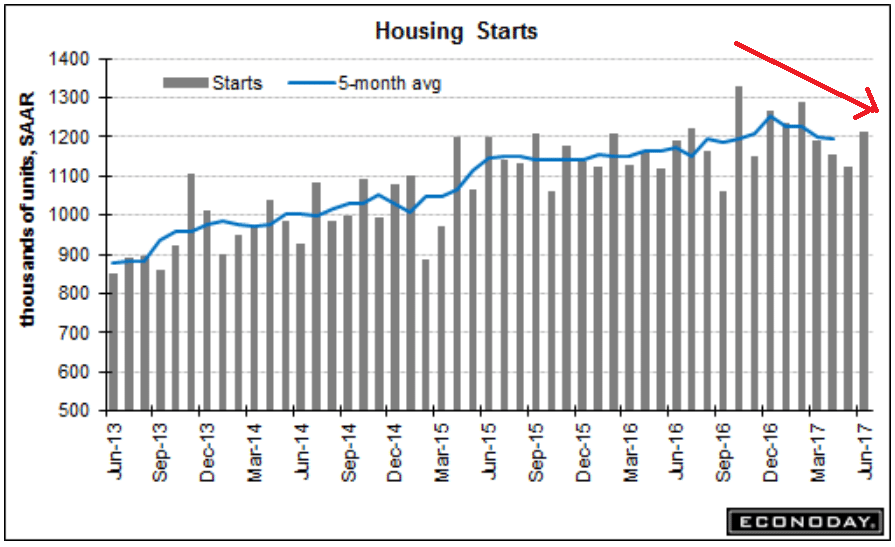
Still looking ominous:
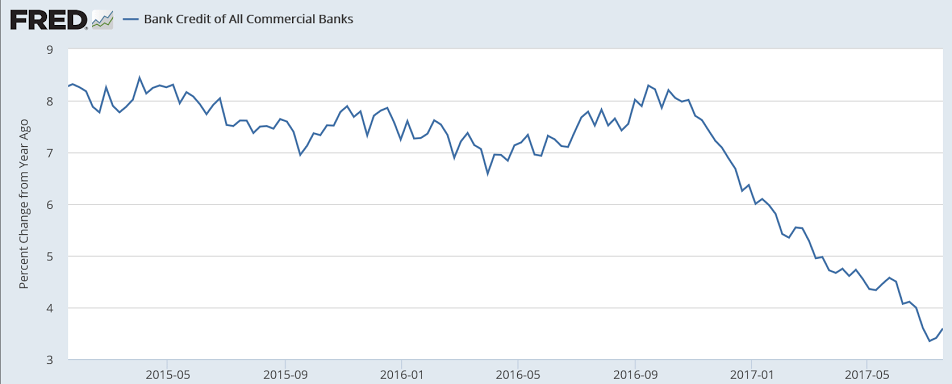
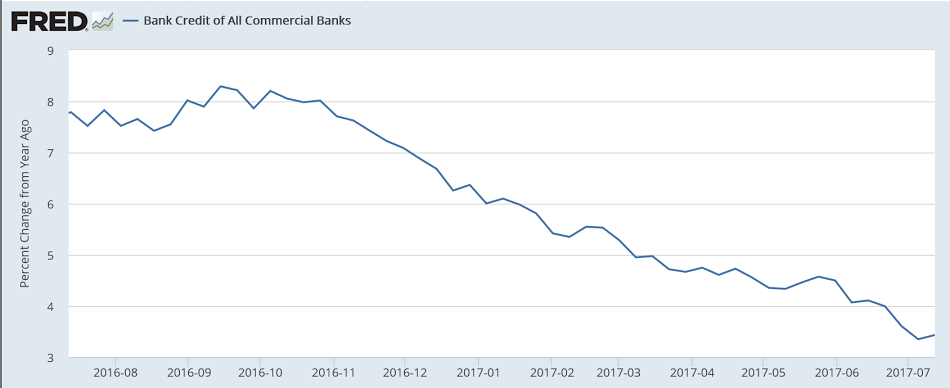
You can see here how much more lending there would have been had the growth not suddenly flattened last November: