Retail sales, Industrial production, Euro area trade, Rail week

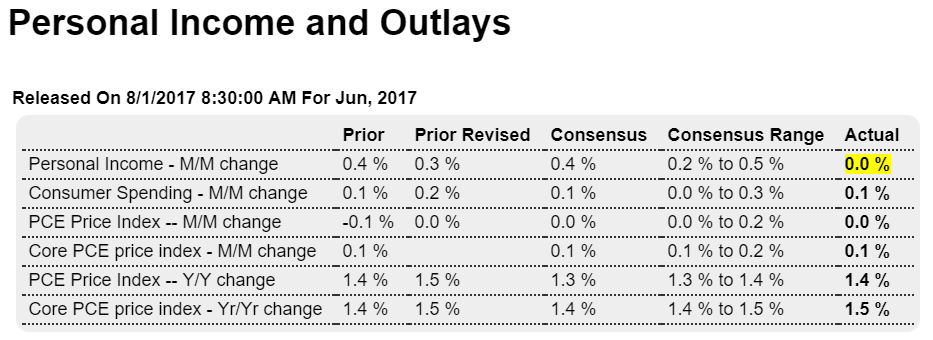
The story is the weakness is weather related, as was the cpi increase, though not the downward revision for the prior month. (I suppose getting control of the weather would be a useful policy tool for the Fed to hit its targets?)

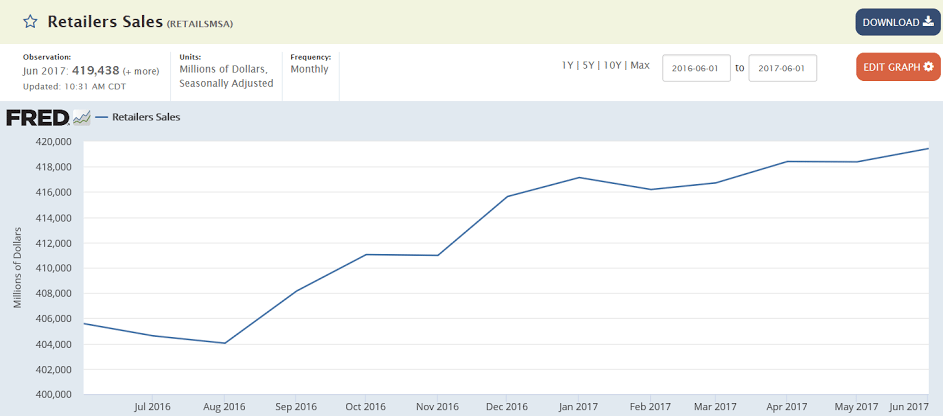
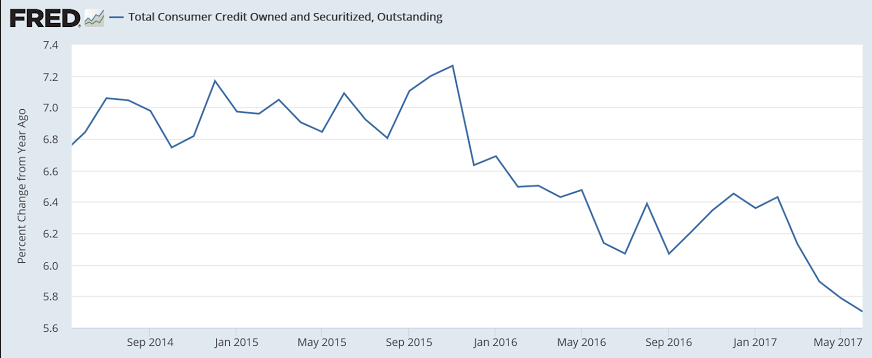
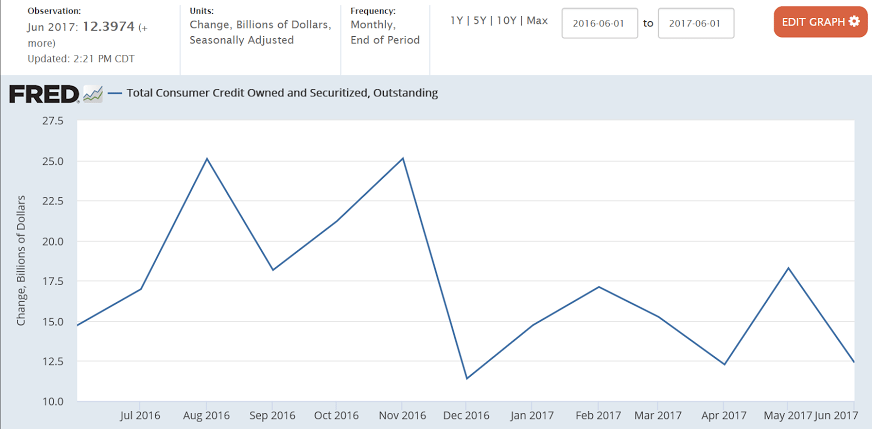
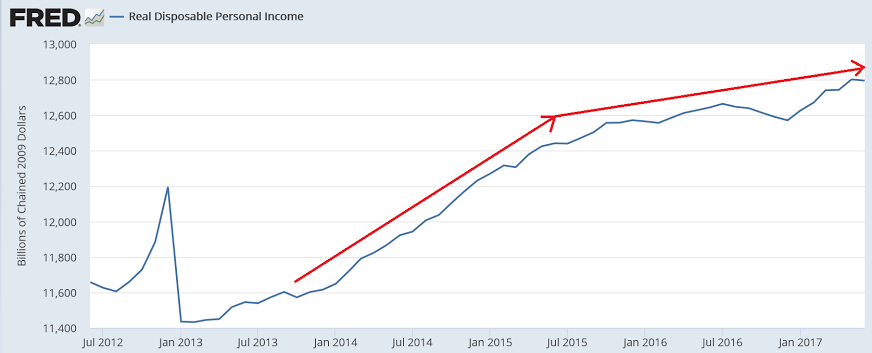
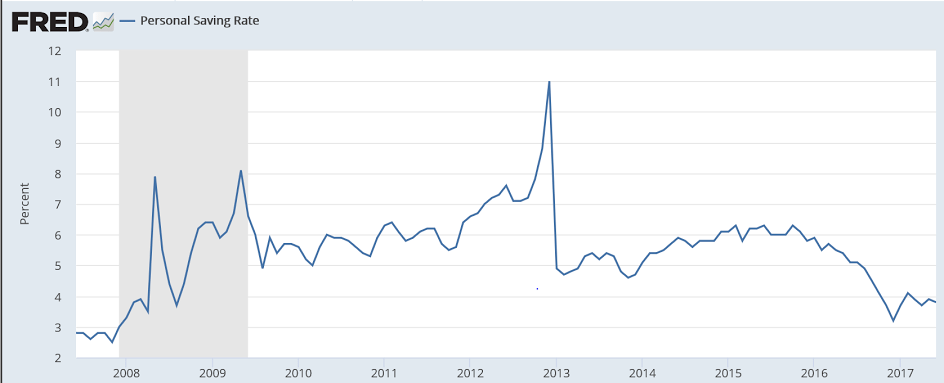
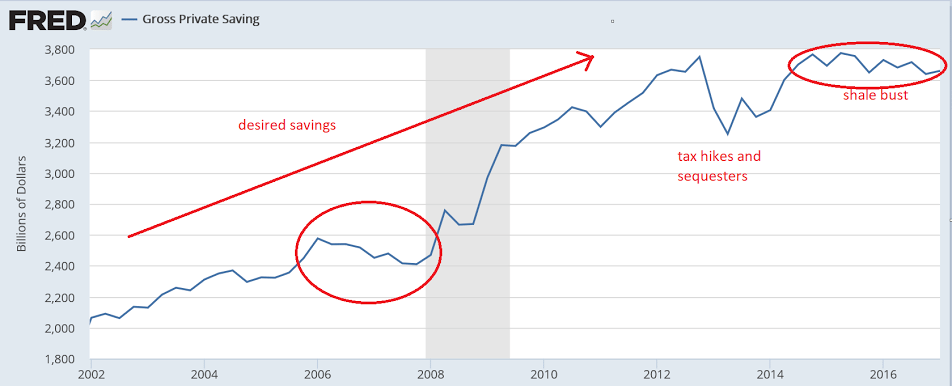
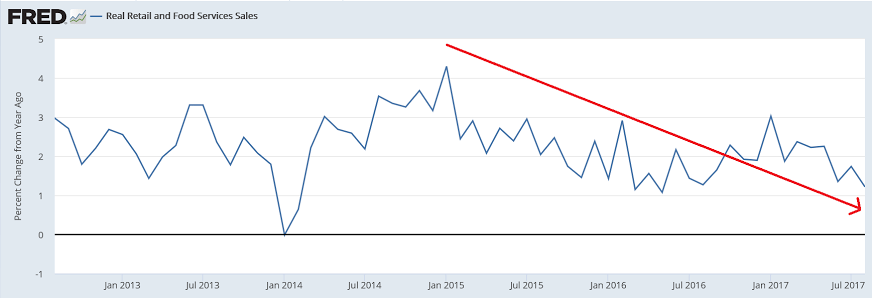
The economy is to some degree path dependent, which in this case means that a slowdown in sales = a slowdown in income which can reduce future sales even after the weather issues clear up, especially given the declining growth rate real disposable personal income, the drop in the growth of borrowing, and the consumer dipping into savings to sustain spending.

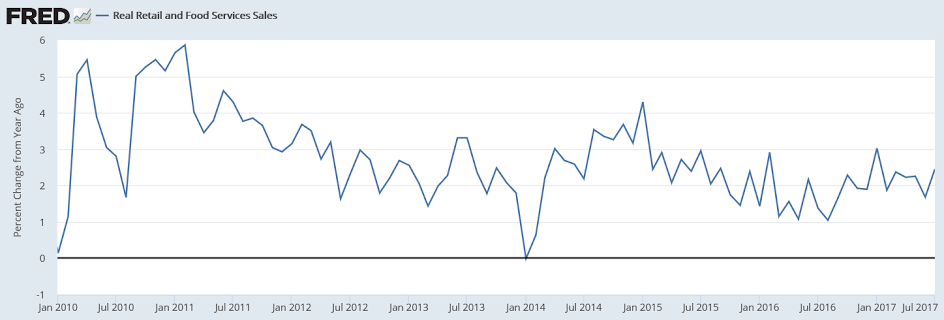
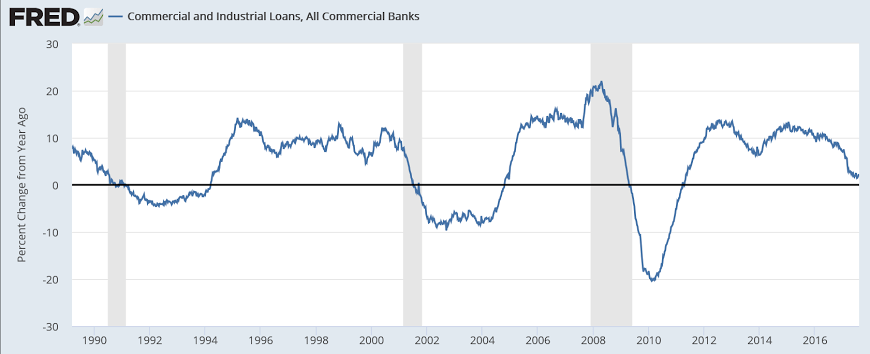
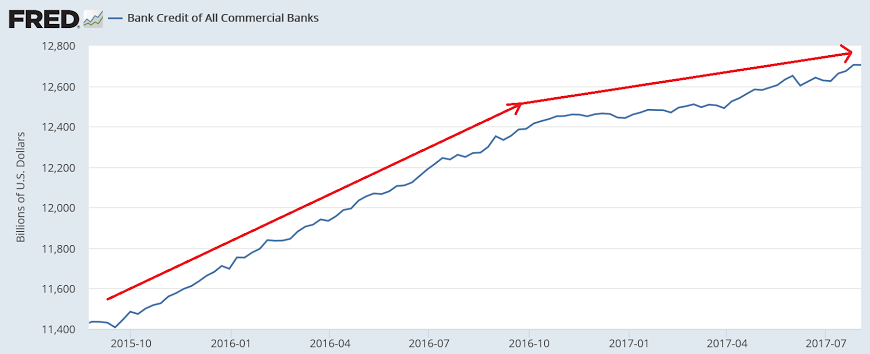
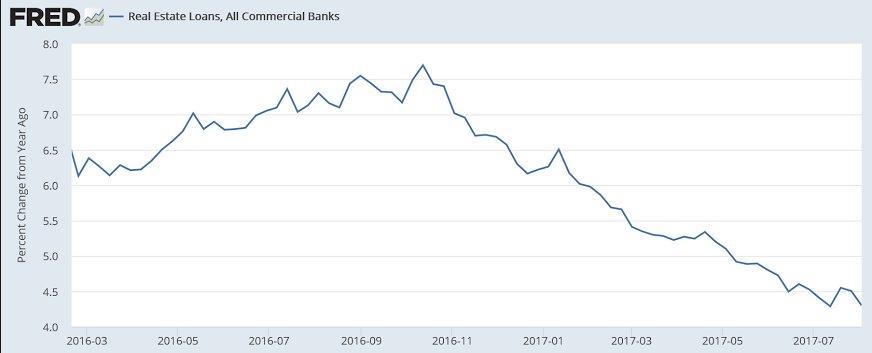
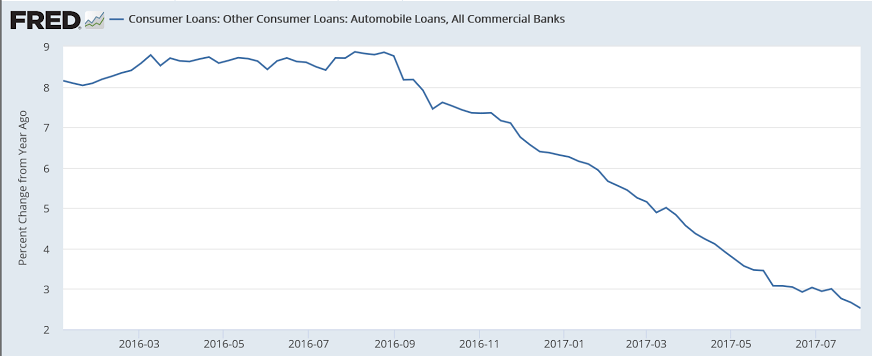
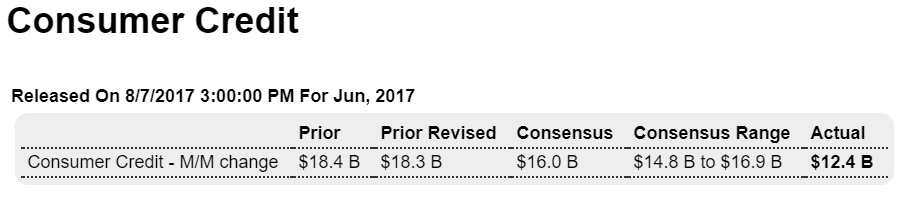
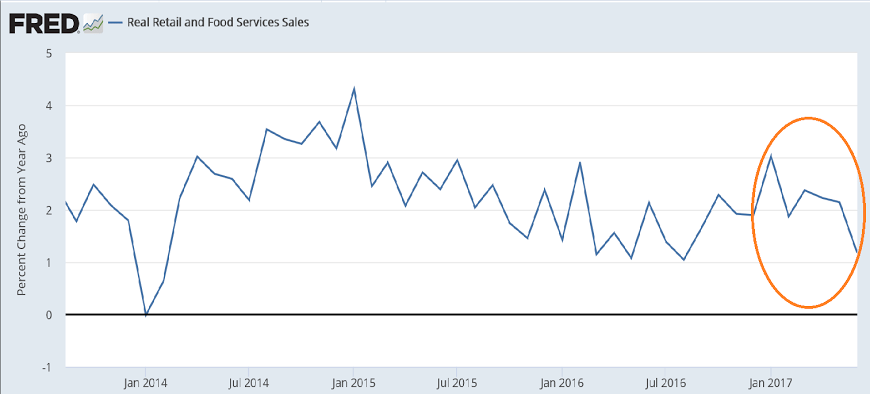
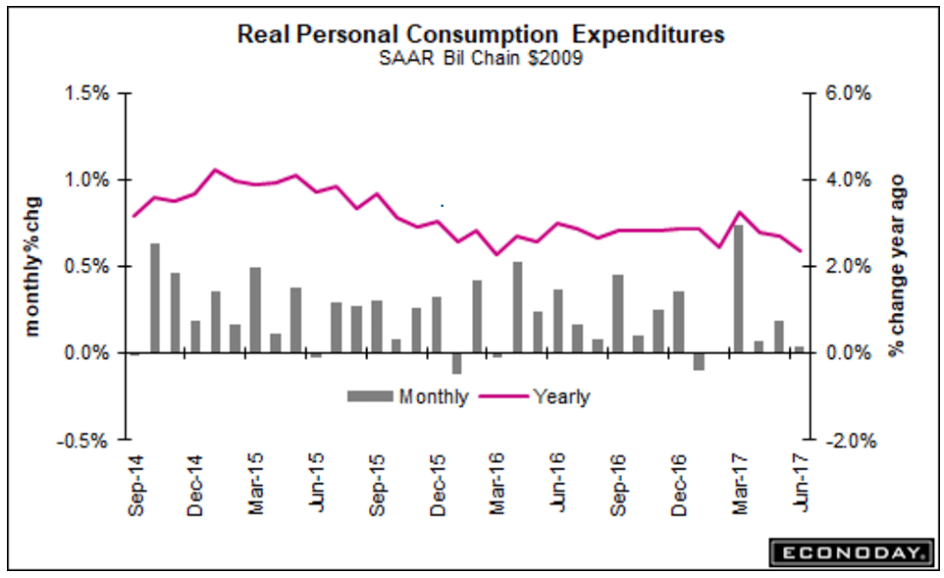
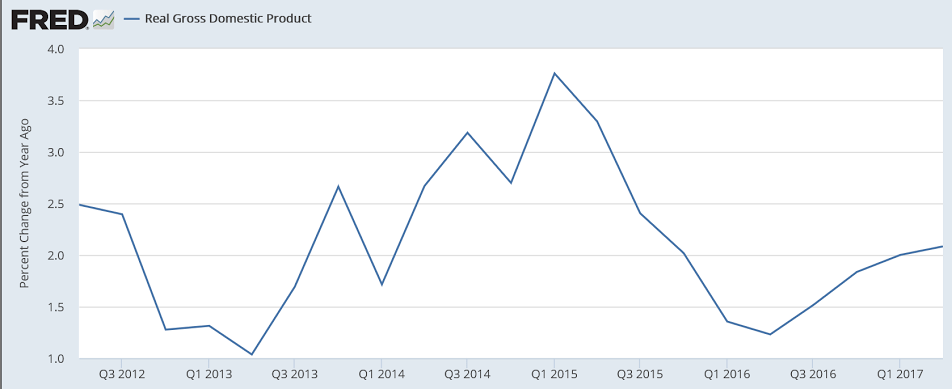
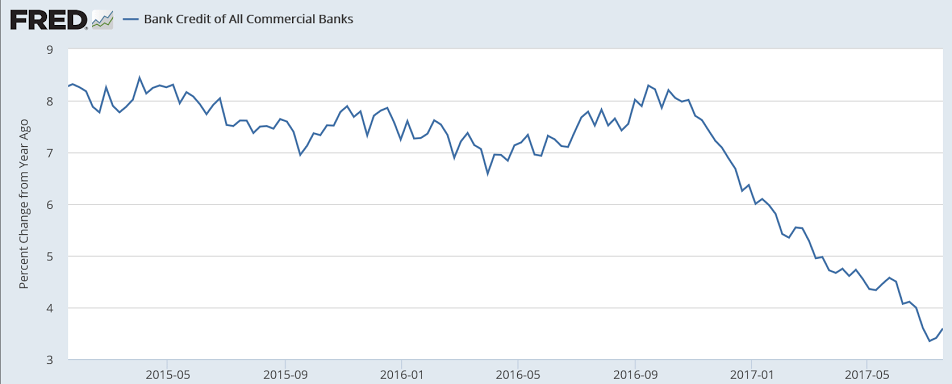
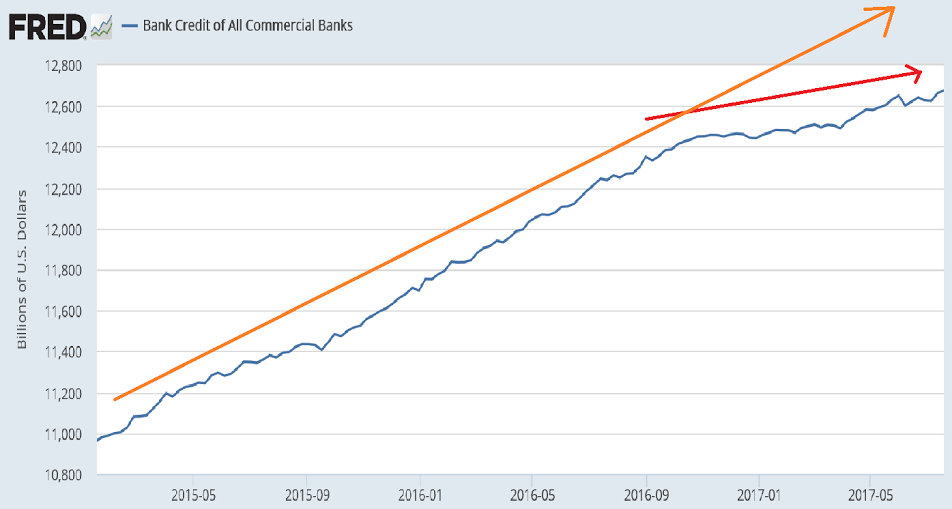
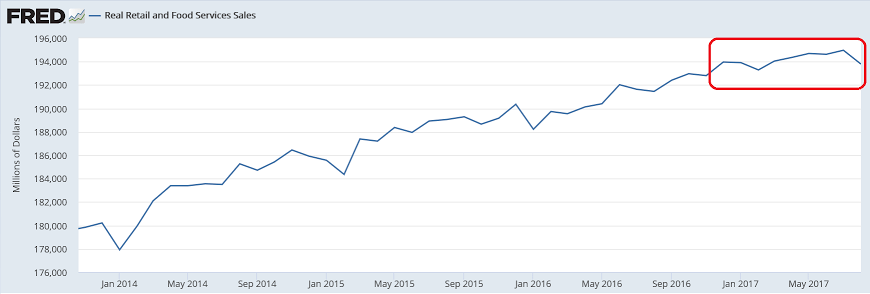
In fact, with this month’s report and the downward revisions, as per the chart it looks like consumer spending has gone flat, and is now more in line with the deceleration of the credit aggregates previously discussed:

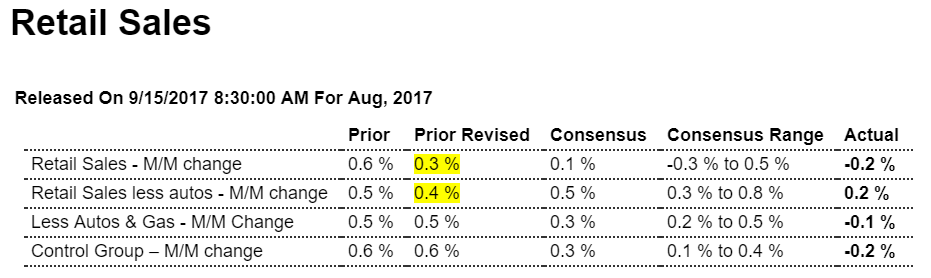
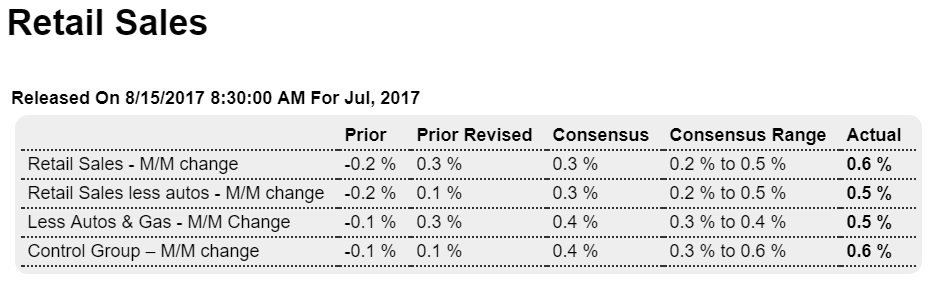
US retail sales fell 0.2% in Aug, vs 0.1% increase expected

“The Commerce Department said while it could not isolate the impact of Harvey on retail sales, it had received indications from companies that the hurricane had “both positive and negative effects on their sales data while others indicated they were not impacted at all.”

from Morgan Stanley:

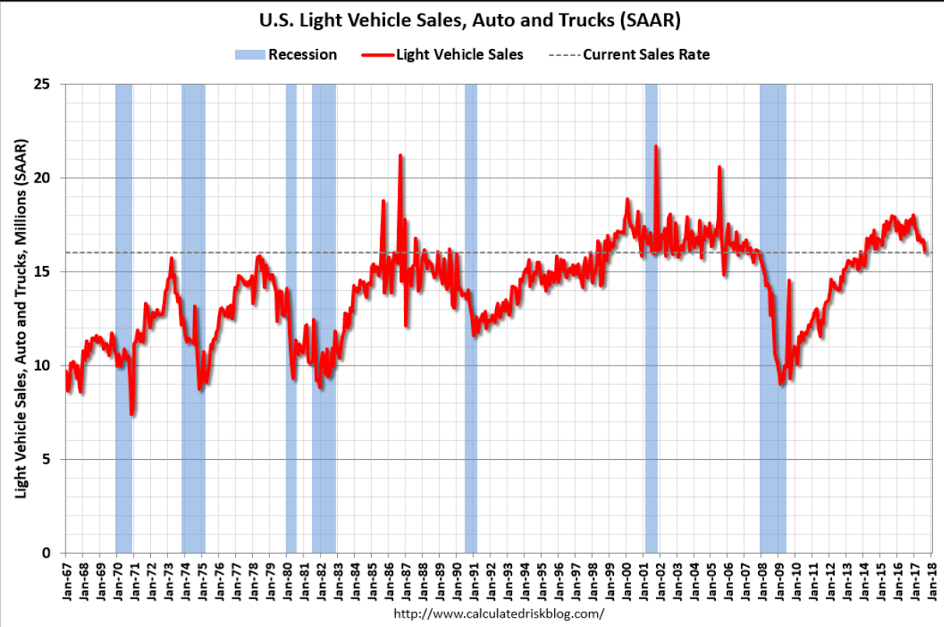
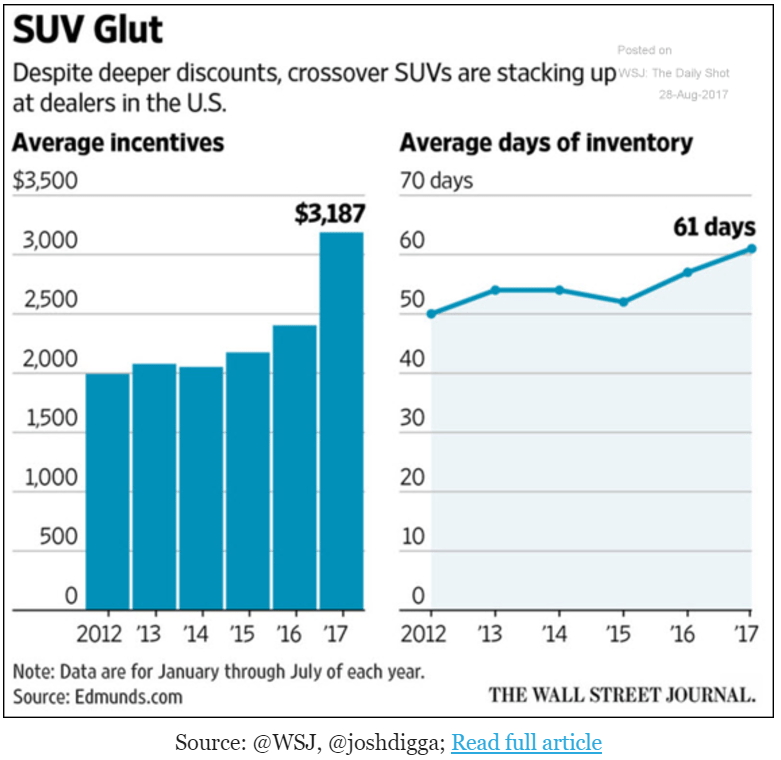
  • Eight of thirteen major categories saw increases in retail sales in August, while five categories saw substantial weakness that dragged down the overall sales figures. Weakness in retail sales in August was seen in motor vehicles and parts (-1.6%), electronics & appliance stores (-0.7%), building materials, garden equipment & supply dealers (-0.5%), clothing & accessory stores (-1.0%), and nonstore retailers (-1.1%). Positive results in the report were seen in miscellaneous store retailers (+1.4%), general merchandise stores (+0.2%), sporting goods, hobby, book & music stores up 0.1%, health & personal care stores (+0.1%), food & beverage stores (+0.3%), gasoline stations (+2.5%), and food services & drinking places (+0.3%).
  • While auto sales and sales at home improvement stores were weaker in August, we expect to see some bounceback in September. Early industry figures for September point to a large bounceback in auto sales, even before hurricane-related tailwinds kick in. We also expect that sales at home improvement stores will rebound in September as post-hurricane rebuilding efforts begin.
  • Core retail sales came in well below assumptions built into our 3Q GDP tracking, and combined with downward revisions to prior months. These factors led to a significant downward revision to our 3Q GDP tracking estimate to 2.4% from 2.8% previously, with 3Q consumption now tracking at 2.0% vs 2.8% previously.
  • Moreover, weakness in the home improvements category led to a downward revision in our tracking for 3Q residential investment to -3.6% from -2.8% previously.

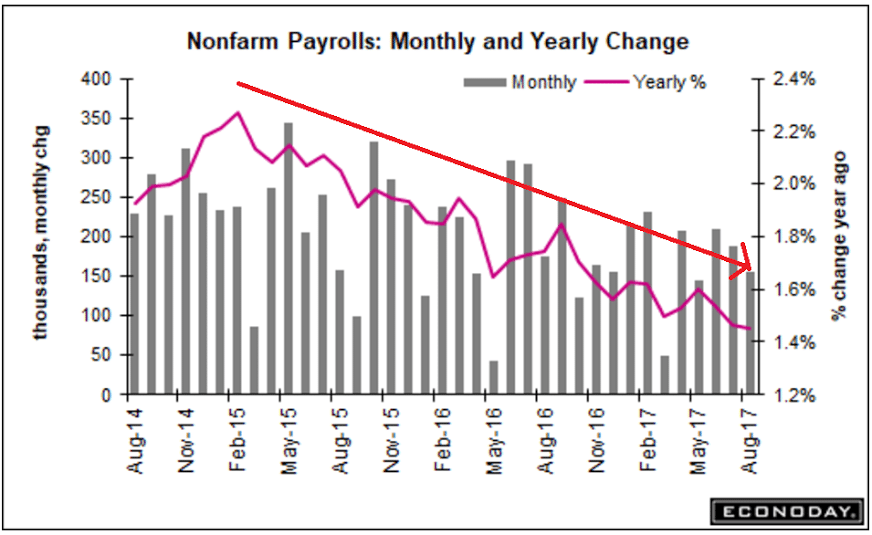
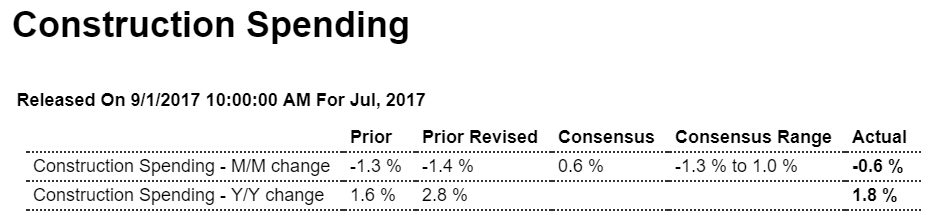
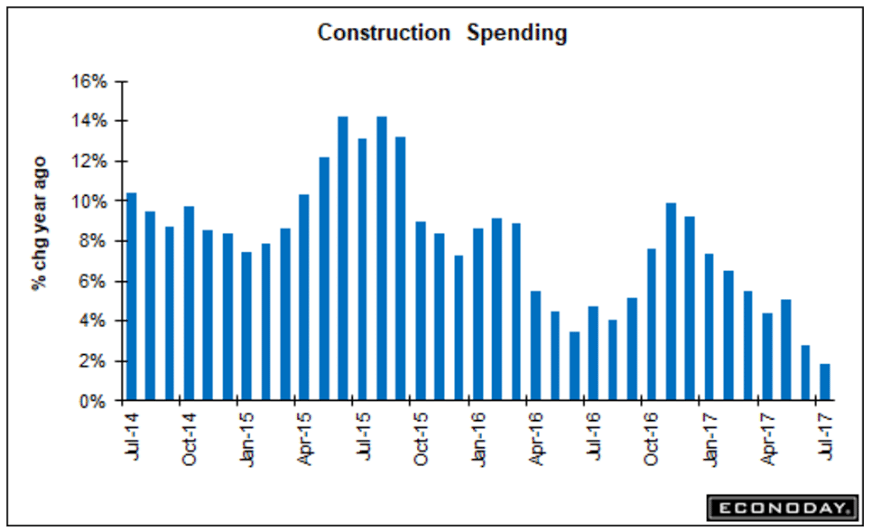
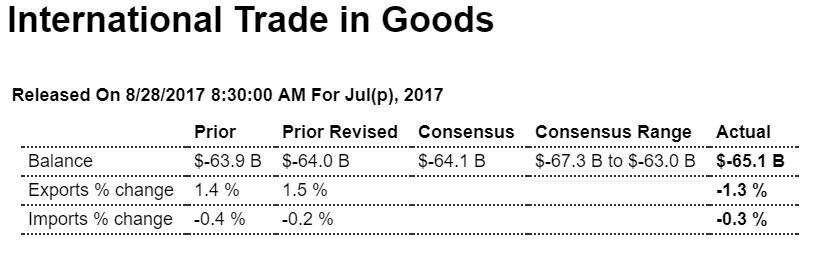
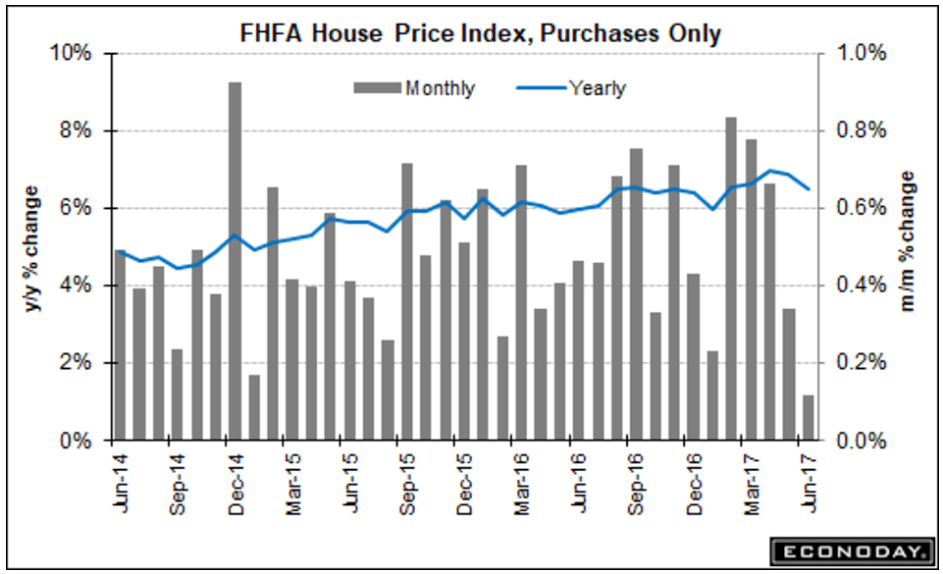
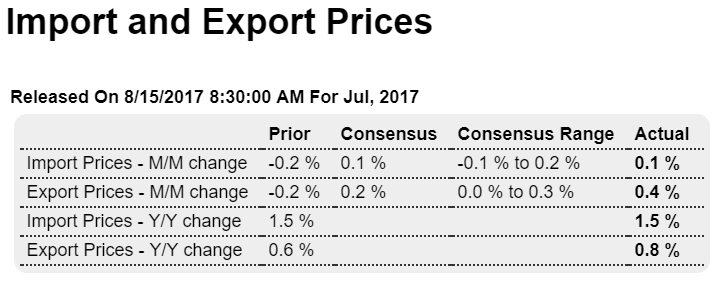
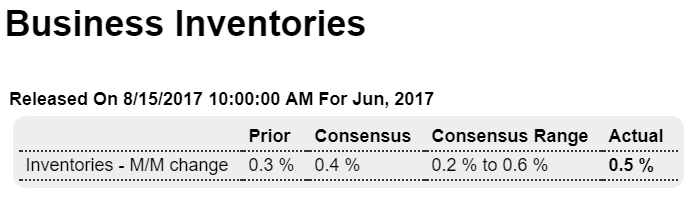
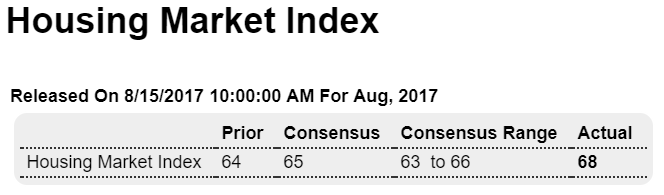
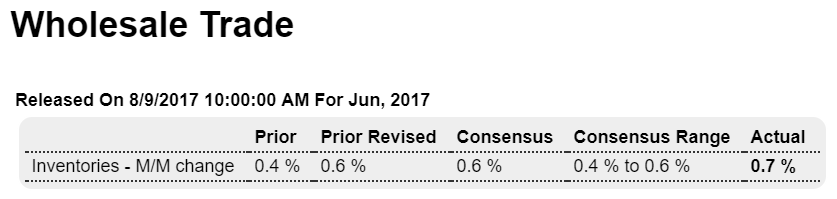
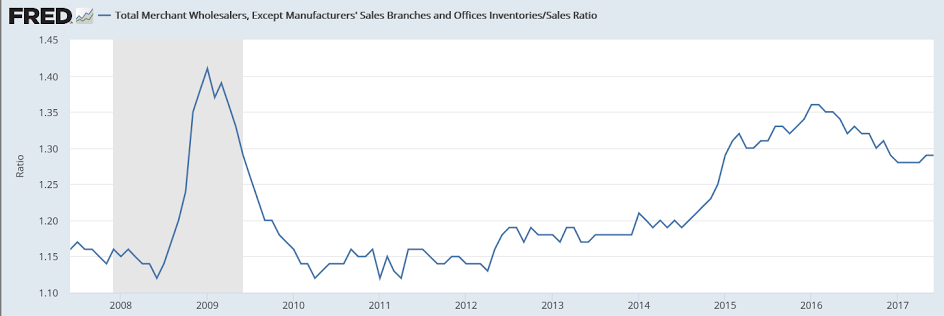
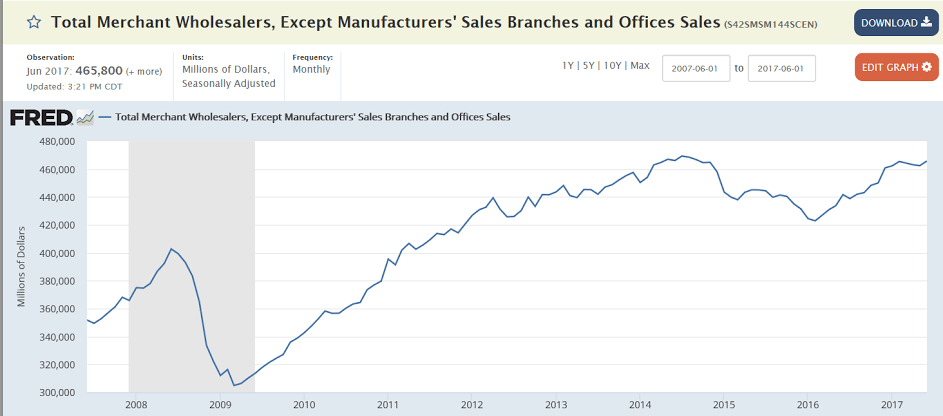
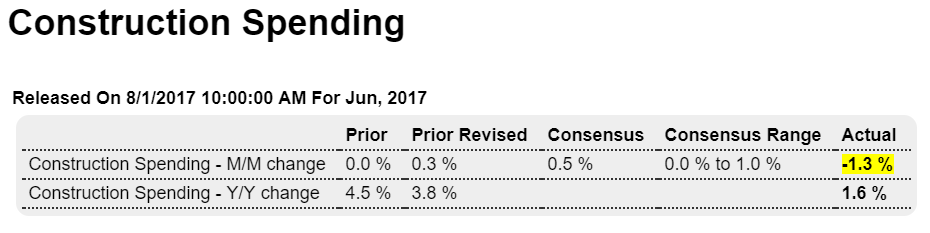
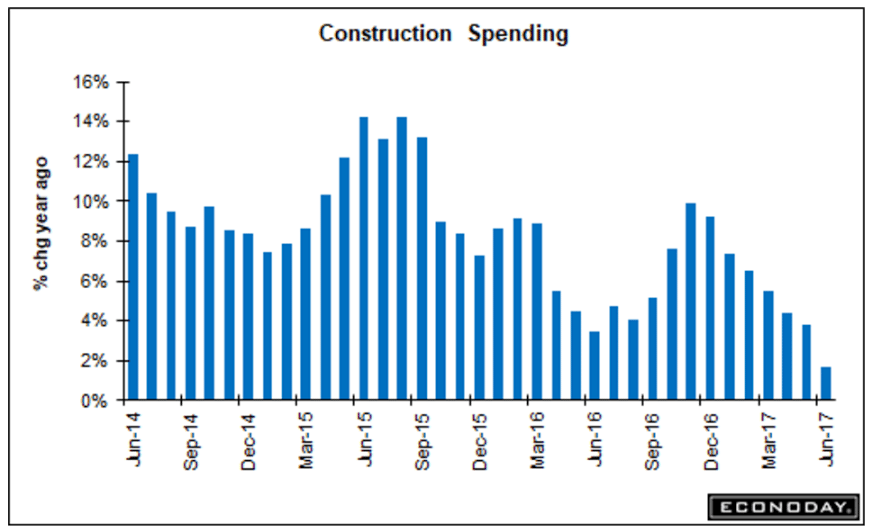
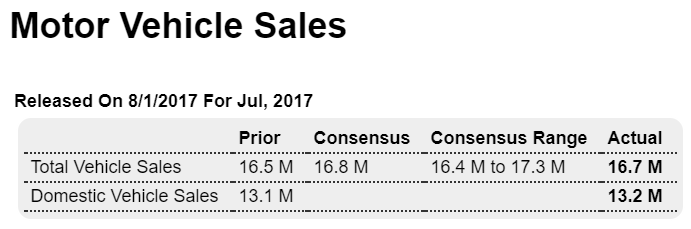
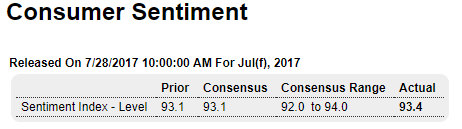
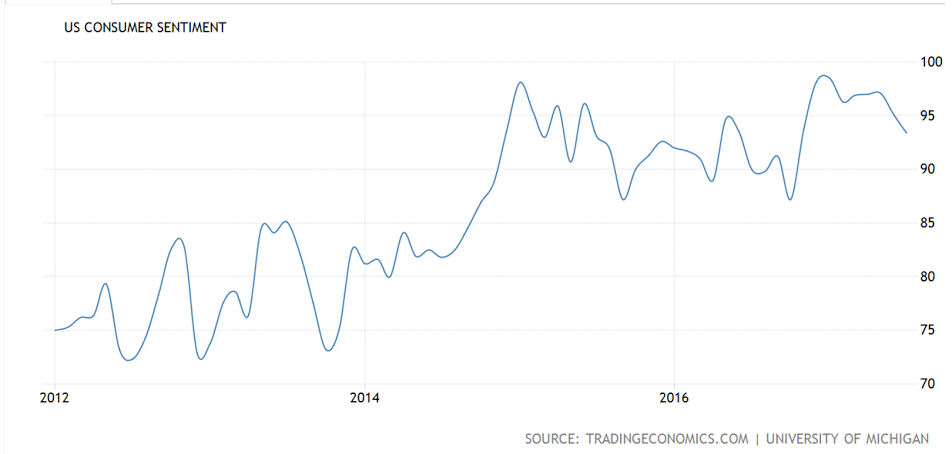
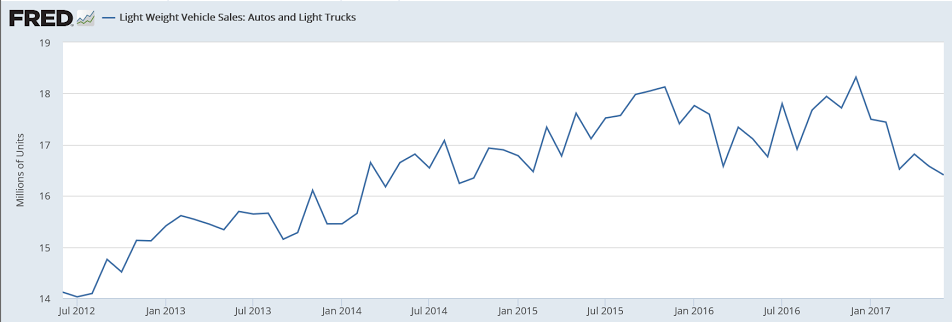
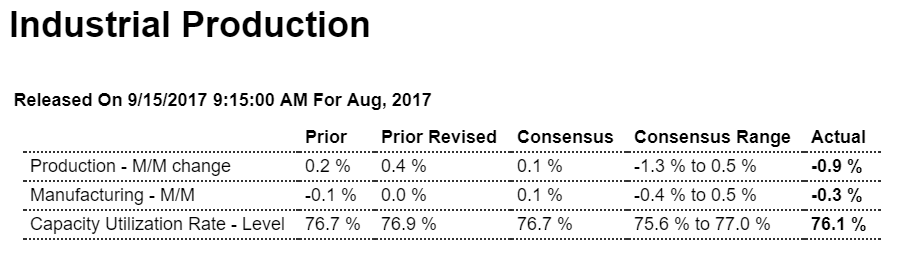
  • Down due to weather issues, but otherwise probably chugging along at a modest pace:

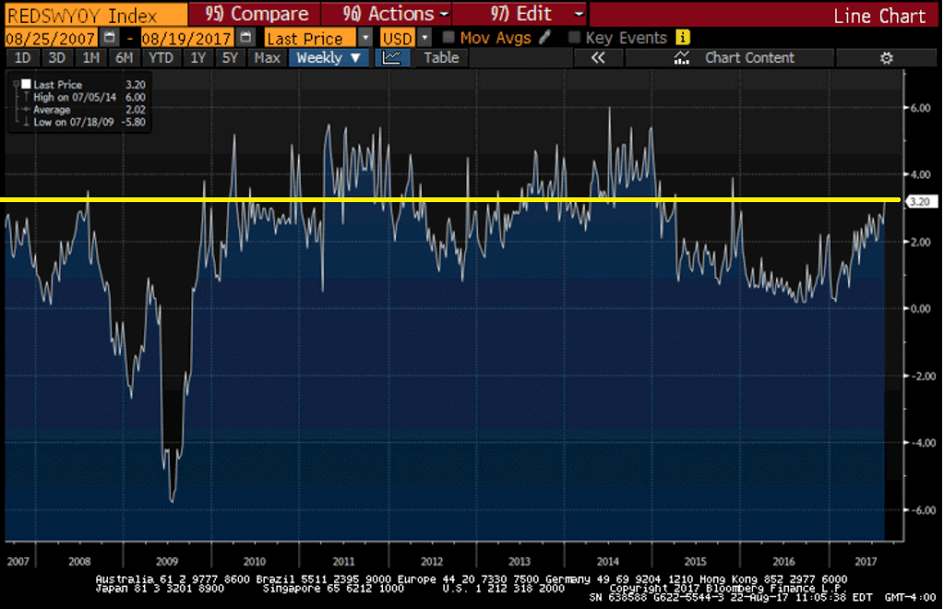
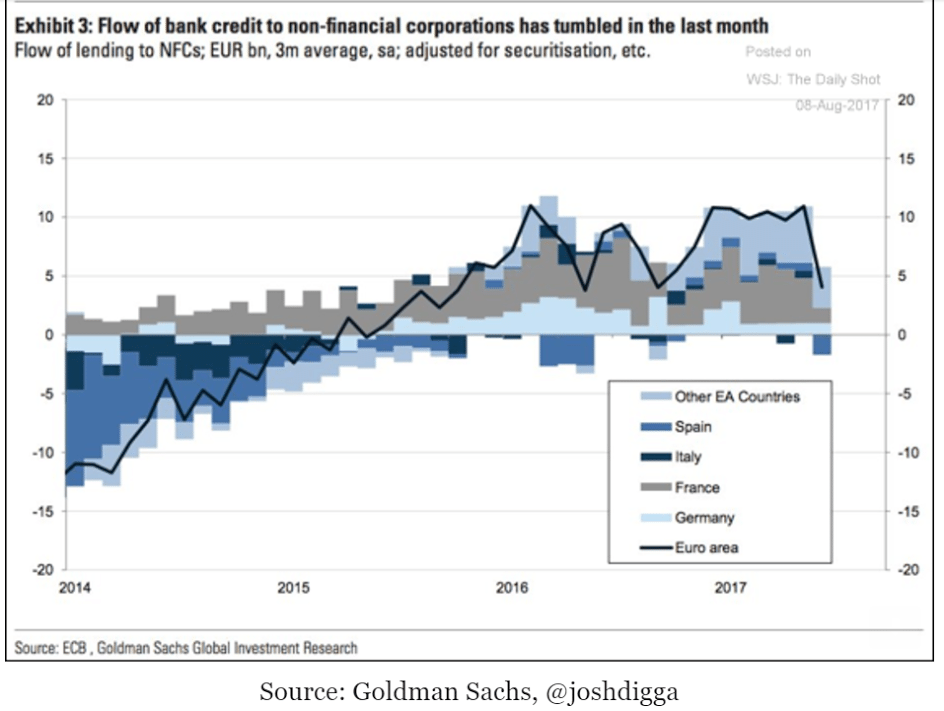
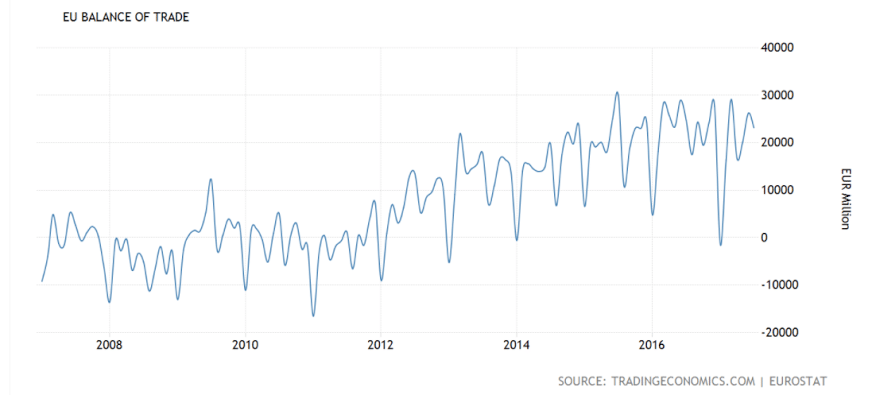
    Still a large and persistent trade surplus, which is fundamentally euro friendly:

    The Euro Area trade surplus narrowed to EUR 23.2 billion in July 2017 from EUR 24.8 billion in the corresponding month of the previous year. Still, the reading came in above market expectations of EUR 21.4 billion.

    Exports of goods to the rest of the world increased by 6.1 percent to EUR 177.7 billion from EUR 167.6 billion in July 2016, while imports advanced at a faster 8.2 percent to EUR 154.6 billion from EUR 142.8 billion. Intra-euro area trade rose to EUR 145.6 billion, up by 5.6 percent compared with July 2016.

    In the the seven months to July, the trade surplus narrowed to EUR 130.2 billion from EUR 154.1 billion in the same period of 2016.

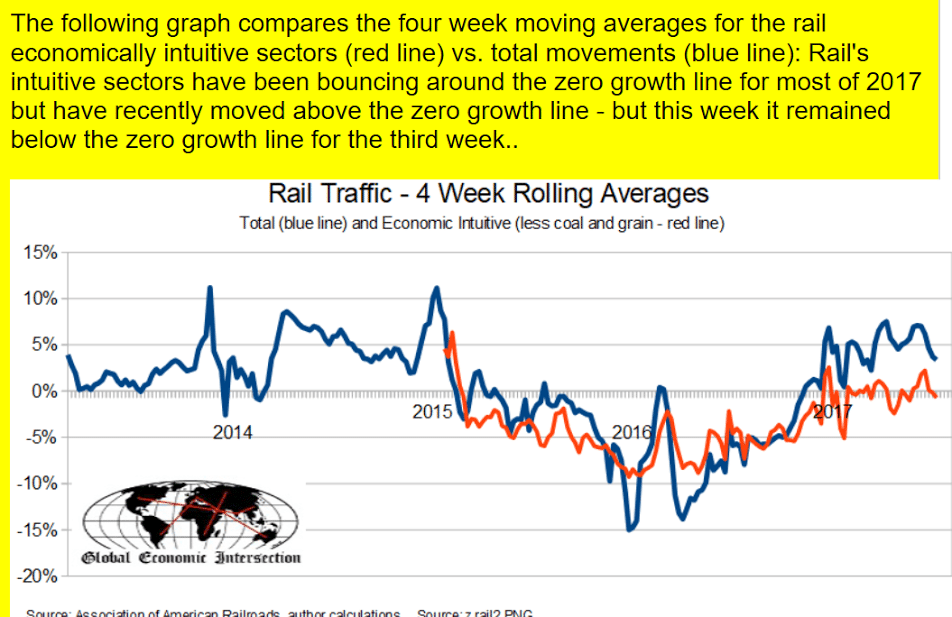
    Rail Week Ending 09 September 2017: Intuitive Sector Decline Continues

    Week 36 of 2017 shows same week total rail traffic (from same week one year ago) improvedaccording to the Association of American Railroads (AAR) traffic data. The economically intuitive sectors are in contraction.

    Employment, Construction spending, Auto sales, Tax plan and debt ceiling

    Weaker than expected, downward revisions, depressed earnings growth and participation rate. And note how the year over year growth has been going down now in, for all practical purposes a straight line, for over 2 1/2 years, when the shale boom ended and oil capex collapsed:

    Highlights

    August payroll growth, though solid, missed expectations while wage data clearly disappointed. Nonfarm payrolls rose 156,000 in the month vs Econoday’s consensus for 180,000. Revisions are negative with July revised 20,000 lower to 189,000 and June down 21,000 to 210,000. The unemployment rate reflects the softness, rising 1 tenth to 4.4 percent.

    Average hourly earnings barely rose at all, up a monthly 0.1 percent with the year-on-year rate at 2.5 percent. These are both 1 tenth below expectations.

    But a major positive in the report, and one correctly signaled by regional factory reports, is a 36,000 surge in manufacturing payrolls that includes a 10,000 upward revision to July to a 26,000 increase and a 9,000 upgrade to June to a gain of 21,000. Construction payrolls are also solid, up 28,000 in August following a 3,000 decline in July. An offset to manufacturing and construction is weakness in retail which, after six straight monthly declines, added only 1,000 jobs despite Amazon’s plans to hire 50,000.

    And government payroll growth is below expectations, falling 9,000 for the third decline in four months. Excluding government payrolls, private payrolls in August came in at 165,000 which is 9,000 above the headline total but still 15,000 short of expectations.

    Weekly hours are also soft, down 1 tenth to 34.4 with manufacturing, in contrast to the hiring, down 2 tenths to 40.7 hours which points to a second straight monthly disappointment for the manufacturing component of the industrial production report.

    But it’s the wage data that, for policy makers, may be the greatest disappointment and will provide the doves, who are concerned about the economy’s lack of inflation, serious arguments to delay the beginning of balance-sheet unwinding at this month’s FOMC.


    Flattening out at very low levels:


    Worse than expected as year over year growth continues to decelerate:

    Highlights

    Strength in residential building makes for a better construction spending report than indicated by the headline 0.6 percent July decline. Driven by single-family homes, residential construction rose a very solid 0.8 percent in the month for a year-on-year gain of 11.6 percent that contrasts markedly with the 1.8 percent overall rate. Home improvements, up 1.4 percent in the month, were also very strong. Spending on multi-family construction continues to moderate, down 0.8 percent in the month for only a 2.6 percent yearly gain.

    The real weakness in the report is on the nonresidential side where private spending, reflecting weakness across all components and especially commercial building, fell 1.9 percent for a yearly decline of 3.6 percent. Public building is likewise soft with the educational category down 4.4 percent in July.

    Though housing permits have been flat, the residential numbers in this report are solid. And strength for construction payrolls in this morning’s employment report might be hinting at better results for construction spending in the August report. Note that the unfolding effects from Hurricane Harvey will be difficult to gauge based on mixed results following prior hurricanes.


    A lot worse than expected:

    U.S. Light Vehicle Sales at 16 million annual rate in August

    Based on an estimate from WardsAuto, light vehicle sales were at a 16.03 million SAAR in August.

    That is down 6% from August 2016, and down 3.9% from last month.


    Read more at http://www.calculatedriskblog.com/#i7LI02KP7LwY0m6L.99

    Interesting headline- speaks to current level of credibility.

    Nor does anyone seem to understand what happens if the debt ceiling is hit, and, to the contrary, there are likely hundreds in Congress who believe going ‘cold turkey’ into a balanced budget is ultimately a very good thing to let happen. Fact is, curtailments of spending cause growth to slow, and tax receipts to fall. Under normal circumstances, that just means the Federal deficit is that much higher, which acts counter cyclically to moderate the slowdown. However, after hitting the debt ceiling, falling revenues automatically induce further spending cuts, as the by law the Federal deficit can’t be allowed to increase, which induces a further slowdown in GDP and, again, tax receipts fall further, and it all goes into an out of control collapse like nothing anyone’s ever seen before:

    Steve Mnuchin insists there is a tax plan (Axios) — U.S. Treasury Secretary Steve Mnuchin says that details should become publicly available by the end of September with a bill passed by year-end. Mnuchin says that President Trump is “absolutely committed to revenue neutrality” in the tax plan, but that only applies under the White House’s optimistic economic growth projections. Mnuchin reaffirmed that Sept. 29 is when the U.S. will reach the current debt ceiling, although says it could move a few days in either direction due to both Hurricane Harvey and Sept. 15 corporate tax receipts. He also reaffirmed his preference for a “clean” debt ceiling increase.

    Trade, SUV’s, Redbook retail sales, Trump and Harvey

    No ‘improvement’ here:

    Highlights

    Third-quarter GDP is off to a slow start, at least for international trade in goods where the July trade gap widened more than $1 billion to $65.1 billion. Exports fell 1.3 percent and were pulled down by a sharp fall in vehicles and also consumer goods which are two weak categories for the US. Helping to ease the effect of exports was a 0.3 percent decline in imports where foreign vehicles, which are usually in strong demand, fell 2.8 percent while industrial supplies were down 1.7 percent. July’s trade report including services will be posted next week.


    Definitely looking up, but, again, might be due to fewer stores?

    House prices, Redbook retail sales, NY Fed survey

    Home prices may be softening, but too soon to tell:

    Highlights

    The FHFA house price index came in at a very soft 0.1 percent increase in June, well short of Econoday’s consensus for 0.5 percent and low estimate of 0.3 percent. This is both good news and bad news, as slowing price appreciation should help affordability for home sales but will also limit growth in household wealth. Despite June’s weakness, year-on-year prices remain very strong, at plus 6.5 percent which is nearly a percentage point above Case-Shiller’s data. Watch on next week’s calendar for June data from Case-Shiller.


    This has definitely come back from the lows, though there are likely fewer stores reporting, and this series is not adjusted for inflation:

    U.S. workers have low hopes for higher pay

    Aug 21 (Reuters) — A New York Fed survey found that on average respondents said in July that the lowest annual salary they would accept in a new job would be $57,960, down from $59,660 only four months earlier. Asked what salary they expected in job offers over the next four months, the average response declined to $50,790 from $54,590 when the last survey was taken in March. The survey also showed 22.7 percent of respondents searched for a job in the last four wees, up from 19.4 percent in the previous report. The respondents saw a 22 percent likelihood of receiving at least one job offer in the next four months, down from an average response of 25 percent eight months ago.

    Retail sales, Import and export prices, Business inventories, Housing index

    The chart still looks weak to me. Shale boom in 2014 pumped it up, and then reversing with the shale bust, and still looking suspect after January when consumer credit further decelerated:

    Highlights

    The consumer was back in the stores last month in a July retail sales report, headlined by a 0.6 percent monthly gain, that not only exceeds top expectations but also includes sizable upward revisions. Nonstore retailers, vehicle dealers, building materials stores lead the report — all major categories. Secondary readings are all strong: up 0.5 percent ex-autos, up 0.5 percent ex-autos ex-gas, and up 0.6 percent for the control group.

    Revisions are prominent in this report with June revised 5 tenths overall to plus 0.3 percent from an initial minus 0.2 percent. And May gets an upward revision too, now unchanged vs minus 0.1 percent.

    One the weakest of all the consumer readings, retail sales are now back into the fold with other indications on consumer spending, which are positive and in line with full employment. Note that the upward revisions to June and May will be positives for second-quarter GDP revisions.

    This measure has flattened recently:


    This looks to me like it’s again working its way lower:


    Looking like the weak $US is translating into deflation abroad rather than inflation at home:

    Highlights

    A boost in petroleum gave a lift to import prices while a boost from agricultural gave a boost to export prices. Import prices in July posted an as-expected 0.1 percent increase as petroleum was up 0.7 percent in the month. Outside of petroleum, however, July import prices limped in at no change. Prices of finished exports remain dead flat, at or near zero whether month-on-month or year-on-year. The yearly rate for overall imports is steady at a modest 1.5 percent.

    Export prices rose a stronger-than-expected 0.4 percent with agricultural products up 2.1 percent to more than shave in half sharp declines in the two prior months. Prices for finished exports, like finished imports, are flat with consumer goods, at minus 1.7 percent year-on-year, especially weak. Total export prices are up only 0.8 percent year-on-year which is not good news for the nation’s exporters.

    But what is good news for exporters is the tangible decline underway in the dollar. This points to increasing pressure for import prices which, though making them less affordable to U.S. buyers, will help the Federal Reserve in its efforts to stimulate inflation.

    Inventories remain excessive and just grew a bit more than sales:

    Highlights

    After a flat start to the second quarter, businesses built up their inventories by a sharp 0.5 percent in June which beats Econoday’s consensus by 1 tenth. The build is centered in wholesale which rose 0.7 percent with inventories among retailers up 0.6 percent in June which, based on this morning’s retail sales report, is a plus going into what proved to be a very strong July for the sector. Factory inventories in June rose 0.2 percent.

    In an uncertain result in the report, the rise in inventories exceeded the 0.3 percent rise in underlying sales to lift the inventory-to-sales ratio 1 tick to a less lean 1.38. This could mean that supply is exceeding demand, or however that businesses are stocking up ahead of what see as better business ahead. Note that the slightly higher-than-expected headline may give a lift to second-quarter revision estimates which are likely to get a more definitive lift from the upward revisions in today’s retail sales report.

    Highlights

    The housing market index joins retail sales and Empire State as major upside surprises this morning, up 4 points to 68 in August which tops Econoday’s high forecast by 2 points. This puts the index back at levels earlier this year and points to building confidence among the nation’s home builders.

    Builders see gains for both present sales, up 4 points to 74, and 6-month sales, up 5 points to 78. Trailing far behind, however, and not showing much pace is traffic still under 50 at 49. Lack of traffic hints at lack of first-time buyers who appear to be getting locked out of the new home market by high prices and lack of supply on the market.

    Regional composite scores show the West, a key region for builders, out in front followed by the South and Midwest which are also both very strong followed in the distance by the Northeast which is flat. This report offers an advance indication for August but won’t be hurting expectations any for tomorrow’s July housing starts and permits report where strength is the call.

    Credit check

    This kind of deceleration has always been associated with recession:


    Bending the curve:


    Actual lending continues to decelerate:

    So for the last 6 months the Fed is seeing a steep decline in credit growth and a softening in price pressures, wage growth, employment growth, auto sales, home sales and permits, retail sales, and personal income. Apart from that things are looking up!
    ;)

    Dodge index, Euro area lending, China investment, Wholesale trade

    This is reflected in the deceleration of commercial real estate lending:

    From Dodge Data Analytics: Dodge Momentum Index Stumbles in July

    The Dodge Momentum Index fell in July, dropping 3.3% to 135.0 (2000=100) from its revised June reading of 139.6. The Momentum Index is a monthly measure of the first (or initial) report for nonresidential building projects in planning, which have been shown to lead construction spending for nonresidential buildings by a full year. The move lower in July was due to a 6.6% decline in the institutional component of the Momentum Index, while the commercial component fell 1.1%.This month continues a recent trend of volatility in the Momentum Index where a string of gains is interrupted by a step backwards in planning intentions.

    Not just the US!


    This is slowing things down as well:

    China’s capital controls apply brakes on ‘go out’ drive

    Aug 9 (Nikkei) — China’s outbound direct investment plunged 46% on the year to $48.1 billion in the six months through June, trailing foreign direct investment of $65.6 billion. Foreign acquisitions, remittances, money exchanges and other outbound transactions of more than $5 million became subject to mandatory pre-screening by regulators starting last November. Regulators also said real estate, hotel, entertainment, film, sports club and other “irrational” overseas investments would be tightly monitored. In June it was learned Chinese bank regulators had told lenders to more strictly examine overseas investments by Dalian Wanda Group, HNA Group and three other major conglomerates.

    Good chance the inventories are ‘unwanted’ due to low sales as retail sales were a lot lower than expected:

    Highlights

    Wholesale inventories rose a sharp 0.7 percent in June in what was a wanted build given a likewise 0.7 percent rise in sales. The stock-to-sales ratio is unchanged at a lean 1.29. If there is an imbalance, it’s inventories of autos which rose 1.4 percent while sales fell 0.5 percent. Otherwise this a very positive report, pointing at the same time to sales growth and inventory growth.

    Inventories still look elevated to me:


    This is the sales chart they think is so good- still short of 2014 levels and this chart isn’t adjusted for inflation:

    Consumer credit

    Less than expected as the deceleration continues. I read this as reflecting a drop in consumer spending.

    The savings rate has been down, and the personal income curve has been bent lower as well, and retail sales have also slowed.

    So it can all be read this way:
    The consumer has less real disposable income, has cut back on spending, and has been ‘forced’ to put some of that reduced spending on his credit card, though less than the prior month, which doesn’t bode well for future spending:

    Highlights

    Though growth in headline consumer credit, at $12.4 billion, came in lower than expected, the component for revolving credit posted another sizable increase, at $4.1 billion vs $6.9 billion in May. This component, which is where credit card debt is tracked, has been on the rise this year raising the question whether financial firms are beginning to lend to less qualified borrowers. Whether or not gains here are good for credit quality, they are a plus for short-term consumer spending. The soft headline in June is due to a lower-than-usual increase in non-revolving credit where growth, at $8.3 billion, is nevertheless substantial. Vehicle financing and student loans are tracked in non-revolving credit.


    Debt service looks historically low so seems this isn’t what’s holding back the consumer:

    Construction spending, Personal income and spending, Vehicle sales

    The chart is consistent with the deceleration in real estate lending as previously discussed:

    Highlights

    June’s construction spending report has much in common with June’s personal income and outlays released earlier this morning: lack of any apparent life. Spending fell an unexpected 1.3 percent in June with a 3 tenths upward revision to May only a minor offset.

    Residential spending in June fell 0.2 percent as a setback for multi-family units offset a respectable 0.3 percent gain for the important single-family category.

    Private nonresidential spending inched 0.1 percent higher though public components all show sharp declines including highways & streets. Manufacturing was weak on the private side though offices, among the few consistently strong components in this report, did post a 2.9 percent gain for a year-on-year increase of 12.6 percent.

    Year-on-year rates are mixed with single-family up 9.0 percent but multi-family up only 0.6 percent. Overall spending is up only 1.6 percent. Housing data have been hit and miss all year with the second-half likely turning on permits which, after a run of declines, did show life in June.

    Econintersect analysis:

  • Growth decelerated 3.0 % month-over-month and up 1.2 % year-over-year.
  • Inflation adjusted construction spending down 0.1 % year-over-year.
  • 3 month rolling average is 3.3 % above the rolling average one year ago which is a 1.8 % deceleration month-over-month. As the data is noisy (and has so much backward revision) – the moving averages likely are the best way to view construction spending.
  • Backward revision for the last 3 months were strongly downward

  • % change from a year ago:

    Personal income is also decelerating in line with the credit aggregates:

    Econintersect analysis:

    Analyst Opinion of Personal Income and Expenditures

    This is an annual update month, and everything seems to have been revised downward.

    Consumer spending with this revision shows it is far outpacing income – not good news. And the savings rate has been significantly revised downward.

    Inflation grew this month.

    The backward revisions this month SIGNIFICANTLY affected the year-over-year rate of growth for income and expenditures.

    Personal income was revised up $8.5 billion, or 0.1 percent, in 2014; $94.5 billion, or 0.6 percent, in 2015; and revised down $58.0 billion, or -0.4 percent, in 2016.

    For 2014, revisions to personal income and its components were generally small, and primarily reflecteda $21.6 billion downward revision to nonfarm proprietors’ income that was partly offset by a $15.8 billion upward revision to personal dividend income.
    For 2015, the revision to personal income primarily reflectedupward revisions of $68.7 billion to personal dividend income and $64.5 billion to personal interest income that were partially offset by a downward revision of $71.7 billion to nonfarm proprietors’ income.
    For 2016, the revision to personal income primarily reflectedan upward revision of $100.8 billion to personal interest income that was more than offset by downward revisions of $94.3 billion to compensation of employees and $91.0 billion to nonfarm proprietors’ income.

    June 2017 Headline Personal Income Unchanged. Very Weak Data.

    Interesting how goods sales were down so much after the initial q2 data showed a large increase for goods sales,
    perhaps indicating a downward revision:

    Highlights

    It’s hard to detect much life in any part of the personal income & outlays report. Income couldn’t muster a gain in June, coming in unchanged with May revised 1 tenth lower to a 0.3 percent gain. Consumer spending did make the plus column but with only a 0.1 percent gain though May gets a 1 tenth upgrade to 0.2 percent. Price data are flat, unchanged in the month with the core rate (less food and energy) up 0.1 percent for a second weak month in a row. Year-on-year, overall prices are up only 1.4 percent with the core little better at 1.5 percent.

    The weakness in income, at least for June, isn’t due to weakness in wages & salaries which rose 0.4 percent following, however, only a 0.1 percent gain in May. Propreitor income fell in the month with interest income flat and rental income and transfer receipts up. The breakdown for spending shows a second straight 0.3 percent gain for the largest component which is services but 0.4 percent declines for both durable and non-durable goods.

    What little spending did appear in June may have come from savings, at least slightly, as the savings rate fell 1 tenth to a thin 3.8 percent rate. There are plenty of jobs in the economy but wage growth is sub par and with it both consumer spending and inflation are flat. These results do not point to much consumer momentum going into the third quarter.

    The lower savings rate indicates people have been ‘overspending’ based on their incomes,
    even as consumer borrowing has been decelerating, all of which translates into spending reductions:


    Yet another weak month as the deceleration continues:

    Highlights

    Vehicles have declined in 4 of the last 5 retail sales reports but there may be at least some hope for July as unit sales edged higher to a 16.7 million annualized rate overall and a 13.2 million rate for domestic made. But there’s a fair warning: unit sales, which also include sales to businesses as well as consumers, don’t always translate neatly into dollar sales. Domestic cars and imported light trucks showed the most life in the month.

    GDP, Consumer sentiment, Rail traffic, Vehicle sales, Credit check

    Up as expected though way down from initial forecasts as data deteriorated, and q1 was revised lower. More q2 data will be released over the next month when the first revision will be released. Consumer spending up vs prior quarter (but down year over year) even as consumer credit numbers decelerate, with ‘goods’ contributing over 1% to growth. Residential investment fell, in line with the deceleration in real estate lending, as did auto related spending, in line with decelerating auto related lending.

    So with the decelerating lending reports somehow not seemingly reflecting a similar deceleration in total spending, there is either some other source of credit expansion I’m missing, or q2 will ultimately be revised a lot lower.

    Highlights

    The second quarter was healthy, growing at an as-expected 2.6 percent annualized rate with the consumer spending component also healthy and as expected, at a 2.8 percent rate. Business investment, at 5.2 percent, was once again very strong and offset a bounce lower for residential investment which fell at a 6.8 percent rate. Inventories were slightly negative for the quarter while net exports improved and proved a slight positive. Government purchases added slightly to the quarter. Inflation was very weak, at only a 1.0 percent rate. The core is similar, at 1.1 percent and down from 2.4 percent in the first quarter.

    Turning back to consumer spending, durables were very strong at 6.3 percent despite the quarter’s weakness in vehicle sales. Nondurables rose 3.8 percent which is also strong and coming despite weakness in gasoline prices. Pulling down the consumer component was service spending, up a moderate 1.9 percent.

    Benchmark revisions are included in the report, having little overall effect over the last 3 years but pulling down full-year 2016 slightly, by 1 tenth to 1.5 percent, and also the first-quarter by 2 tenths to 1.2 percent. There are no surprises in this report, one consistent with solid growth but also underscoring this year’s unexpected trouble for inflation.

    Large gain in ‘goods’ sales pushed up GDP by about 1% in this first release:

    Personal Income (table 10)

    Current-dollar personal income increased $118.9 billion in the second quarter, compared with an
    increase of $217.6 billion in the first quarter (revised). The deceleration in personal income primarily
    reflected decelerations in wages and salaries, in government social benefits, in nonfarm proprietors’
    income, and in rental income, and downturns in personal interest income and in farm proprietors’
    income. These movements were offset by an upturn in personal dividend income.

    Disposable personal income increased $122.1 billion, or 3.5 percent, in the second quarter, compared
    with an increase of $176.3 billion, or 5.1 percent, in the first quarter (revised). Real disposable personal
    income increased 3.2 percent, compared with an increase of 2.8 percent.

    Personal saving was $546.8 billion in the second quarter, compared with $553.0 billion in the first
    quarter (revised). The personal saving rate — personal saving as a percentage of disposable personal
    income — was 3.8 percent in the second quarter, compared with 3.9 percent in the first.

    These ares inflation adjusted and so are directly influenced by the deflator calculation.


    From Morgan Stanley. Note comments about how some of the data is generally associated only with recessions. And I’m not so sure inventories will reverse, as retail sales, for example, have generally been decelerating:

  • Inventories subtracted fractionally from Q2 growth v. our +0.7pp expectation after cutting 1.5pp from Q1. In real dollar terms, inventory accumulation was close to zero in both Q1 and Q2, the lowest back-to-back quarters outside of recessions since 1986. Final sales (GDP ex inventories) gained 2.6% in Q2, better than our 2.4% forecast, and final private domestic demand (consumption and business and residential investment combined) grew 2.7%, matching our expectation.
  • Consumption picked up to 2.8% from an upwardly revised 1.9% in Q1 (previous surprising weakness in Q1 was largely smoothed out as seasonal factors were updated in annual revisions), business investment gained 5.2% on top of a 7.1% Q1 gain, residential investment fell 6.8% as supply-side restraints hurt after an 11.1% Q1 gain, and government spending rose 0.7% after a 0.6% drop, as federal spending rebounded to offset a further drag from state and local infrastructure investment. Within business investment, equipment was surprisingly strong, accelerating to 8.2% growth from 4.4% in Q1, turning higher after a 3.7% drop in 2016, one of the worst nonrecession years ever. The drilling rebound also continued, boosting mining investment to a 117% gain on top of 272% rise in Q1. Ex mining structures investment was weak dropping 9%, a third straight decline with more weakness to come based on our non-resi permits tracker. Intellectual property products investment also slowed on less robust growth in R&D investment largely.
  • The synchronized global growth recovery that’s taken hold this year and a little bit of early impact of the weaker dollar (which would be expected to have a maximum impact one to two years out) helped boost exports to a 4.1% gain on top of a 7.3% rise in Q1, putting 2017 on pace for the best annual result since 2013. With imports up a more muted 2.1%, net exports added 0.2pp to GDP growth after also adding 0.2pp in Q1, a big improvement from persistent drags through 2014-16 that averaged -0.5pp a quarter.
  • Core PCE came in at 0.9% Q/Q annualized, a terrible result to be sure, but higher than the 0.7% implied by previously reported April and May monthly numbers and expectations for June based on the CPI and PPI reports. That should result in the year/year pace in June (which will be reported Monday) coming in at 1.5% instead of our previous expectation of 1.4%.
  • When savings desires can’t be met spending suffers and distressed voters respond:


    Fading:

    Highlights

    Consumer sentiment edged higher the last two weeks of this month, producing a final reading of 93.4 vs 93.1 at mid-month. Still, the result is noticeably lower from June’s 95.1 and reflects weakening in expectations, down 3.4 points to 80.5, that contrasts with strengthening in the current assessment, up nearly 1 point to 113.4. The report warns that this divergence hints at a shift lower for current conditions and the total index in the months ahead. Inflation expectations remain very subdued, at 2.6 percent for both the 1-year and 5-year outlooks.

    This report has been moving south in contrast to the consumer confidence report which has been holding firm at 17-year highs. But throwing the weekly consumer comfort index into the mix, which has also been moderating, points to slightly less optimism than earlier in the year.


    Note how the red line has stopped improving and flattened:


    Still looking ominous:


    You can see here how much more lending there would have been had the growth not suddenly flattened last November: