
Lawler: Expect Downward Revisions to Census Q4 New Home Sales, Broad-Based Builder Optimism for 2014
Category Archives: Housing
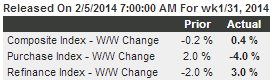
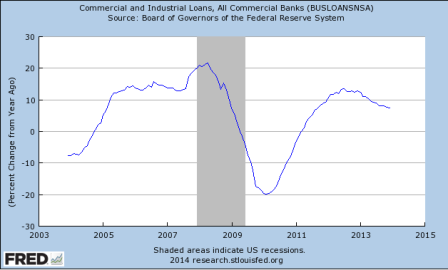
Homeless economy- mtg purchase apps down again
Highlights
The purchase index continues to weaken, down 4.0 percent in the January 31 week and down a very sizable 17 percent year-on-year. This signals weakness for underlying home sales and underscores the importance of all cash buyers in the housing market. A move lower for mortgage rates didn’t help the purchase index but did help the refinance index which rose 3.0 percent in the week. The average rate for 30-year mortgages with conforming loan balances ($417,500 or less) fell 5 basis points to 4.47 percent.
PMI, ISM, Construction Spending, car sales preview
Might be a reversal in out sized +1.3 contribution to GDP from exports coming?
And EM and yen currency weakness not helping US exports, while US earnings translations also getting hurt.

Highlights
Growth in composite activity slowed a bit last month for Markit’s US manufacturing sample where the PMI posted a final January reading of 53.7, unchanged from the flash reading at mid-month and down 1.3 points from final December.
Weakness in order readings is the key negative in the January report. Monthly growth in new orders slowed 2.1 points from final December to 53.9 which, nevertheless, is a respectable rate. The other two order readings in the sample, however, moved below 50 and into contraction in the month with new export orders at 48.4 for a 3.0 point loss and backlog orders down 3.6 points to 49.2.
Lack of orders points to weakness ahead for output where growth already slowed markedly in January, down 4 points to 53.5. Lack of orders is also a negative for employment which fell 8 tenths to 53.2.
Inventory readings show noticeable draws that suggest manufacturers, looking down the road at weakness in new orders, aren’t actively restocking, while price readings show marginal and easing pressure. The easing in price pressures is important to note at this time of year, suggesting that manufacturers aren’t getting much price traction yet for beginning-of-year price increases.
Most readings on manufacturing began to improve until late in the fourth quarter with today’s report not pointing to any rebound at the beginning of the first quarter. Watch later this morning on the Econoday calendar for the closely watched ISM report which has been consistently offering some of the strongest readings of all on the manufacturing economy.
Still positive, but maybe moving back to the ‘pre inventory building’ pace of the last few reports?
The bad news is centered, unfortunately, in new orders which are down a very steep 13.2 points to 51.3. This is one of the largest monthly declines on record. If there is solace, it’s that the plus-50 rate of 51.3 rate still points to monthly growth, just at a much much slower pace than December.
And new export orders fell a point here as well.
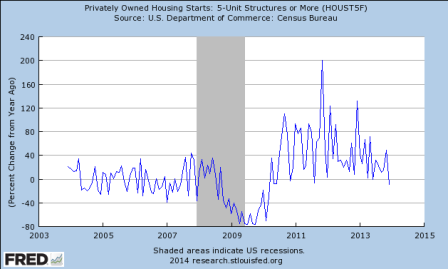
Chart looking very tame, even with housing strength which may be the expiring year end tax credit thing:
Strength was in private residential outlays which jumped 2.6 percent in December, following a 1.1 percent rise the month before.
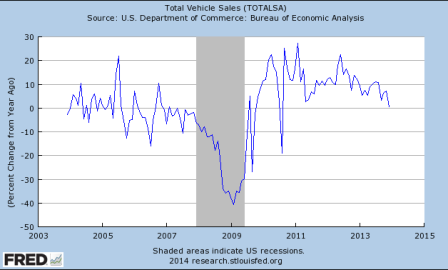
GM car sales down, with GM now estimating only a 15.3 million annual rate of total vehicle sales for Jan vs 15.4 in Dec.
Final numbers later today:
Growing Pains
FLASH- Fed to taper another $10 billion
Maybe they are concerned about all the interest income they are removing from the economy?
;)
General comments:
For GDP to grow at 3% all the pieces have to ‘average’ 3% growth
And if anything is growing at a slower pace than last year, something else has to grow at a faster pace or GDP growth slows.
So the growth rate of car sales has slowed and is expected to slow further this year:
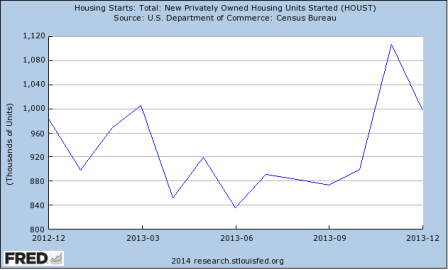
How about housing?

Pending home sales year over year change:
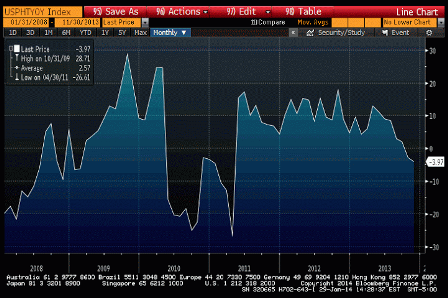
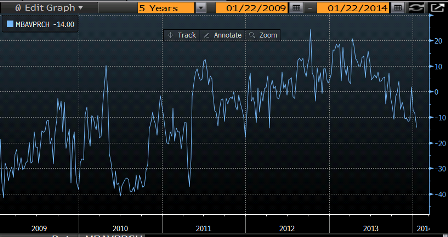
New mortgage applications to purchase homes:
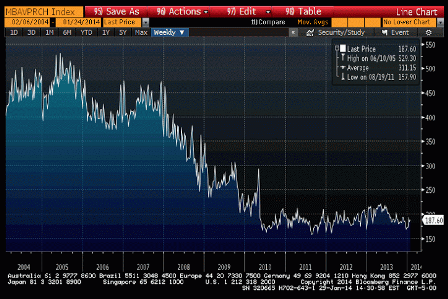
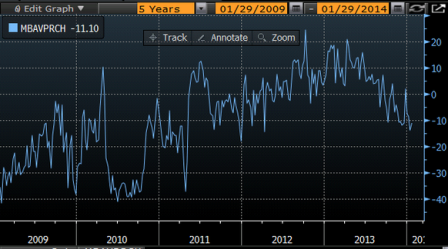
Purchase apps year over year:
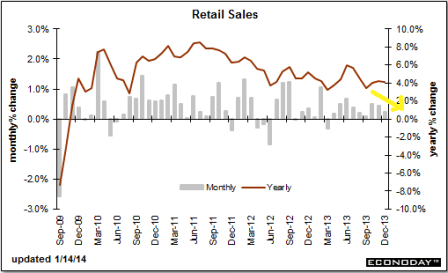
Retail sales growth has been generally slowing and has yet to show signs of increasing:
How about orders for durable goods?
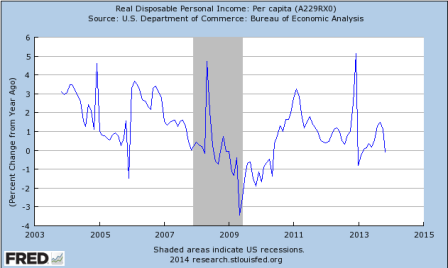
Is the income growth there to support higher levels of spending?
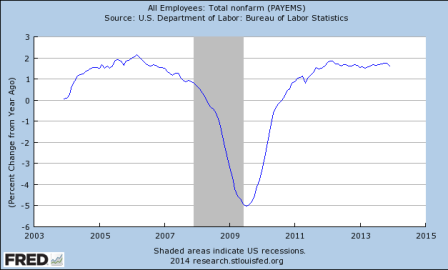
Is the growth rate of employment increasing?
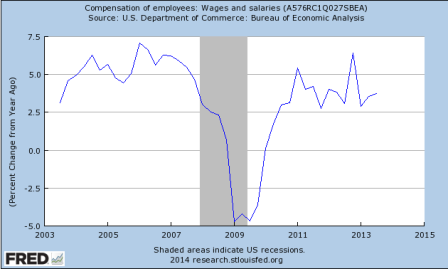
Compensation?
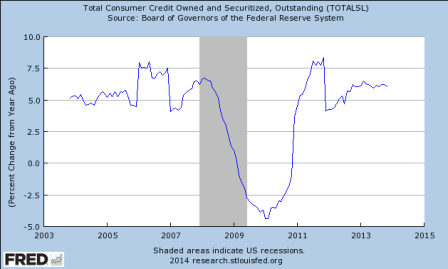
Maybe consumers are somehow borrowing to spend at a higher rate?
How about the foreign sector?
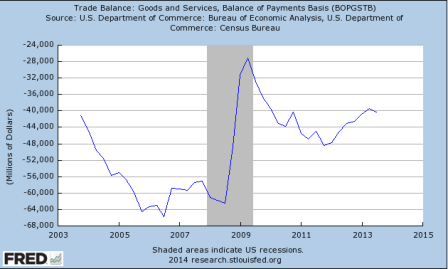
Well, it was helping, but we need the rate of change to increase to have more of an impact than last year. And with GDP around $17 trillion, last year’s rate of increase has to be exceed by about $7 billion/mo to add an additional .5 to GDP. And the substantial currency depreciation of the EM’s isn’t going to help any.
Just saying, something big needs to start growing a lot just to keep GDP growth positive?
So what happened to growth?
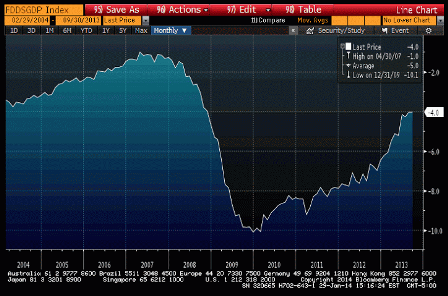
Private sector spending (including non residents) in excess of income may no longer be keeping up with the reduction in the federal govt’s spending in excess of its income (deficit spending spending)?
Maybe the federal deficit is too low for current credit and financial conditions?
Deficit as a % of GDP through Sept 13. It’s even lower currently:
new home sales
Who would have thought that with purchase apps down 10% year over year sales would fall?
So seems like borrowers aren’t stepping up to the higher mortgage rates demanded by lenders fearful of future fed rate hiking?
That means the economy stalls and the Fed doesn’t hike?
Highlights
New home sales had been a bright spot in the housing sector — but not any more. Sales of new homes nose dived in December, to a 414,000 annual rate that’s below the low end estimate of Econoday’s consensus. More bad news comes from downward revisions that total 30,000 in the prior two months.
The drop in sales gave a lift to supply, at least supply relative to sales which is at 5.0 months vs 4.7 months in November. But the total number of new homes on the market actually fell, down 5,000 to an adjusted 171,000.
High prices are no doubt a factor behind the sales weakness but not a pronounced factor. The median price rose 0.6 percent to $270,200 with the year-on-year rate very modest at plus 4.6 percent which is right in line with the plus 4.6 percent year-on-year rate for sales.
Bad weather may have played a factor in December’s disappointment but heavy weather is common to all Decembers. Unattractive mortgage rates and the still soft jobs market appear to be holding down housing noticeably. On Thursday, watch for pending home sales data which track initial contract signings for sales of existing homes. The Dow is little changed following today’s results.

And note the downward slope of the last three prints:
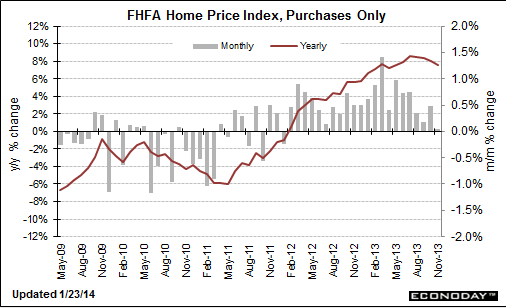
FHFA Home Price Index
wrko Interview And Expiring Tax Extenders Recap
Warren Mosler on the Economy
Main provisions Expiring:
Housing credits- low income credits, deductible mortgage premiums
Energy Efficient Residential construction/appliances
Energy Efficient Commercial buildings/construction
Renewable Energy construction/production credits- notably wind
These may all have caused Q4 jumps in construction etc. Quarterly/monthly data for energy efficient construction and renewable production is not available for comparison, figures are usually collected annually.
Other things that stick out:
Alternative/Renewable fuels credit- Will probably see decrease in production
Research and experimentation credit
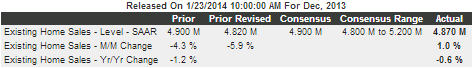
existing home sales, jobless claims
Highlights
Sales of existing homes bounced back in December from a very weak November but not by much, at plus 1.0 percent for a slightly lower-than-expected annual rate of 4.87 million units.
The outlook for future sales is not good, at least based on available supply of homes on the market which fell sharply to 4.6 months from 5.1 months in November. Rising prices are another negative for the sales outlook, up 1.3 percent for the median to $198,000. At plus 9.9 percent, the year-on-year rate for the median price contrasts sharply with the year-on-year sales rate of minus 0.6 percent.
I’m not yet saying claims have bottomed, but can’t say they haven’t either
At a lower-than-expected 326,000 in the January 18 week, initial jobless claims, which at year-end were not signaling improvement in the labor market, are now signaling at least some improvement. The Econoday consensus had been looking for 330,000. The 4-week average is down 3,750 to 331,500 which is more than 10,000 lower than the month-ago comparison to offer an indication of strength for the January employment report.
But in a partial offset, continuing claims are not coming down. Continuing claims, which are reported with a 1-week lag, rose 34,000 in the January 11 week to 3.056 million for a second straight reading over 3.0 million. Continuing claims had held below 3.0 million through the second half of last year. The 4-week average is up 31,000 in the week to 2.939 million which is the highest reading since August. The unemployment rate for insured workers, which had been as low as 2.1 percent in November, is steady for a second straight week at 2.3 percent.
purch apps y/y and weekly retail indicator comments
No sign of life in mortgage purchase applications this week, so still a disconnect with the November surge in housing starts. I’m guessing expiring tax credits may have moved some starts from Q1 to Q4:
Purchase applications Y/Y:
Full size image
Full size image
Highlights
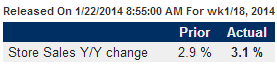
Cold weather is making for a slow start to consumer spending this year, indicated not only by weak readings in recent consumer sentiment measures but also by the weekly chain-store reports. Redbook reports a very soft plus 3.1 percent year-on-year pace for same-store sales in the January 18 week following an even more depressed plus 2.9 percent rate in the prior week. Indications from ICSC-Goldman, released earlier this morning, are even weaker.
Zip Realty
From the Zip Realty conference call yesterday:
ZipRealty Announces Preliminary 2013 Results
Lanny Baker, Chief Executive Officer and President of ZipRealty, commented, “Throughout 2013, our primary financial objective was to accelerate ZipRealty’s revenue growth while delivering positive Adjusted EBITDA for the full year. We made strong operational progress in support of those objectives during the year, however real estate sales in our markets slowed more sharply than expected during the fourth quarter, and our relative momentum was not strong enough to completely offset that change. As a result, our fourth quarter revenue was below the outlook we provided previously.”
The total value of real estate transactions in the metropolitan areas that ZipRealty serves grew by 9% year to year in the fourth quarter, compared to a 22% year to year growth rate in the first nine months of the year. The total value of ZipRealty’s real estate transactions declined by 4% year to year in the fourth quarter, compared to an 8% growth rate in the first nine months of the year.
“The results and outlook we are providing today do not match the more ambitious long-term objectives we have for ZipRealty, yet recent trends in real estate transaction activity within our owned and operated markets point to a more modest growth outlook for 2014. Consumer home search activity appears to have slowed this winter, and recent industry data shows lower pending sales and mortgage applications compared to a year ago. However, ZipRealty has increased the size of its agent force by 13% in the past year and has also released upgrades to its technology platform that are intended to aid customer acquisition and agent productivity. Meanwhile, the Powered by Zip unit continues to attract new brokerage customers and agents to its digital platform and will remain a central strategic priority in 2014 and beyond.