Employment, Construction, ISM manufacturing, Chicago Fed

The slow motion train wreck continues unabated and when employment goes bad, it all goes bad:

Highlights

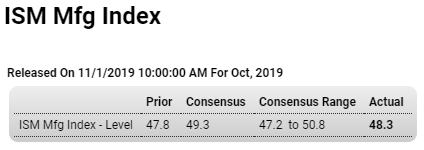
On the low side of expectations but not at increasing rates of contraction are the results of ISM’s manufacturing report for October. At 48.3, the index missed Econoday’s consensus by 1 point but gained a 1/2 point from September. New orders improved nearly 2 points in October but, at 49.1, are still under breakeven 50. New export orders, however, improved markedly, up more than 9 points and back over 50 at 50.4. Yet total backlogs are a major weakness for ISM’s sample, down another point and in deep contraction at 44.1.

Elsewhere contraction is roughly as deep as September, including production down nearly a point to 46.2 and employment up 1.4 points but still under 50 at 47.7. The sample drew down their raw material inventories but less so than September while, in a sign that capacity constraints are minimal, supplier delivery times posted a rare outright decline in the month. Given the indication from delivery times, the prices paid index is not surprisingly pointing to lower prices, down more than 4 points to 45.5.

The good news in this report is the rise in export orders, a move confirmed by the PMI manufacturing report which was released earlier this morning. Yet overall conditions are still very soft and are not pointing to any year-end acceleration for a sector that has been holding back the 2019 economy and where export-related trouble has helped trigger three straight rate cuts from the Federal Reserve.

Rails, Trade, Chicago Fed, Dallas Fed

Deep contraction:

Highlights

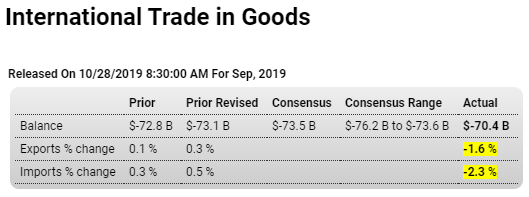
The good news is that the trade deficit in goods narrowed sharply in September to a much lower-than-expected $70.4 billion, but the bad news is both exports and imports, in an indication of economic slowing, fell sharply. Exports dropped 1.6 percent in the month for year-on-year contraction of 3.0 percent, showing an oversized 12.6 percent monthly decline in foods, feeds & beverages that will raise talk of issues with China. Exports of autos were also down sharply, down 7.2 on the month in what may be tied in part to the GM strike which began mid-month September. Imports fell 2.3 percent on the month with this year-on-year decline at a steep 4.6 percent, with consumer goods falling 5.0 percent in the month and with capital goods down 2.3 percent and vehicles down 3.5 percent.

Imports are a negative for the GDP calculation and today’s results, where the decline in imports outstrips the decline in exports, will give a lift to third-quarter GDP estimates (data to be posted this Wednesday). But more fundamentally the results speak of slowing US demand and will not be giving a lift to overall assessments of economic growth, whether domestic or international. Note that bilateral country data aren’t broken out in the advance goods release but will be posted in next week’s trade report that will include services.

Comfortably below 0:


Also back in negative territory:

Durables, Manufacturing employment, US composite PMI, Euro area manufacturing

The global collapse continues unabated:

Highlights

An emphatically weak set of durable goods headlines for September raises the alarm for the health of the manufacturing sector while unexpectedly substantial contraction in capital goods orders deepens specific questions on the outlook for business investment. Durable goods orders fell a monthly 1.1 percent in September, on its face significantly weak but roughly near expectations in contrast to ex-transportation orders which fell 0.3 percent to just make the bottom end of Econoday’s consensus range. Well below the bottom of expectations is a 0.5 percent drop in core capital goods orders (nondefense ex-aircraft), one intensified by a downward revision to August which now shows a 0.6 percent monthly decline that followed no better than no change in July.

Turning back to the headline, an 11.8 percent decline in commercial aircraft is a key negative for September but no surprise for a component, reflecting the Boeing 737 Max grounding, that has been struggling badly this year. Reflecting the GM auto strike is 1.6 percent decline in motor vehicle orders and a 1.5 percent decline in related shipments.

Breaking down capital goods orders, weakness appears to be concentrated in fabrications, down 1.5 percent in the month, and computers which fell 0.9 percent. Machinery actually rose 0.2 percent in the month but benefited from an easy comparison following 0.3 percent and 1.0 percent declines in the prior two months. Communications equipment, like machinery, also rose in September but following steep declines in prior months.

Shipments for core capital goods fell 0.7 percent in September following no change in August and another 0.7 percent decline in July. These three results will be part of the third-quarter GDP mix for nonresidential investment, a component that may well be on a descent and one the Federal Reserve may well tie to weakening global demand for high-end US goods. Today’s results increase the force of those on the FOMC who are pushing for continued rate cuts, including perhaps at next week’s meeting.

Other readings of note include another weak showing for total unfilled orders, at no change, and a 0.4 percent dip for total shipments that follows declines in both August and July. Likely reflecting weakness in shipments is a sharp and perhaps unwanted build in total inventories of 0.5 percent in September.


Up a bit for the month but the trend still looking lower:


Deep into contraction:

France, Inventory cycle, Unemployment benefits, Architectural billings

Never seen so many charts that look pretty much like this:

Much harder to get this cycle means that unemployment and benefits as defined are lower than otherwise, and that the counter cyclical stabilizing effect has been disabled:

Most Unemployed People In 2018 Did Not Apply For Unemployment Insurance Benefits

from the Bureau of Labor Statistics

In 2018, 77 percent of the unemployed people who had worked in the previous 12 months had not applied for unemployment insurance benefits since their last job. Of the unemployed who had not applied, 3 out of 5 did not apply because they did not believe they were eligible to receive benefits.

Still below 50 which means contraction, and still trending lower:

Housing starts, Industrial Production, Q3 GDP

Fell back this month after last month’s spike from the drop in rates and still looking to me like it’s going nowhere from historically depressed levels, and not population adjusted:

Highlights

Upward trajectory is the theme of housing starts and permits, in data where September’s headlines don’t always tell the fundamental story. Housing starts came in at a 1.256 million annual rate in September that falls not only well short of expectations but also August which is revised higher to 1.386 million. But behind the headline is a small gain, to 918,000, for single-family starts. These pack more GDP punch per unit than multi-family starts which dropped a very sharp 28.2 percent to 338,000. The three-month average for single-family starts is up very sharply, at 901,000 for the 5th straight increase.

Permits for single-family homes are keeping pace with starts, at 882,000 in the month with this three-month average up 20,000 to 862,000 for a fourth straight increase. Total permits dipped back to 1.387 million reflecting a sharp fall in multi-units to 505,000.

Year-on-year, single-family starts are up 4.3 percent with single-family permits up 2.8 percent. These are solid positives for residential investment which, after six straight quarters of pulling GDP lower, may yet contribute positively to third-quarter GDP. But the weakness in multi-family units is a risk for residential investment with starts here down 5.1 percent on the year though permits, in what points to emerging strength and only temporary weakness for starts, up a very sharp 17.4 percent.

A negative in today’s report is decline in completions, down for single-family and multi-units in results that will limit immediate improvement for new home sales. But this report, especially the monthly gains for single-family data and the year-on-year gain for multi-unit permits, does point to the possibility that the housing sector, struggling to move higher as it has all year, may begin to contribute to economic growth.


The global collapse continues:

Highlights

After a strong August, industrial production fell back more sharply than expected in September with year-on-year rates especially betraying the report’s generally weakening trends. Pulled down by manufacturing, industrial production fell a monthly 0.4 percent in September and double the expected contraction. Manufacturing volumes fell 0.5 percent, nearly double the expected decrease and reflecting wide declines across readings including a 4.2 percent monthly drop for motor vehicles, significantly reflecting the GM strike, and a 0.7 percent decline for business equipment.

The report’s two smaller components were mixed with utilities rising 1.4 percent in September but mining falling 1.3 percent. Mining had been enjoying two years of exceptional strength in this report but has since faded. Year-on-year, mining volumes are up a moderate 2.6 percent with utilities up 1.2 percent.

The trouble for manufacturing, which is being held down by weakening demand for US exports, is framed convincingly by 0.9 percent year-on-year contraction in this report. Vehicle production is down 5.4 percent on the year and improvement may be slow based not only the risk of an extended GM strike but also on yesterday’s retail sales report where vehicles sales were a major negative. Business equipment is another negative, down 0.8 percent on the year which won’t be giving the hawks at the FOMC much strength in their arguments to limit further rate cuts. Weakness in business equipment, the result of falling business expectations, is a central concern, if not the central concern, for monetary policy makers.

GDP continues to decelerate:

The economy probably only grew 1.5% in Q3 amid consumer weakness, CNBC tracker shows

Retail sales, Business inventories

Weak income and employment growth tends to coincide with weak retail sales growth, as the global trade collapse continues:

Highlights

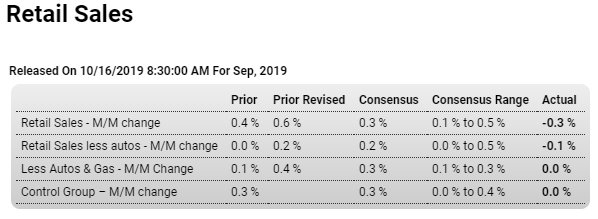
The consumer cooled but not enough to not knock back a still rising trend for retail sales which in September fell an unexpected 0.3 percent. All the breakdowns also came in well below expectations including a 0.1 percent dip when autos (one of September’s weaknesses) are excluded and no change when also excluding gasoline.

Perhaps the best gauge to this report is the control group, which is part of the GDP mix and which came in flat. Limiting the unwelcome message from September is a revision to the upside for August, up an additional 2 tents to 0.6 percent, and also a look at the total year-on-year rate which did ease 3 tenths in September to 4.1 percent that, next to August’s 4.4 percent, is still the second best rate since October last year.

Auto sales (in contrast to a rise in previously reported unit sales) fell 0.9 percent though this does follow a 1.9 percent jump in August. Year-on-year growth for autos did slow, down 1.4 percentage points yet to a still favorable 5.6 percent. Gasoline sales, held down by low prices, once again pulled down total sales, falling 0.7 percent in the month after August’s 1.3 percent drop.

Nonstore retailers (dominated by e-commerce) are also in the negative column in September, down a monthly 0.3 percent though year-on-year growth continues to easily top all categories at 12.9 percent. Building materials fell 1.0 percent in September while general merchandise fell 0.3 percent. One of the positive showings is by apparel stores at 1.3 percent and furniture stores at 0.6 percent. Restaurants posted a 0.2 percent monthly gain for very respectable yearly growth of 4.9 percent that, like yearly growth in auto sales, underscores the fundamental strength of the consumer.

Today’s report will limit expectations for the third-quarter contribution from consumer spending, which nevertheless remains favorable and the central underpinning for economic growth. For the Federal Reserve, consumer slowing could make policy more vulnerable to the slowdown underway in global demand and the US manufacturing sector, and in turn strengthen the arguments of the doves who are pushing for more rate cuts.

Highlights

Businesses are holding back inventory growth as sales growth stalls. Total inventories were unchanged in August against only a 0.2 percent rise in sales, a modest mismatch that isn’t enough to move the inventories-to-sales ratio which held unchanged at a lean and favorable 1.40.

Inventories relative to sales look stable right across components with retailers showing the only change and that’s downward, with this ratio a bit more lean at 1.44 versus 1.45 in July.

When it comes to production and employment, nimble inventory management helps smooth out disruptions from economic ups and downs, yet however positive this may be for general economic health a slowing inventory build does hold down GDP growth.

Annual sales growth is negative:


Inventories remain elevated: