2008-09-25 USER


[Skip to the end]


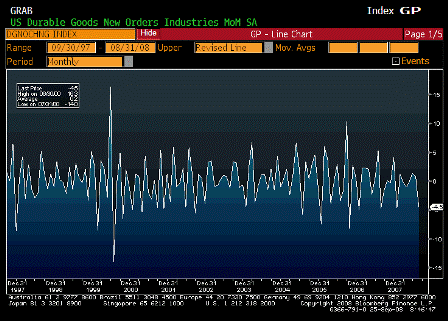
Durable Goods Orders MoM (Aug)

Survey -1.9%
Actual -4.5%
Prior 1.3%
Revised 0.8%

 
A very volatile series

Way lower than expected, and prior revised down as well.
[top][end]

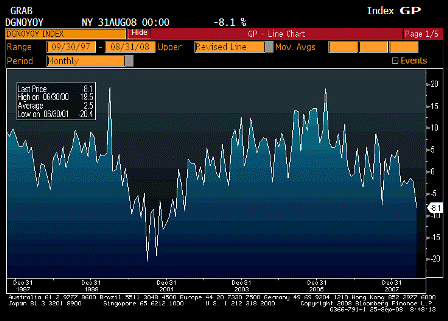
Durable Goods Orders YoY (Aug)

Survey n/a
Actual -8.1%
Prior -2.2%
Revised n/a

 
Continuing its downward drift that started about a year ago.
[top][end]

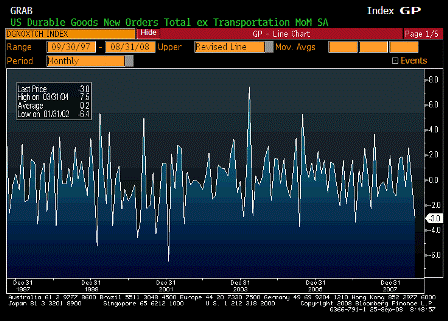
Durables Ex Transportation MoM (Aug)

Survey -0.5%
Actual -3.0%
Prior 0.7%
Revised 0.1%

 
It wasn’t all transportation. This is also lower than expected, and the prior month revised lower.
[top][end]

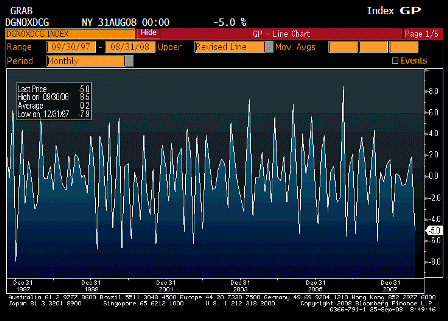
Durables Ex Defense MoM (Aug)

Survey n/a
Actual -5.0%
Prior 1.9%
Revised n/a

 
The jump in defense kept the total from being even worse.
[top][end]

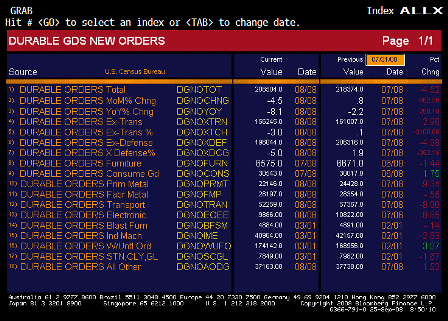
Durable Goods ALLX (Aug)

 
Consumer goods and defense, the only bright (modest) spots.
[top][end]


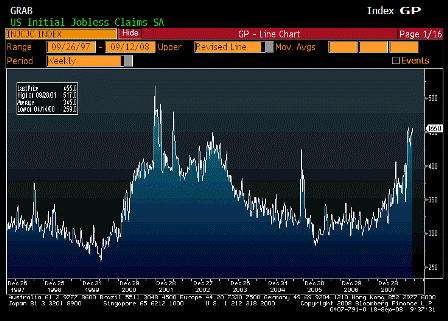
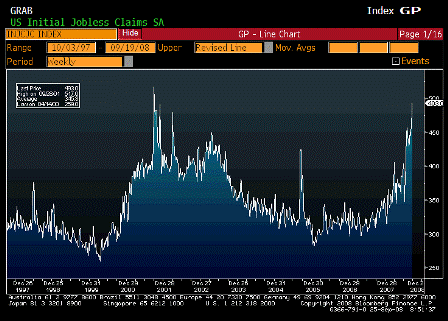
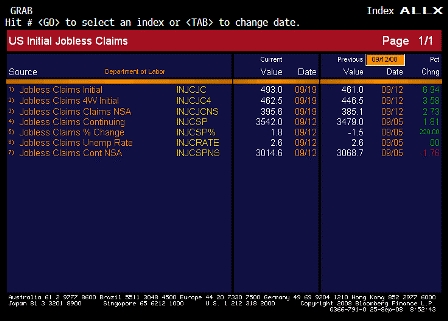
Initial Jobless Claims (Sep 20)

Survey 450K
Actual 493K
Prior 455K
Revised 461K

 
A large spike up. Government estimated 50,000 due to the hurricanes; so, it would have been 430,000. This will take a few weeks to sort out.
[top][end]

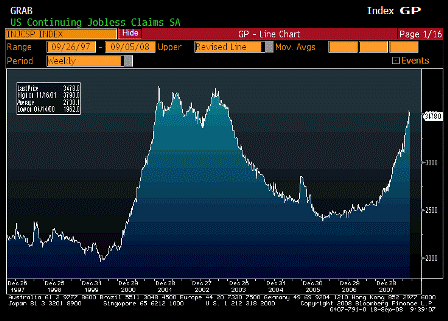
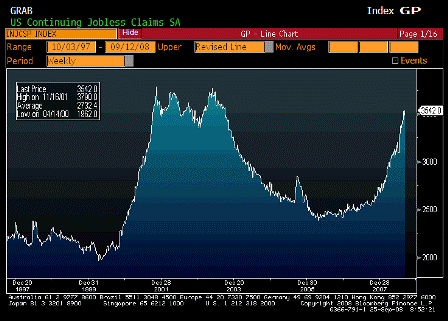
Continuing Jobless Claims (Sep 13)

Survey 3510K
Actual 3542K
Prior 3478K
Revised 3479K

 
This just keeps going up towards recession levels. No telling how much extended benefits has added, both now and in the last recession.
[top][end]

Jobless Claims ALLX (Sep 20)

[top][end]


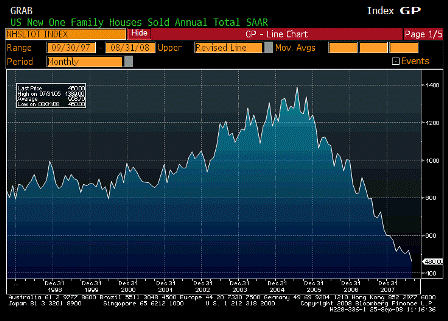
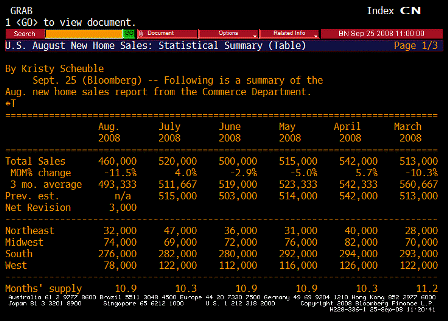
New Home Sales (Aug)

Survey 510K
Actual 460K
Prior 515K
Revised 520K

 
Lower than expected, and last month revised up as suspected. They’ve been revising previous months up for a while.

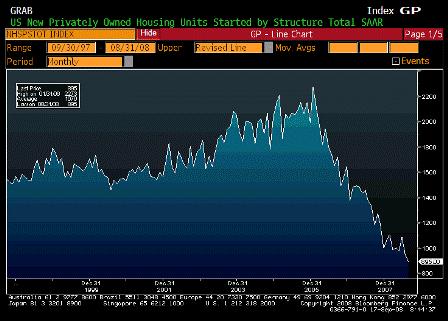
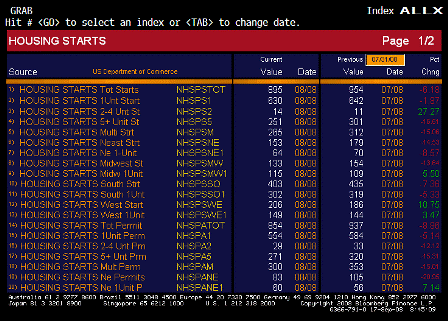
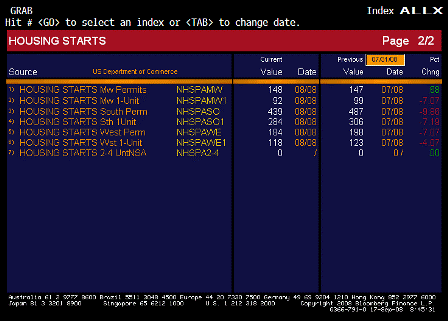
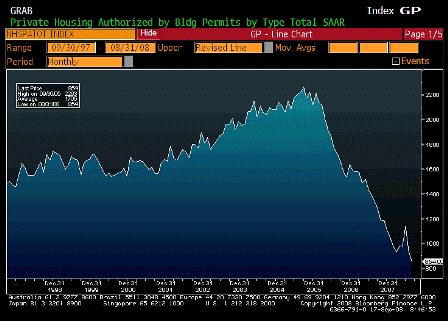
There may be a problem with availability of desirable homes, as starts are down by 1 million per year, and inventories are down as well.
[top][end]

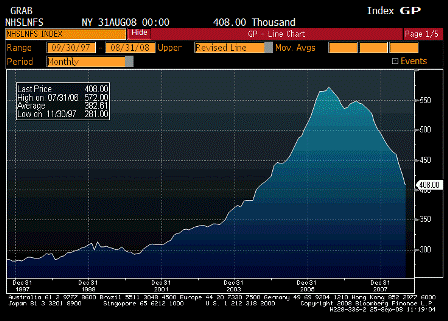
New Home Sales- Total For Sale (Aug)

Survey n/a
Actual 408.00
Prior 427.00
Revised n/a

 
This continues to fall rapidly and should lead to a shortage in the next few months.
[top][end]

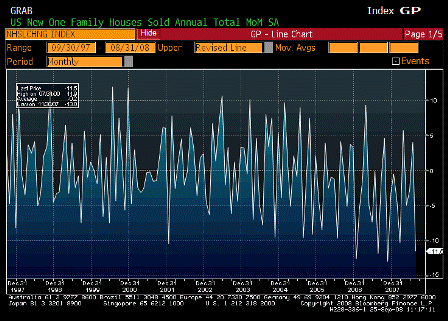
New Home Sales MoM (Aug)

Survey -1.0%
Actual -11.5%
Prior 2.4%
Revised 4.0%

 
Lower than expected and prior month revised up.
[top][end]

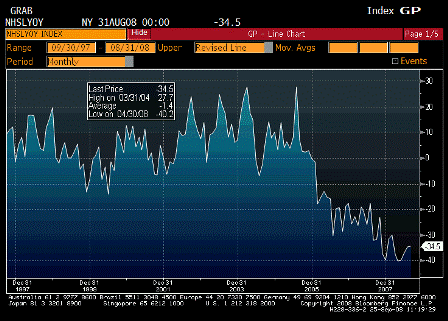
New Home Sales YoY (Aug)

Survey n/a
Actual -34.5%
Prior -34.7%
Revised n/a

 
Down a lot but signs of bottoming.

[top][end]

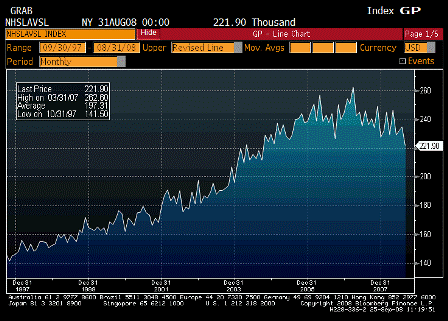
New Home Sales Median Price (Aug)

Survey n/a
Actual 221.90K
Prior 234.90K
Revised n/a

 
Still drifting lower but so far not collapsing.
[top][end]

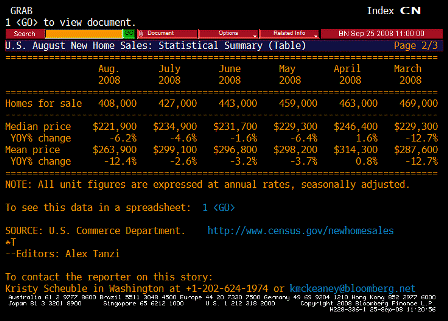
New Home Sales TABLE 1 (Aug)

 
Something happened in the west.
[top][end]

New Home Sales TABLE 2 (Aug)

 
Karim writes:

  • Quite weak data that is leading to downward revisions to Q3 and Q4 GDP estimates. Q3 revisions about -½% that I have seen, some GDP estimates now coming in below 1%.

  • The shipments data is more highly correlated to current quarter growth.
  • -3.5% m/m headline, -2.1% ex-transport, -3.6% ex-defense.
  • Orders data more problematic for Q4.
  • -4.5% m/m headline, -3% ex-transport, -5% ex-defense.
  • Fairly broad-based weakness across sectors as well.

  • Capex had been holding up fairly well this year, but now looks as if retrenching; with private consumption likely to be weak and Bernanke signaling an export slowdown, not too many pillars of support left for the economy. Look for more fiscal stimulus and rate cuts.


[top]

2008-09-24 USER


[Skip to the end]


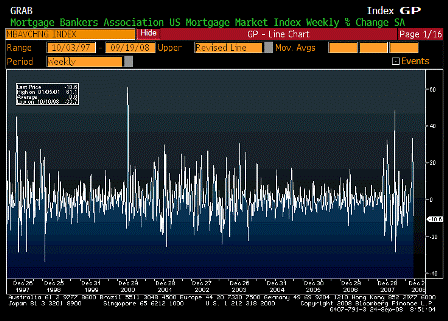
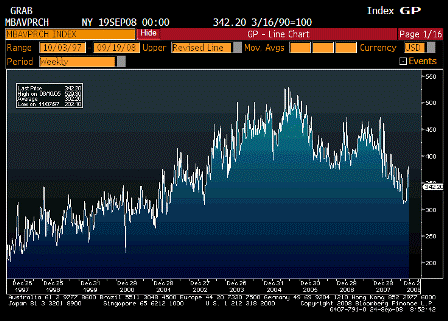
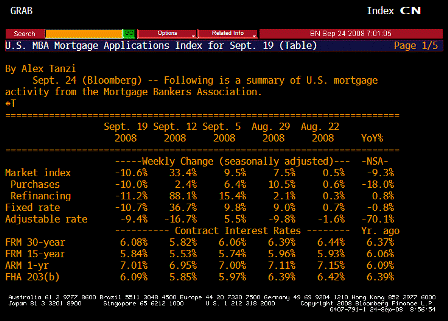
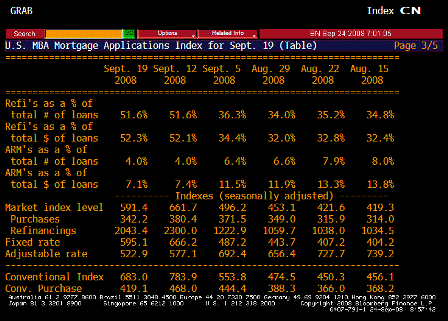
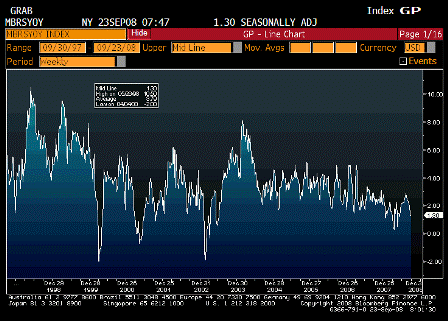
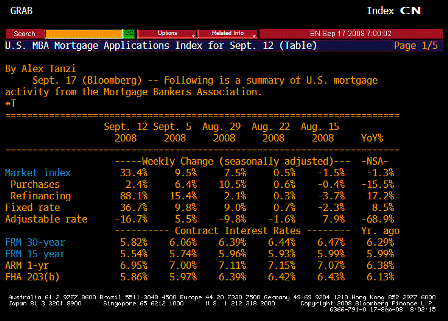
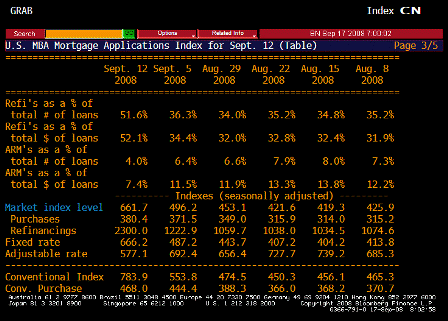
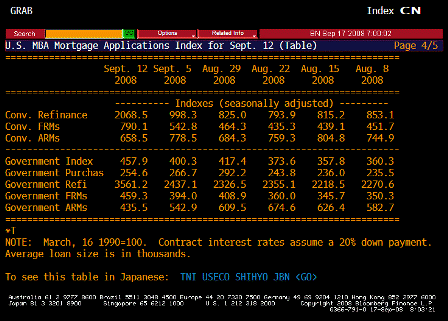
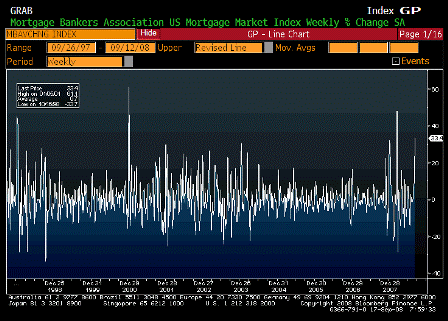
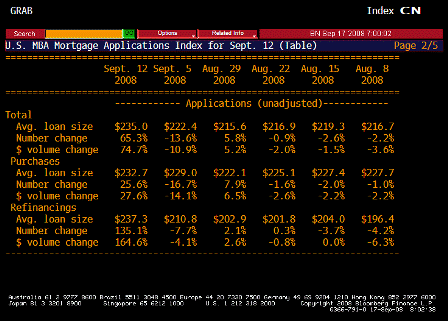
MBA Mortgage Applications (Sep 19)

Survey n/a
Actual -10.6%
Prior 33.4%
Revised n/a

 
The MBA index of loan requests for home purchases fell 10 percent to 342.2.

Not good, but down from a larger spike last week, and still well above the lows.

Housing still looks to have bottomed albeit from very low levels.

[top][end]

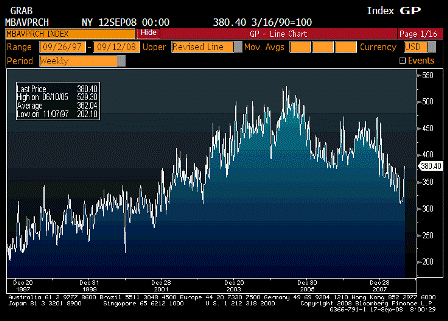
MBA Mortgage Purchasing (Sep 19)

Survey n/a
Actual 342.2
Prior 380.4
Revised n/a

 
A move down after a larger spike up, still off the bottom.

[top][end]

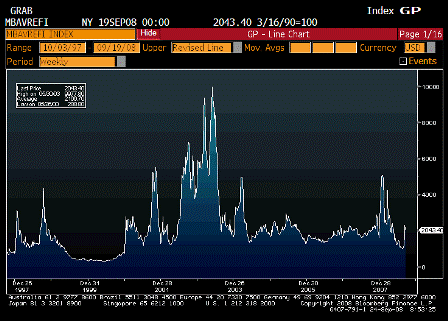
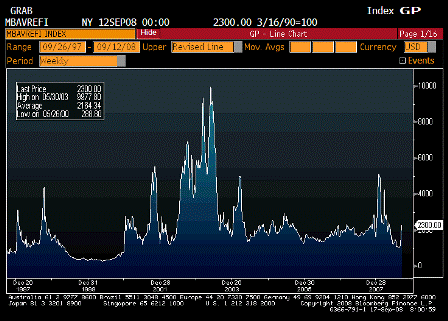
MBA Mortgage Refinancing (Sep 19)

Survey n/a
Actual 2043.4
Prior 2300.0
Revised n/a

[top][end]

MBA Mortgage Applications TABLE (Sep 19)

[top][end]

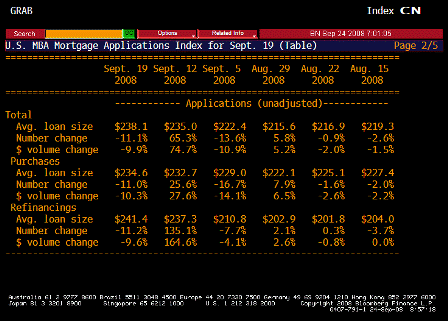
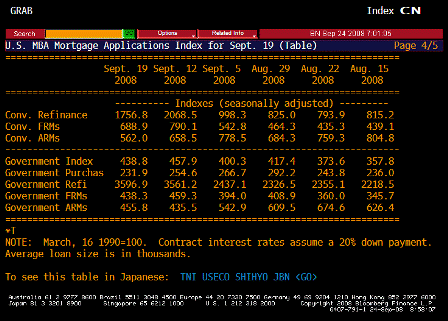
MBA Mortgage Applications TABLE 2 (Sep 19)

[top][end]

MBA Mortgage Applications TABLE 3 (Sep 19)

[top][end]

MBA Mortgage Applications TABLE 4 (Sep 19)

[top][end]


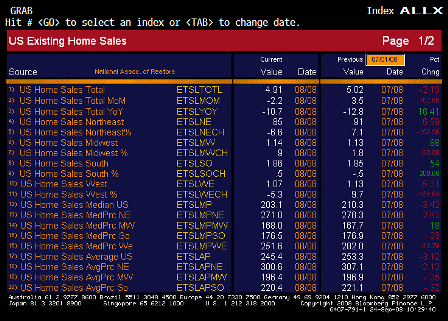
Existing Home Sales (Aug)

Survey 4.94M
Actual 4.91M
Prior 5.00M
Revised 5.02M

 
A bit worse than expected, prior revised up a bit. Still looks like it’s past the bottom.

[top][end]

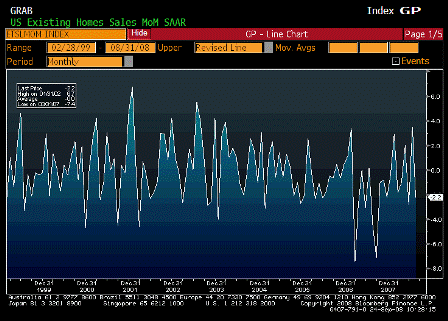
Existing Home Sales MoM (Aug)

Survey -1.2%
Actual -2.2%
Prior 3.1%
Revised 3.5%

 
Also worse than expected, and last month revised up.

[top][end]

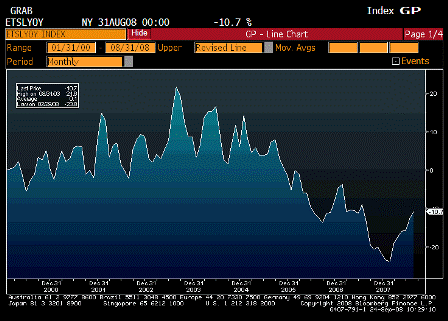
Existing Home Sales YoY (Aug)

Survey n/a
Actual -10.7%
Prior -12.8%
Revised n/a

 
Declines still dimishing.

[top][end]

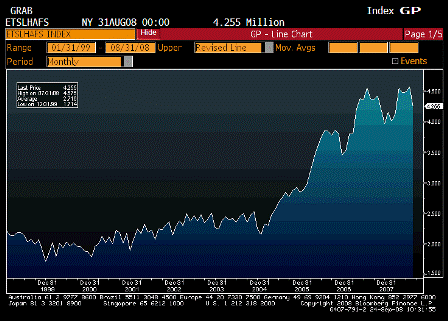
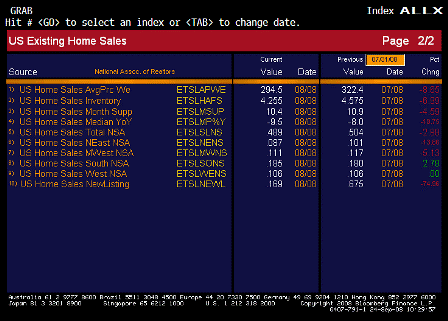
Existing Home Sales Inventory (Aug)

Survey n/a
Actual 4.255M
Prior 4.575M
Revised n/a

 
Good size drop as foreclosures get liquidated.
Along with plunging new home inventories and a lot of existing homes not livable, it looks to me like supply is starting to get thin.

[top][end]

Existing Home Sales ALLX 1 (Aug)

[top][end]

Existing Home Sales ALLX 2 (Aug)


[top]

2008-09-23 USER


[Skip to the end]


ICSC-UBS Store Sales YoY (Sep. 23)

Survey n/a
Actual 1.3%
Prior 1.3%
Revised n/a

 
Holding steady off the lows.

[top][end]

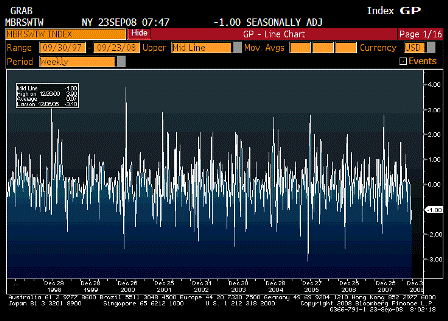
ICSC-UBS Store Sales WoW (Sep 23)

Survey n/a
Actual -1.00%
Prior -1.60%
Revised n/a

[top][end]

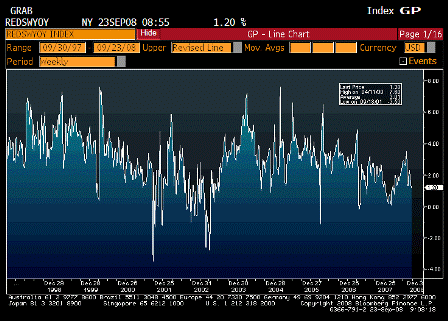
Redbook Store Sales Weekly YoY (Sep 23)

Survey n/a
Actual 1.2%
Prior 1.4%
Revised n/a

 
Steady and off the lows as well.

[top][end]

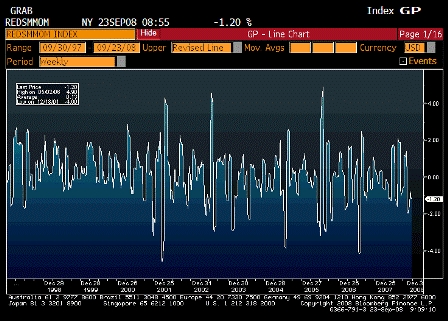
Redbook Store Sales MoM (Sep 23)

Survey n/a
Actual -1.20%
Prior -1.10%
Revised n/a

[top][end]

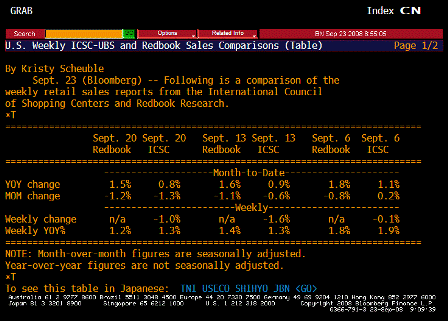
ICSC-UBS Redbook Comparison TABLE (Sep 23)

[top][end]


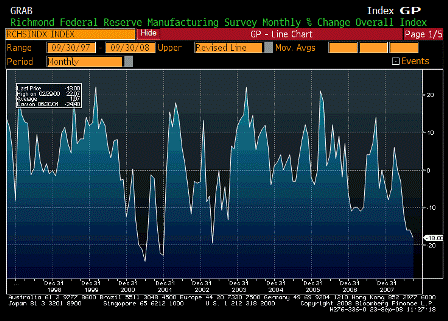
Richmond Fed Manufacturing Index (Sep)

Survey -12
Actual -18
Prior -16
Revised n/a

 
Worse than expected and looking very weak.

[top][end]

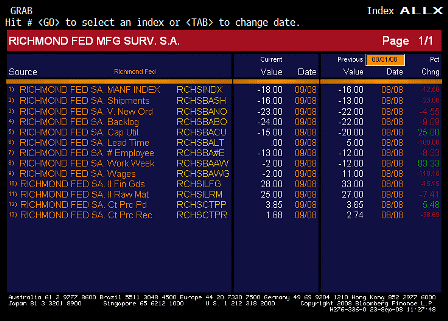
Richmond Fed Manufacturing Index ALLX (Sep)

[top][end]


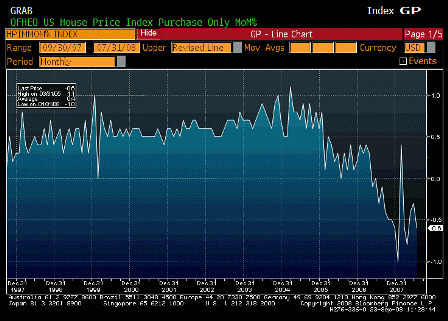
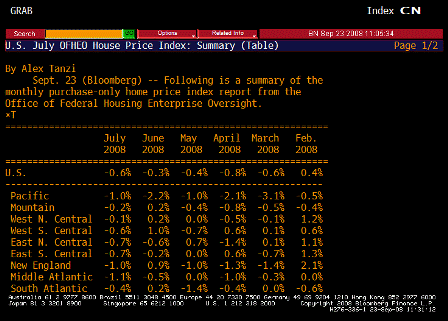
House Price Index MoM (Jul)

Survey -0.2%
Actual -0.6%
Prior 0.0%
Revised -0.3%

 
Weaker than expected but still off the lows and seems to be working it’s way irregularly higher.

[top][end]

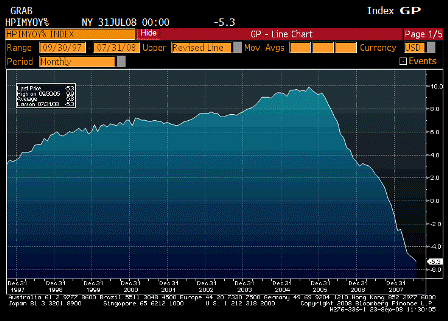
House Price Index YoY (Jul)

Survey n/a
Actual -5.3%
Prior -5.0%
Revised n/a

 
Losing 5.3% year over year is a lot for this index.

[top][end]

House Price Index TABLE (Jul)


[top]

2008-09-18 USER


[Skip to the end]


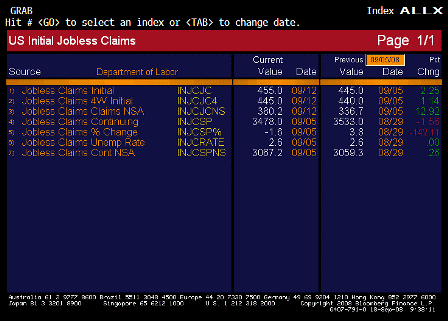
Initial Jobless Claims (Sep 13)

Survey 440K
Actual 445K
Prior 445K
Revised n/a

 
Staying at the top of the new range since the extended benefit package went into force. And might be a touch high due to the hurricane.

[top][end]

Continuing Jobless Claims (Sep 6)

Survey 3525K
Actual 3478K
Prior 3525K
Revised 3533K

 
Down a bit and better than expected but still on the high side.

[top][end]

Jobless Claims ALLX (Sep 13)

[top][end]


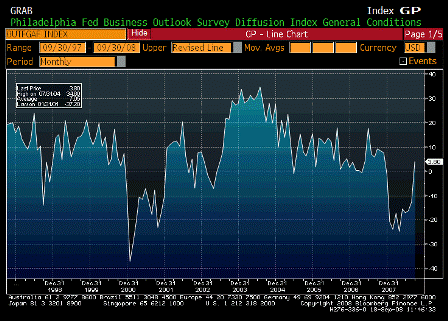
Philadelphia Fed (Sep)

Survey -10.0
Actual 3.8
Prior -12.7
Revised n/a

 
Back to positive territory with an upside surprise.

[top][end]

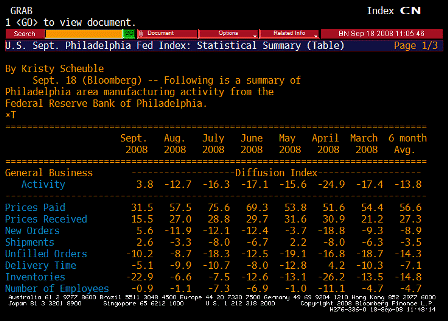
Philadelphia Fed TABLE (Sep)

[top][end]

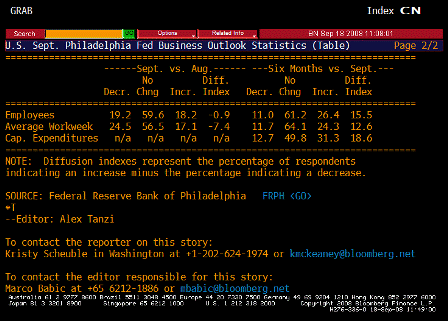
Philadelphia Fed TABLE 2 (Sep)

[top][end]

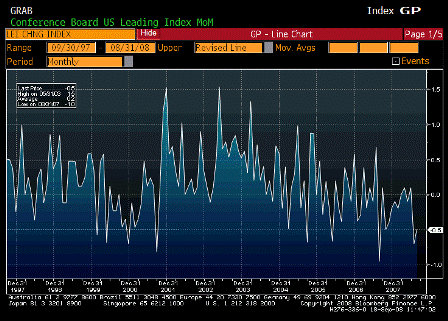
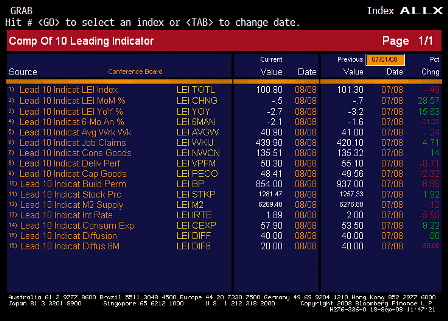
Leading Indicators (Aug)

Survey -0.2%
Actual -0.5%
Prior -0.7%
Revised n/a

 
Leading indicators down more than expected. This is largely a financial conditions indicator.

[top][end]

Leading Indicators ALLX (Aug)

<

Karim writes:

  • Initial claims rise 10k to new cycle of 455k but DOL states Gustav-related claims helped boost weekly rise.

  • 4wk avg rises to 445k from 440k.

  • Continuing claims fall 55k to 3478k, partially reversing prior weeks large 129k increase.

  • 4wk average of continuing rises from 3431k to 3461k.

  • Even if initial claims would have been lower ex-Gustav, recent trends in both IJC and CC reflect a faster pace of labor market deterioration.

  • Next month’s payrolls likely to be down more than 100k.


  • Activity index rises from -12.7 to 3.8.

  • Prices paid drop from 57.5 to 31.5.

  • Orders and shipments rise 17.5 and 5.9pts, respectively, both into modest positive position.

  • Employment component basically unch at -0.9.


[top]
2008-09-16 USER


[Skip to the end]


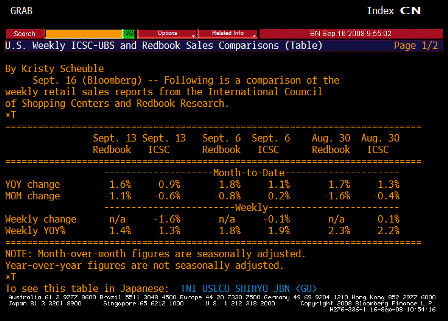
ICSC-UBS Store Sales WoW (Sep 16)

Survey n/a
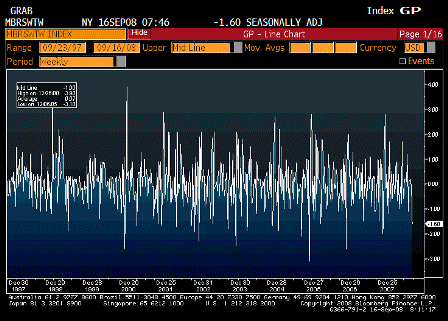
Actual -1.6
Prior -0.1
Revised n/a

 
Not a good sign, but partially seasonal (see year over year below). Shoppers getting scared by the financial sector again?

[top][end]

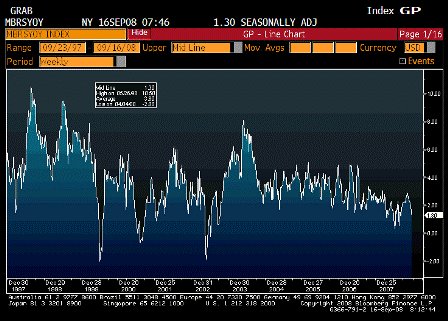
ICSC-UBS Store Sales YoY (Sep 16)

Survey n/a
Actual 1.30
Prior 1.90
Revised n/a

 
Down a bit, but still positive.

[top][end]


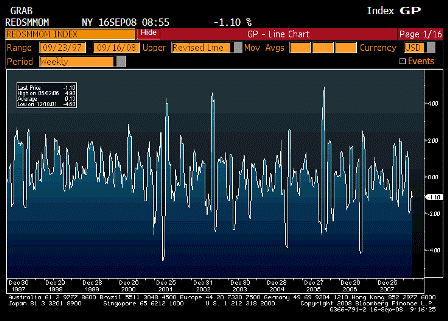
Redbook MoM (Sep 16)

Survey n/a
Actual -1.10
Prior -0.8
Revised n/a

 
Same, down some but somewhat seasonal (see year over year).

[top][end]

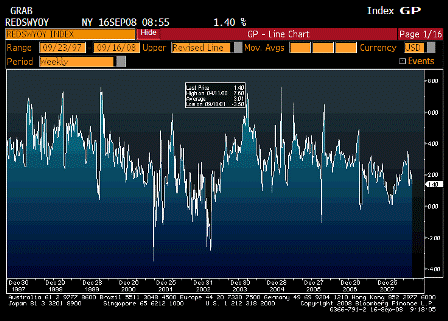
Redbook Weekly YoY (Sep 16)

Survey n/a
Actual 1.40
Prior 1.80
Revised n/a

 
Down some but still positive and off the bottom.

[top][end]

ICSC-Redbook Comparison TABLE (Sep 16)

[top][end]


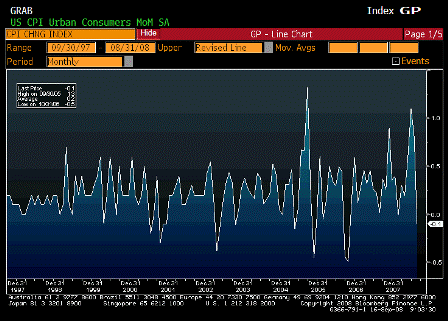
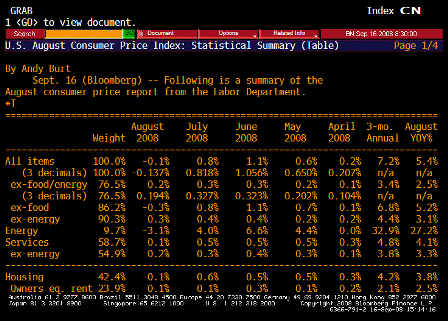
Consumer Price Index MoM (Aug)

Survey -0.1%
Actual -0.1%
Prior 0.8%
Revised n/a

 
Down only a tenth even with the big drop in commodities.

[top][end]

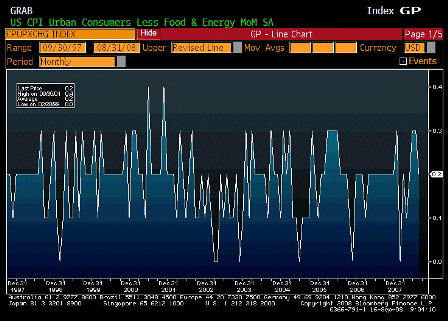
CPI Ex Food and Energy MoM (Aug)

Survey 0.2%
Actual 0.2%
Prior 0.3%
Revised n/a

 
No let up here but this lags headline.

[top][end]

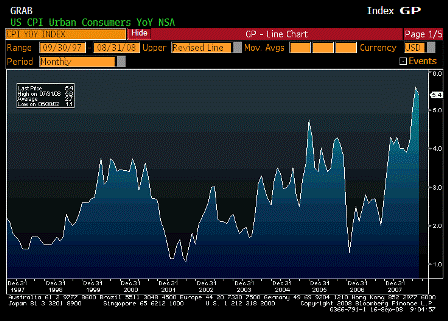
Consumer Price Index YoY (Aug)

Survey 5.5%
Actual 5.4%
Prior 5.6%
Revised n/a

 
Not much of a drop here as crude fell last august as well.

[top][end]

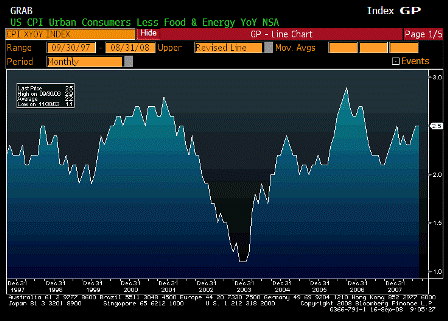
CPI Ex Food and Energy YoY (Aug)

Survey 2.6%
Actual 2.5%
Prior 2.5%
Revised n/a

 
Way above the Fed’s target and comfort zone

[top][end]

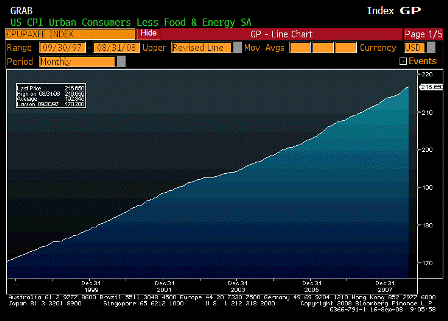
CPI Core Index SA (Aug)

Survey n/a
Actual 216.650
Prior 216.230
Revised n/a

[top][end]

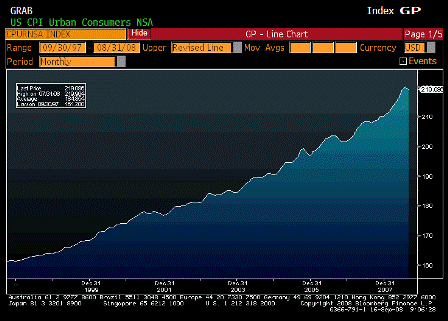
Consumer Price Index NSA (Aug)

Survey 219.300
Actual 219.086
Prior 219.964
Revised n/a

[top][end]

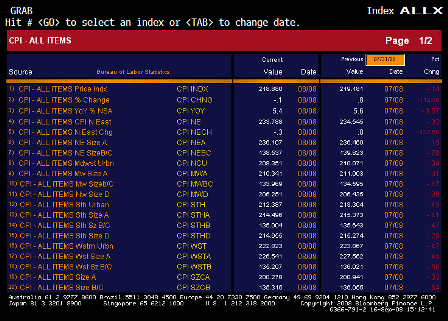
Consumer Price Index ALLX 1 (Aug)

[top][end]

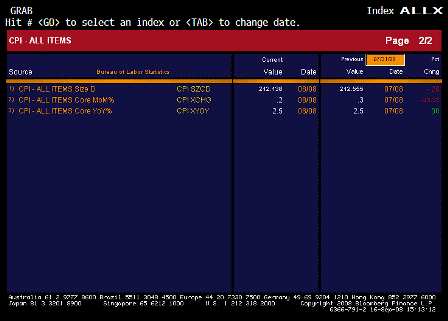
Consumer Price Index ALLX 2 (Aug)

[top][end]

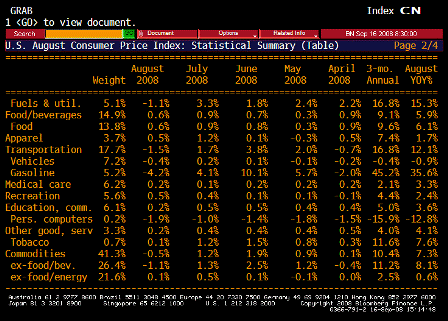
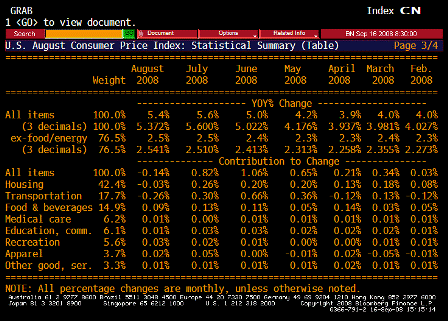
Consumer Price Index TABLE (Aug)

[top][end]

Consumer Price Index TABLE 2 (Aug)

[top][end]

Consumer Price Index TABLE 3 (Aug)

[top][end]


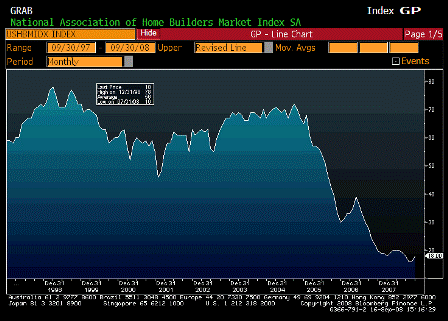
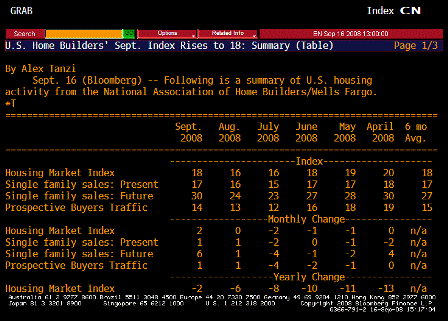
NAHB Housing Market Index (Sep )

Survey 17
Actual 18
Prior 16
Revised n/a

 
A touch better than expected, perking up a bit, but still very low historically and could spring back quickly with the agencies back in action.

[top][end]

NAHB Housing Market Index TABLE (Sep)

[top][end]

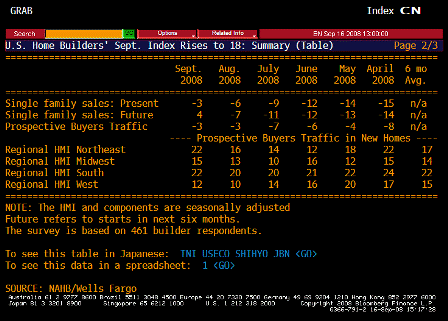
NAHB Housing Market Index TABLE 2 (Sep)

 
Future sales looking pretty good.

[top][end]


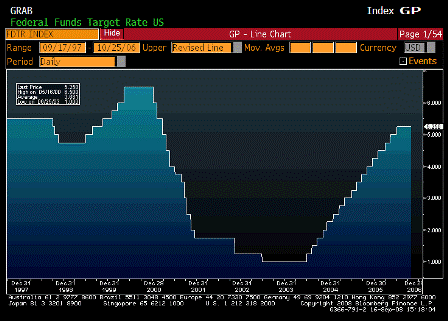
FOMC Rate Decision (Sep 16)

Survey 2.00%
Actual 2.00%
Prior 2.00%
Revised n/a

 
Wonder if Fisher cut a deal not to dissent for the Hawkish inflation language

Karim writes:

Headline CPI -0.137% m/m and core CPI up .194% m/m

  • Trending items stayed on trend (OER +0.1% and medical +0.2%)

  • Volatile items a bit of a wash

  • Recreation (+0.5) and apparel (+1.0%) higher than normal

  • Lodging away from home (-1%) lower than normal

Fed view likely reinforced that decline in commodity prices plus growing economic slack, especially in labor market, will dampen inflation into 2009.

  • Decision (no cut) may be hawkish relative to expectations, but wording mostly dovish.

  • 1st paragraph- All changes highlight downside risks to growth; slowing export growth a new wrinkle in addition to the usual financial market strains, labor market weakness and housing.

  • 2nd paragraph-Identical to prior except mention of inflation expectations has been dropped; so a downgrading of concern over inflation.

  • 3rd paragraph-‘Stand ready to act’ but no mention of ‘in a timely manner’.

  • Fisher dropped his dissent.


[top]
2008-09-15 USER


[Skip to the end]


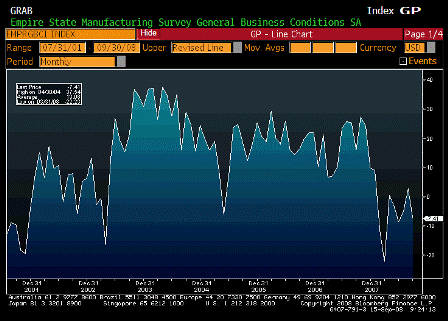
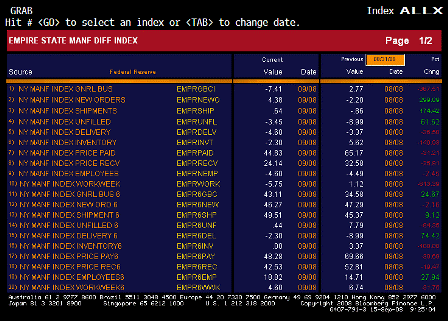
Empire State Manufacturing Survey (Sep)

Survey 1.0
Actual -7.4
Prior 2.8
Revised n/a

 
Down and worse than expected but still off the lows.

[top][end]

Empire State Manufacturing Survey ALLX 1 (Sep)

 
Employees and new orders up, while prices paid and received numbers moderated.

[top][end]

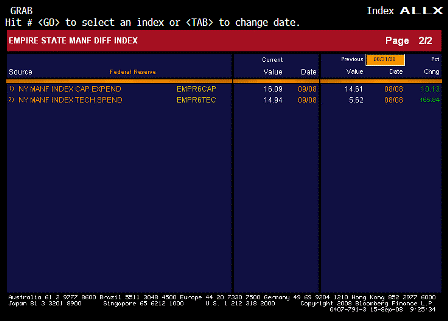
Empire State Manufacturing Survey ALLX 2 (Sep)

 
Capex and Tech spending up.

[top][end]


Industrial Production MoM (Aug)

Survey -0.3%
Actual -1.1%
Prior 0.2%
Revised 0.1%

 
A lot worse than expected and prior month revised down.

[top][end]

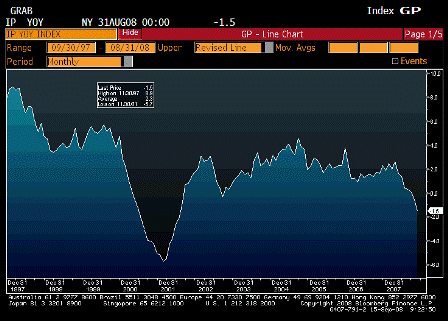
Industrial Production YoY (Aug)

Survey n/a
Actual -1.5%
Prior -0.4%
Revised n/a

 
Not looking good. Ex autos still down .6 month over month.


[top]
2008-09-12 USER


[Skip to the end]


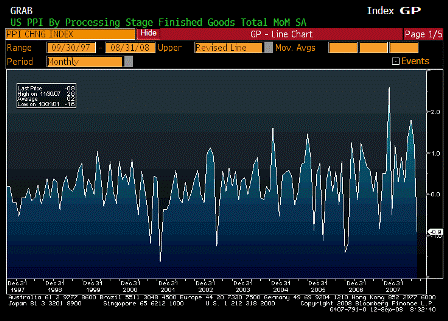
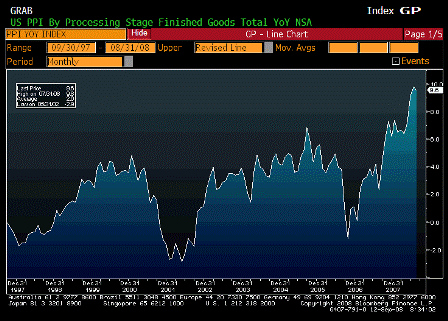
Producer Price Index MoM (Aug)

Survey -0.5%
Actual -0.9%
Prior 1.2%
Revised n/a

 
A welcome drop for the Fed but only wipes out part of last month’s gain.

[top][end]

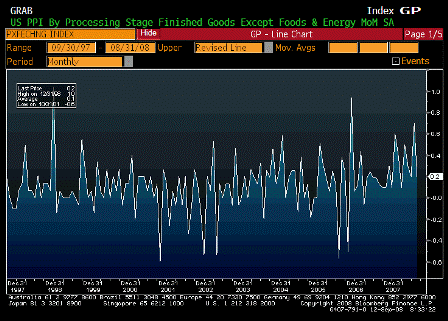
PPI Ex Food and Energy MoM (Aug)

Survey 0.2%
Actual 0.2%
Prior 0.7%
Revised n/a

 
Again, moderating a bit, but the two month average is still very high.

[top][end]

Producer Price Index YoY (Aug)

Survey 10.2%
Actual 9.6%
Prior 9.8%
Revised n/a

 
Still sky high.

[top][end]

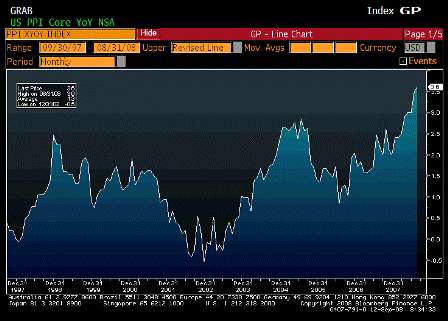
PPI Ex Food and Energy YoY (Aug)

Survey 3.7%
Actual 3.6%
Prior 3.5%
Revised n/a

 
Less than expected but still too high.

[top][end]


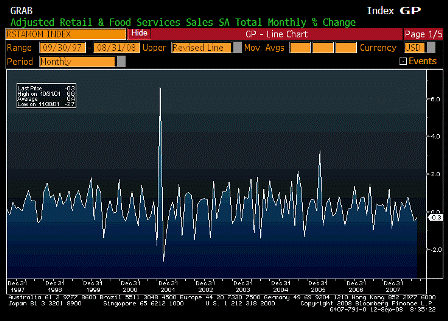
Advanced Retail Sales MoM (Aug)

Survey 0.2%
Actual -0.3%
Prior -0.1%
Revised -0.5%

 
Weaker than expected and previous month revised lower as well.

A large drop in gasoline sales due to falling prices was a factor. Ex gasoline sales retail sales were flat.

[top][end]

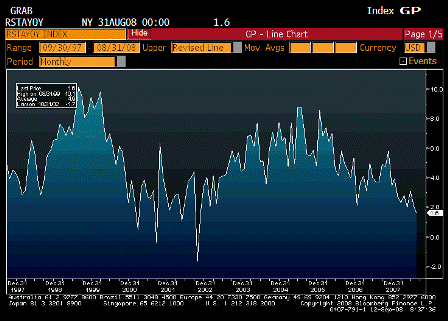
Advanced Retail Sales YoY (Aug)

Survey n/a
Actual 1.6%
Prior 2.1%
Revised n/a

 
While muddling through with modest increases, the drift looks lower.

[top][end]


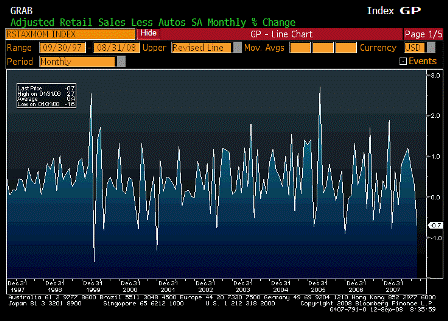
Retail Sales Less Autos MoM (Aug)

Survey -0.2%
Actual -0.7%
Prior 0.4%
Revised 0.3%

 
Lower than expected and more than reverses last month.

[top][end]


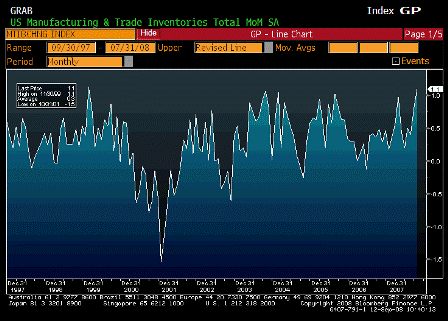
Business Inventories (Jul)

Survey 0.5%
Actual 1.1%
Prior 0.7%
Revised 0.8%

 
Higher than expected. Question is whether this is in response to higher sales or unwanted due to lower sales.

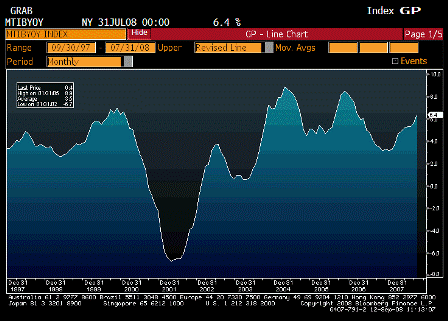
[top][end]

Business Inventories YoY (Jul)

Survey n/a
Actual 6.4%
Prior 5.7%
Revised n/a

 
Inventory levels look reasonable here.


Karim writes:

  • Gas prices showing their importance

  • Confidence rises from 63 to 73.1 (though level still quite low historically)

  • 1yr fwd inflation expex fall from 4.8% to 3.6%

  • 5-10yr fwd inflation expex fall from 3.2% to 2.9% (back in the range)


[top]
2008-09-11 USER


[Skip to the end]


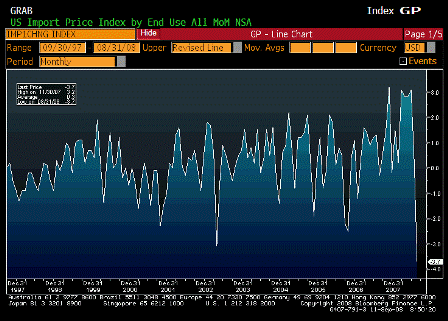
Import Price Index MoM (Aug)

Survey -1.8%
Actual -3.7%
Prior 1.7%
Revised 0.2%

 
A welcome drop, thanks to Mike Masters!

Like the goldman drop of Aug 2006.

[top][end]

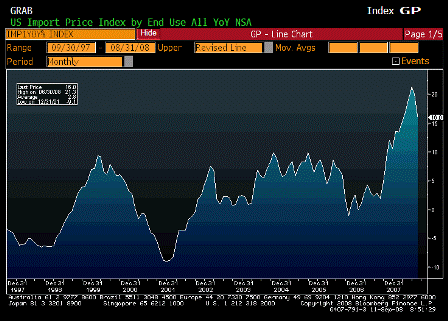
Import Price Index YoY (Aug)

Survey 20.2%
Actual 16.0%
Prior 21.6%
Revised 20.1%

 
Lower than expected, though still up big year over year, which most influences core CPI.

[top][end]

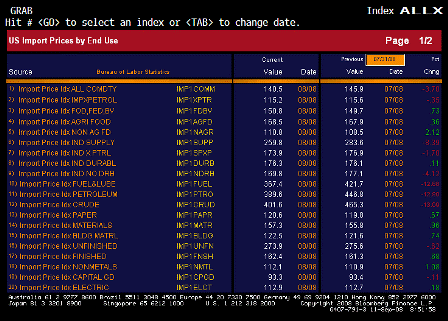
Import Price Index ALLX 1 (Aug)

 
Interesting details this month.

[top][end]

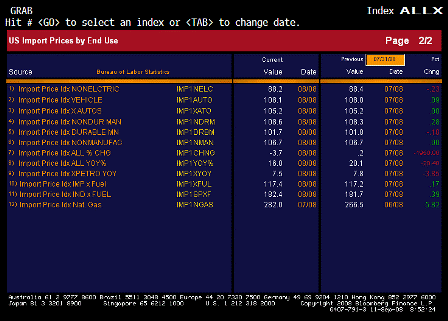
Import Price Index ALLX 2 (Aug)

[top][end]


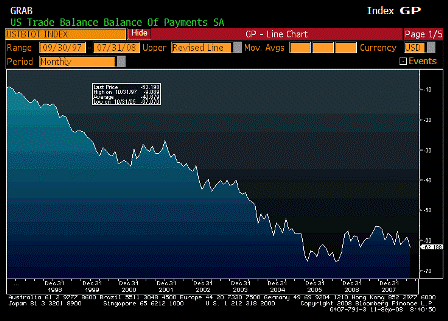
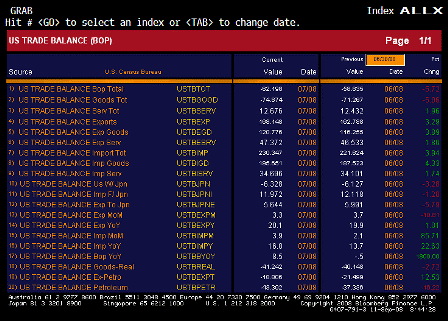
Trade Balance (Jul)

Survey -$58.0B
Actual -$62.2B
Prior -$56.8B
Revised -$58.8B

 
Deficit higher than expected, due to July oil prices. This should more than reverse in August and, so far, September as sharply lower oil prices reduce the cost of imports.

[top][end]

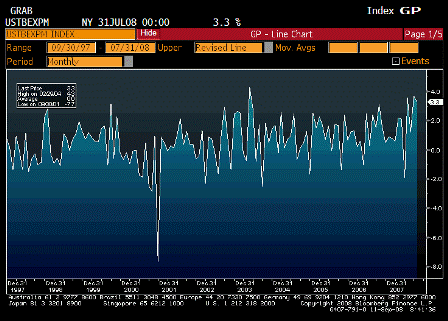
Exports MoM (Jul)

Survey n/a
Actual 3.3
Prior 3.7
Revised n/a

 
Still increasing, though at a slightly lower rate.

[top][end]

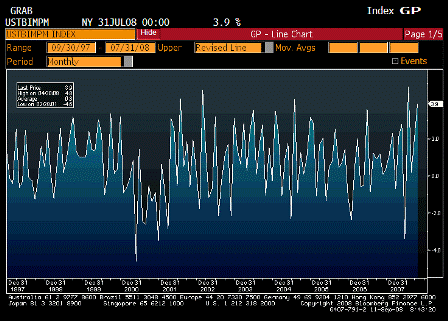
Imports MoM (Jul)

Survey n/a
Actual 3.9
Prior 2.1
Revised n/a

 
This should drop next month with lower oil prices.

[top][end]

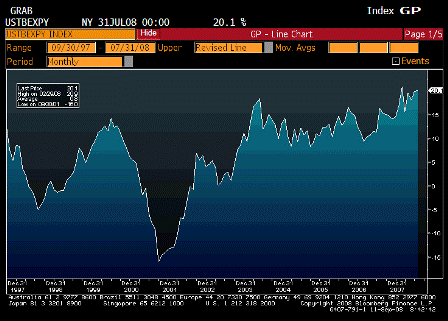
Exports YoY (Jul)

Survey n/a
Actual 20.1
Prior 19.9
Revised n/a

 
Still climbing rapidly. next month’s numbers will indicate effects of any global slowdown.

[top][end]

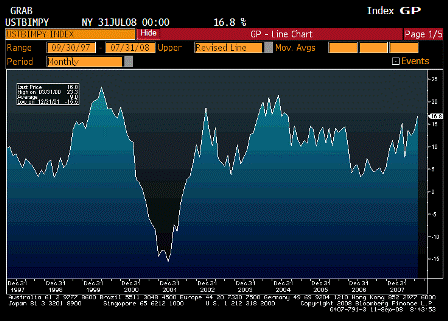
Imports YoY (Jul)

Survey n/a
Actual 16.8
Prior 13.7
Revised n/a

 
Still up big, falling oil prices should cut this down.

[top][end]

Trade Balance ALLX (Jul)

 
Worth reading through these.

[top][end]


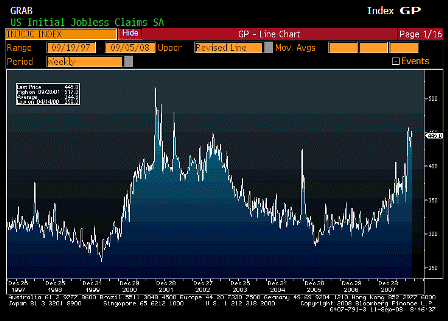
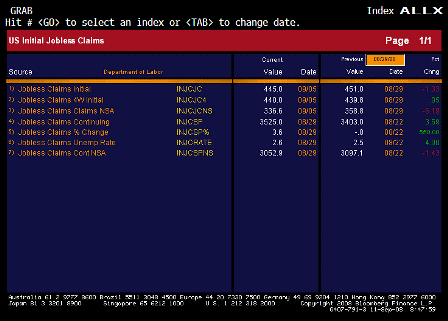
Initial Jobless Claims (Sep 6)

Survey 440K
Actual 445K
Prior 444K
Revised 451K

 
Holding steady at higher levels, and getting closer to recession levels.

[top][end]

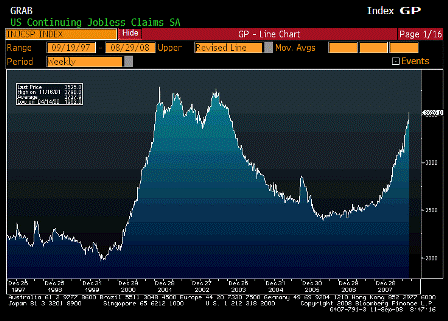
Continuing Jobless Claims (Aug 30)

Survey 3460K
Actual 3525K
Prior 3435K
Revised 3403K

 
This continues to move up and is getting closer to recession levels.

Not clear how much new extended benefit.

[top][end]

Jobless Claims ALLX (Aug 30)

 
Interesting that claims were only 336,600 before the seasonal adjustment.
With seasonals this large improvement is more likely to show up when they reverse.

[top][end]

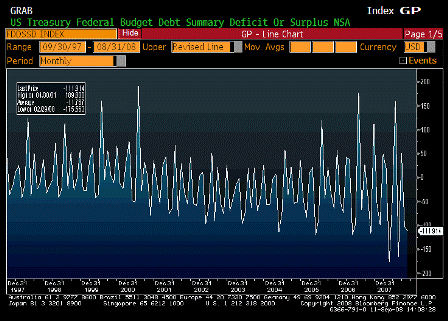
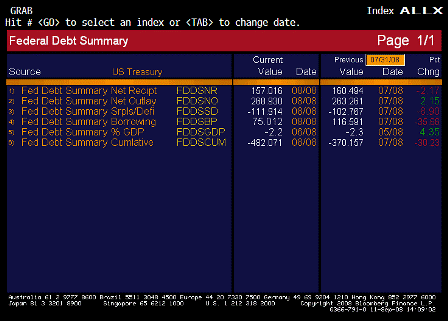
Monthly Budget Statement (Aug)

Survey -$108.0B
Actual -$111.9B
Prior -$117.0B
Revised

 
A bit higher than expected, receipts falling some, but nothing serious yet.

[top][end]

Monthly Budget Statement ALLX (Aug)


[top]
2008-09-10 USER


[Skip to the end]

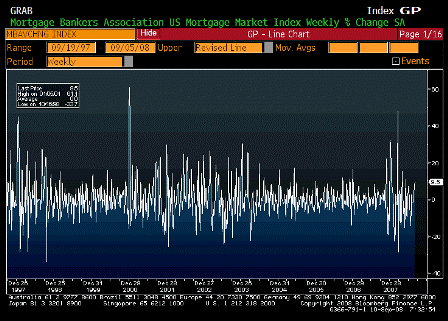
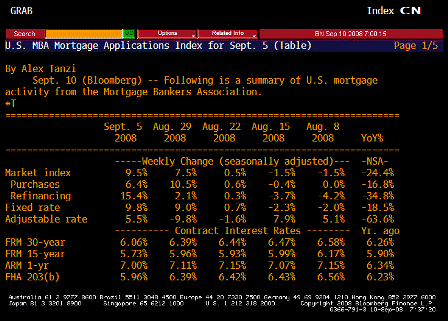
MBA Mortgage Applications (Sep 5)

Survey n/a
Actual 9.5
Prior 7.5
Revised n/a

[top][end]
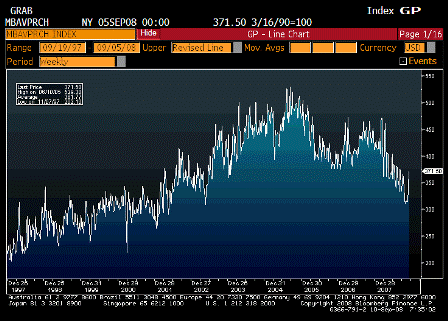
MBA Mortgage Purchasing (Sep 5)

Survey n/a
Actual 371.5
Prior 349
Revised n/a

[top][end]

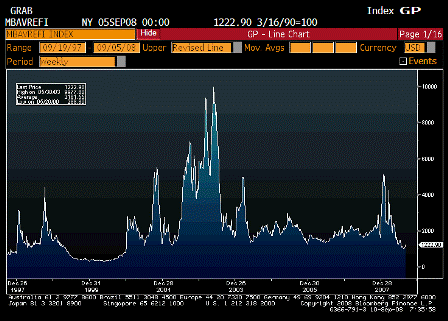
MBA Mortgage Refinancing (Sep 5)

Survey n/a
Actual 1222.9
Prior 1059.7
Revised n/a

[top][end]

MBA Mortgage Table 1 (Sep 5)

[top][end]

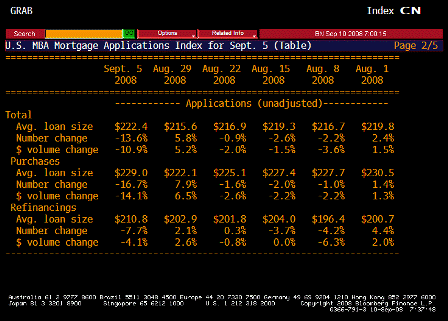
MBA Mortgage Table 2 (Sep 5)

[top][end]

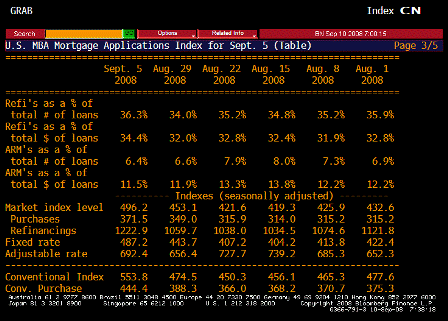
MBA Mortgage Table 3 (Sep 5)

[top][end]

MBA Mortgage Table 4 (Sep 5)


[top]