PMI, Existing home sales, Permits, Homebuying index, Fed book, China car sales, Federal budget

Highlights

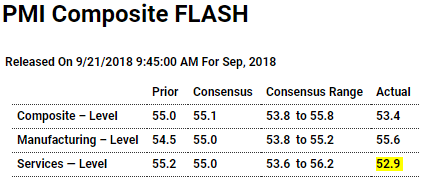
Amid a backdrop of rising inflation pressures, sharp slowing in the services PMI sample pulled down September’s composite flash and masks a strong showing for manufacturing. The PMI composite fell to 53.4 which is well below Econoday’s consensus for 55.1 and also below the low estimate for 53.8. Services fell to 52.9 vs a consensus for 55.0 while manufacturing, however, rose to 55.6 vs expectations for 55.0.

Weakness in services is centered in the year-ahead outlook which fell to its lowest level of 2018 reflecting concerns over cost pressures as input prices rose sharply and selling prices surged to a record high in survey data going back 10 years. Respondents to the service sample cited the need to pass through higher labor costs and increased input costs sourced from overseas. Cost concerns overshadow a rise in new orders, a build in backlogs, and a jump in hiring to a 3-1/2 year high.

The year-ahead outlook on the manufacturing side is also weak, slipping to a 2-1/2 year low as this sample cited higher costs tied to metal tariffs and the related need for forward purchasing. Some of these respondents said strong order levels are allowing them to push up selling prices. Yet other details, much like the service side of the report, are positive including rising orders and production. Another negative, however, is the slowest rate of hiring over the past year.

The service sector dwarfs manufacturing in size which explains its much greater impact on the composite. But though a fraction of the size of services, manufacturing is considered, however, a leading barometer for future economic change which is the silver lining in today’s report. Yet not a silver lining at all is the inflation theme of the report, one that is certain to gain the attention of Federal Reserve policy makers who look to raise rates next week to defend against the risk of economic overheating.
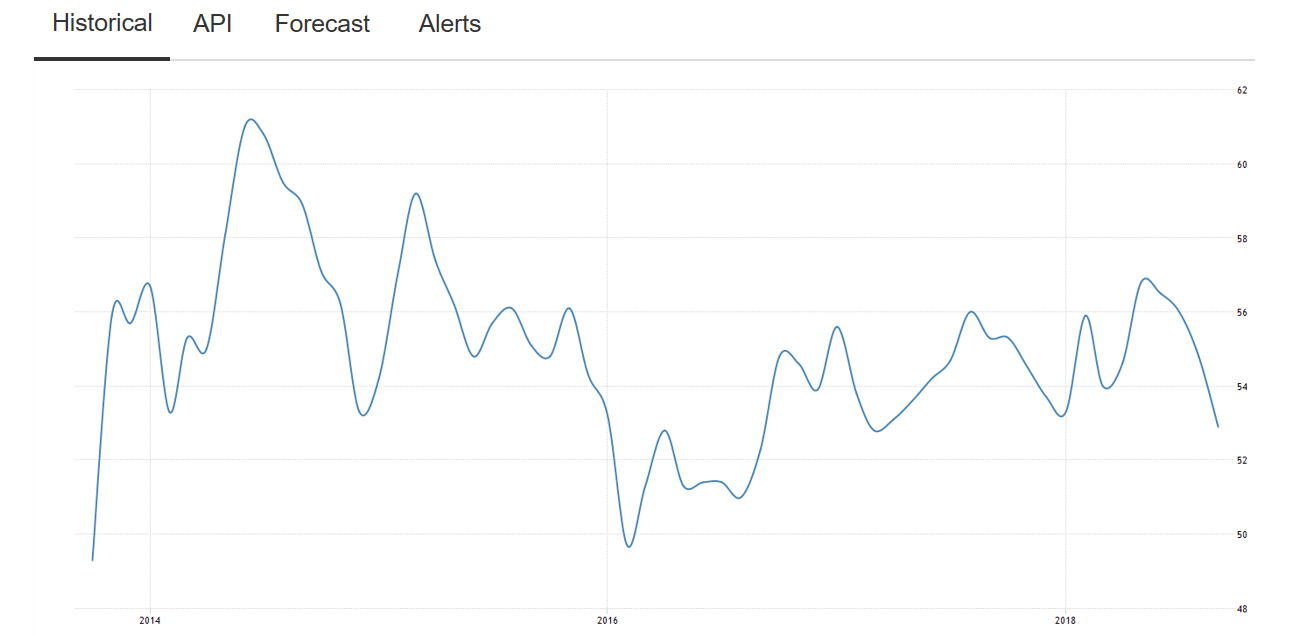
Services pmi:

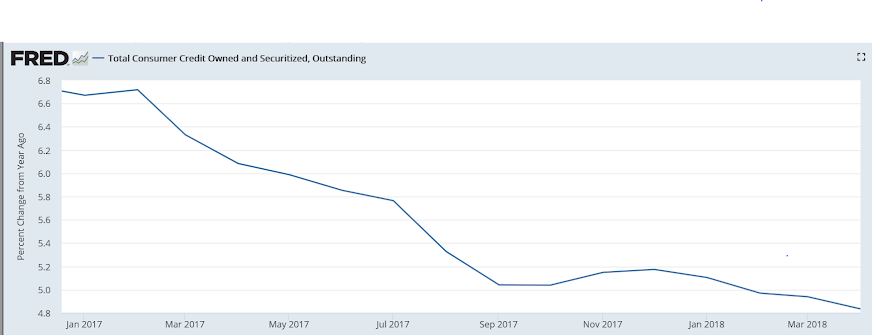
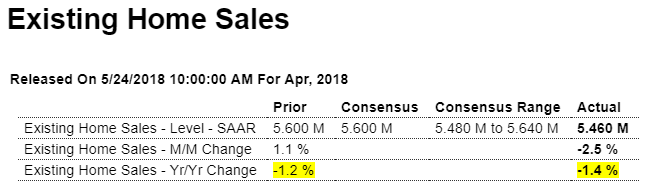
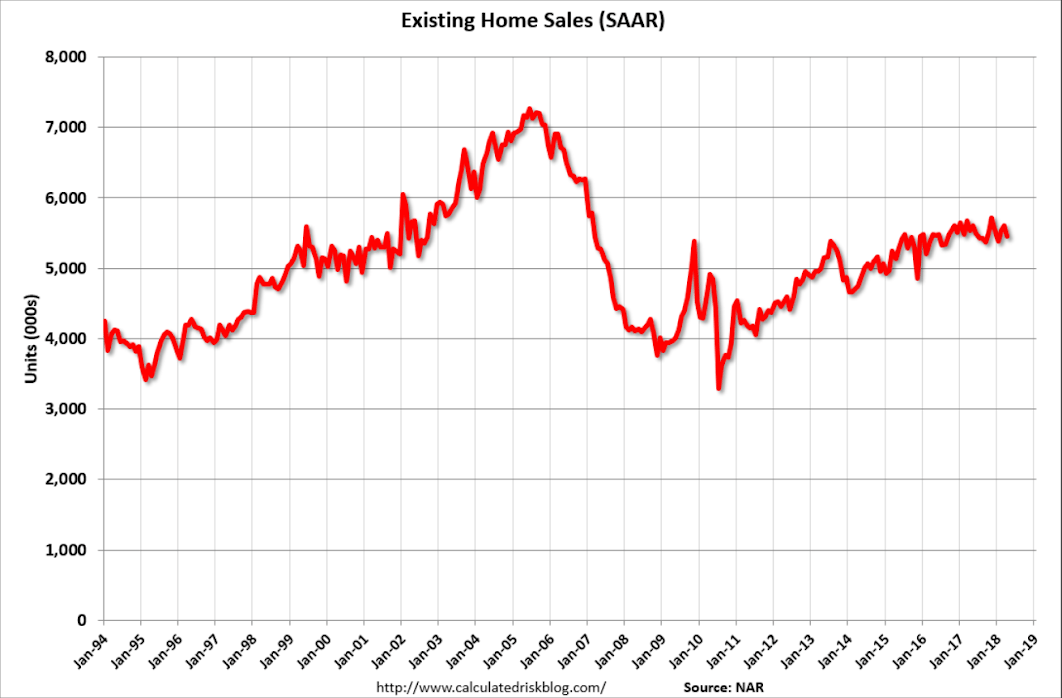
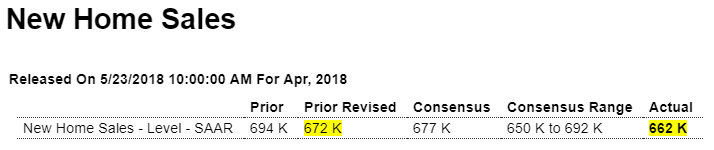
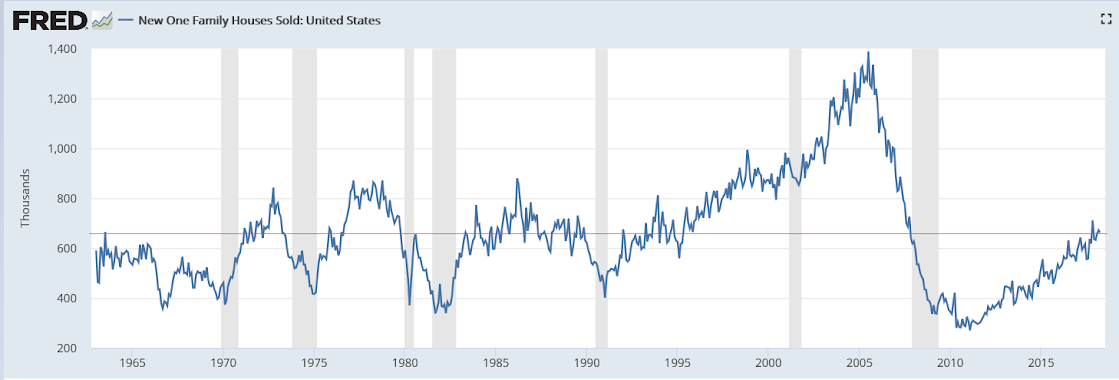
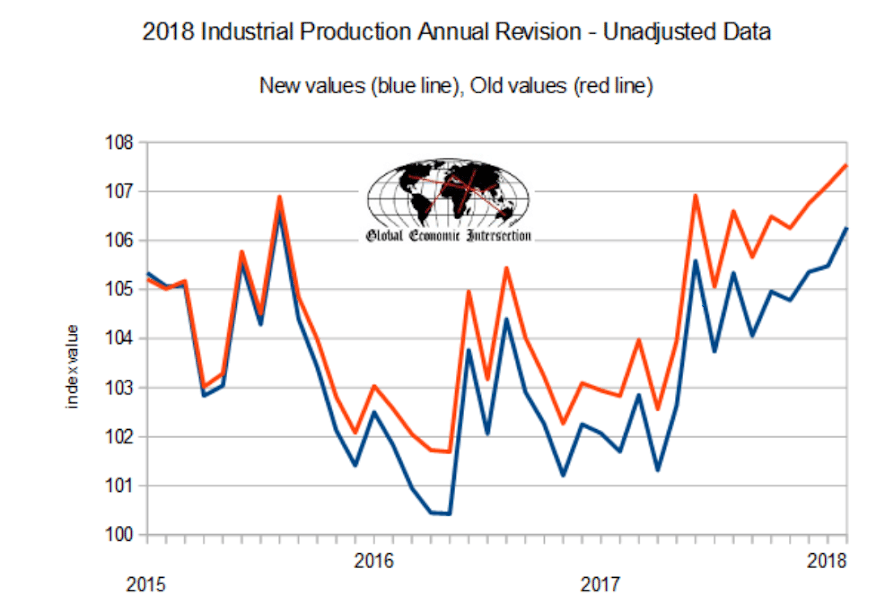
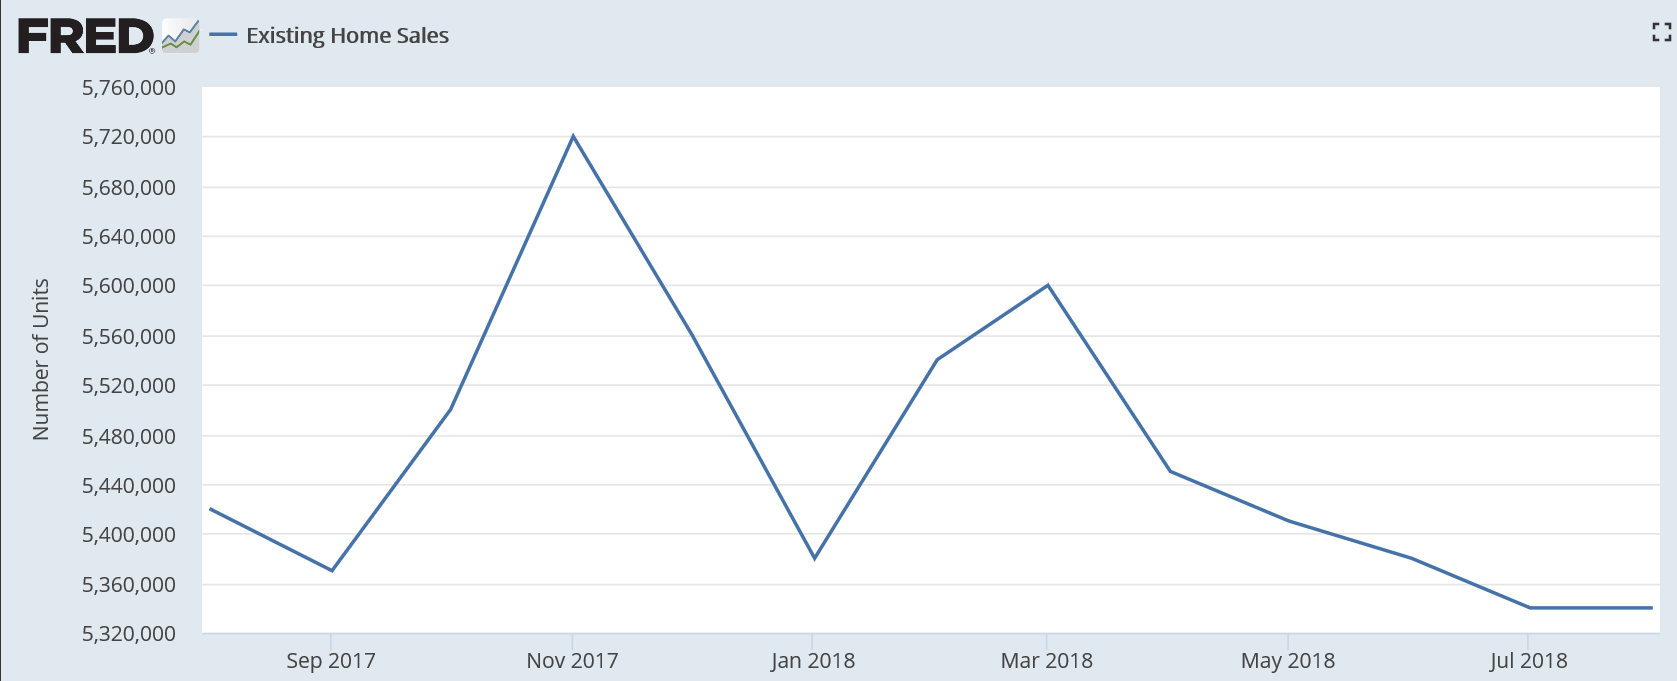
August 2018 Headline Existing Home Sales Continue In Contraction Year-over-Year

The headline existing home sales growth was unchanged with the authors saying “With inventory stabilizing and modestly rising, buyers appear ready to step back into the market”. Our analysis shows home sales three month rolling average is in contraction year-over-year.


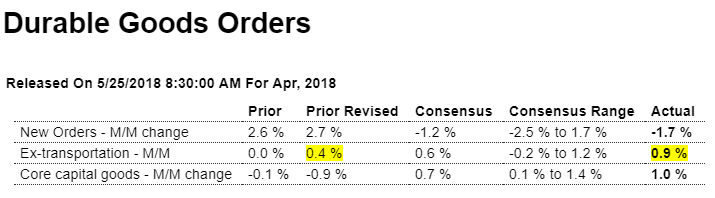
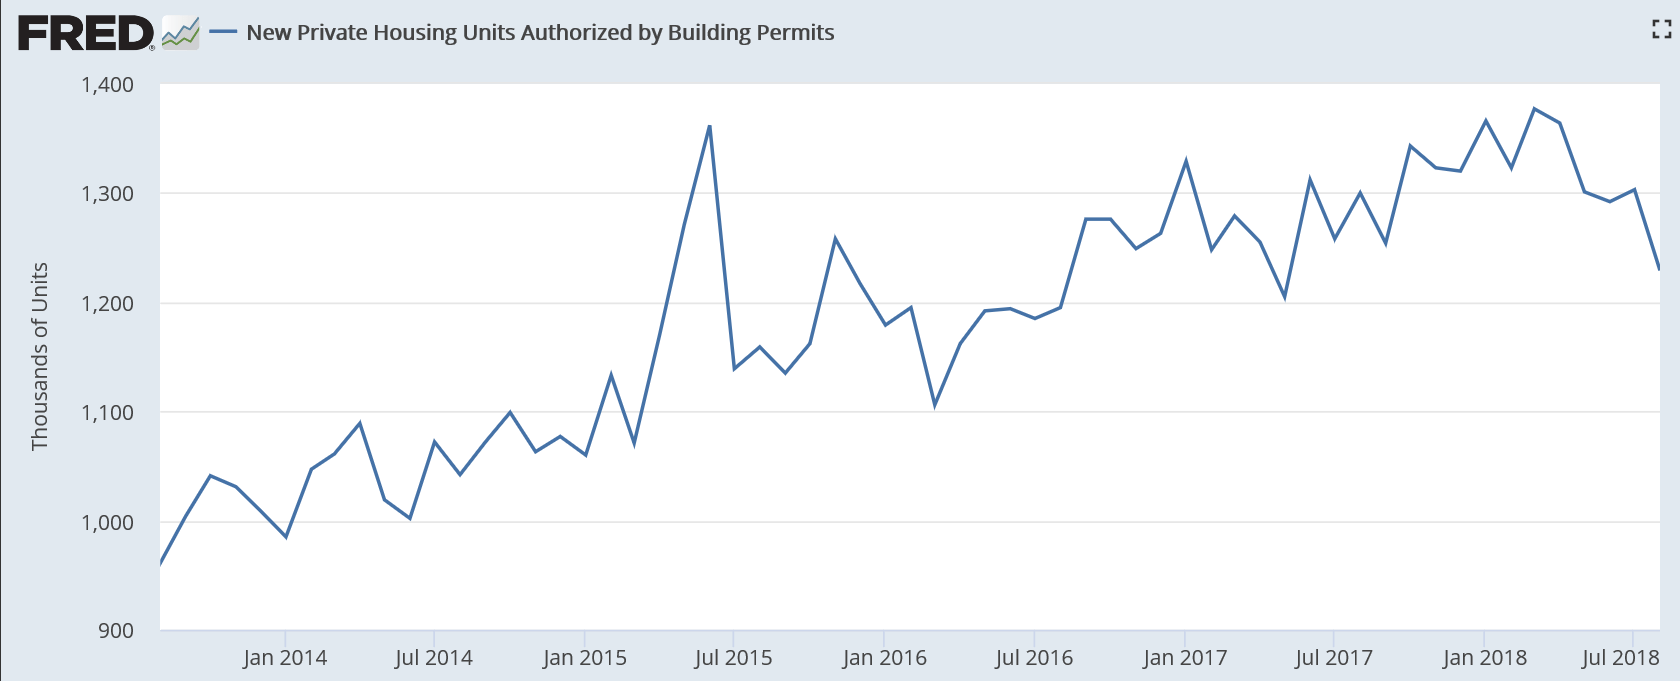
Slowing here as well:

Chicago Fed “Index Points to Steady Economic Growth in August”

Fed’s Beige Book “This report was prepared at the Federal Reserve Bank of New York based on information collected on or before August 31, 2018”

Reports from the Federal Reserve Districts suggested that the economy expanded at a moderate pace through the end of August. Dallas reported relatively brisk growth, while Philadelphia, St. Louis, and Kansas City indicated somewhat below average growth. Consumer spending continued to grow at a modest pace since the last report, and tourism activity expanded, to varying degrees, across the nation. Manufacturing activity grew at a moderate rate in most Districts, though St. Louis described business as little changed and Richmond reported a decline in activity. Transportation activity expanded, with a few Districts characterizing growth as robust. Home construction activity was mixed but up modestly, on balance. However, home sales were somewhat softer, on balance–in some cases due to reduced demand, in others due more to low inventories. Commercial real estate construction was also mixed, while both sales and leasing activity expanded modestly. Lending activity grew throughout the nation. Some Districts noted weakness in agricultural conditions. Businesses generally remained optimistic about the near-term outlook, though most Districts noted concern and uncertainty about trade tensions–particularly though not only among manufacturers. A number of Districts noted that such concerns had prompted some businesses to scale back or postpone capital investment due to worries about the trade outlook.

China Auto Sales Slump on Trade Tensions, Economic Jitters

We’ll see if this ‘eventuates’:

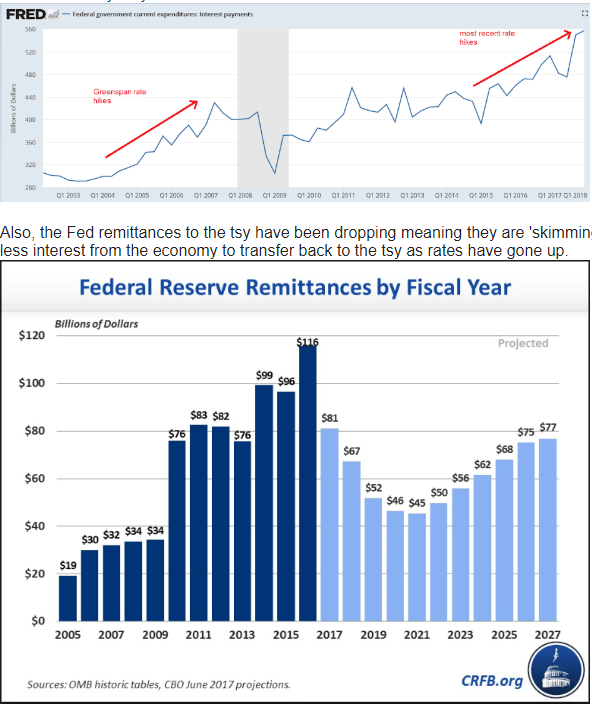
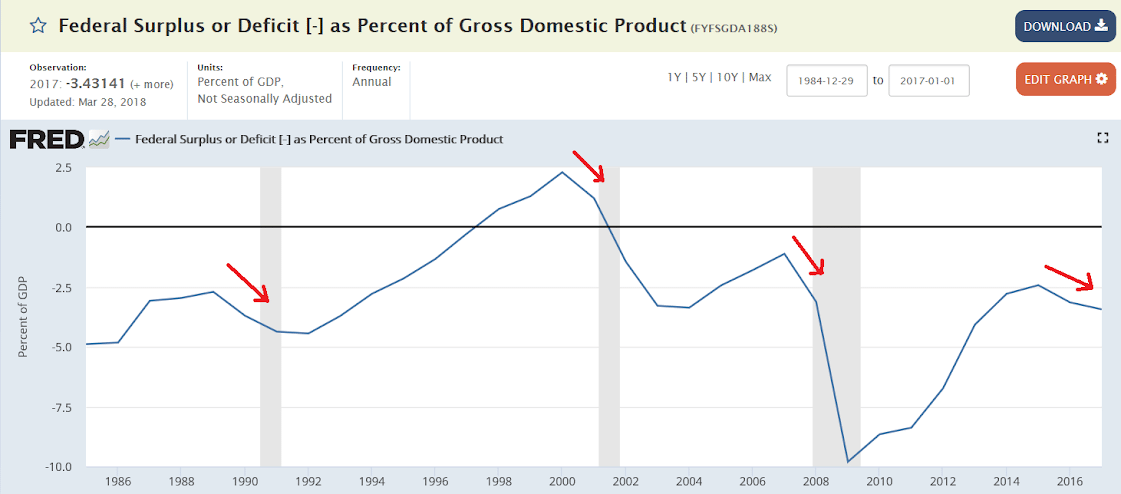
Trump adviser eyes entitlement cuts to plug U.S. budget gaps

(Reuters) “We have to be tougher on spending,” White House economic adviser Larry Kudlow said in remarks to the Economic Club of New York, adding that government spending was the reason for the wider budget deficits, not the Republican-led tax cuts activated this year. “We’re going to run deficits of about 4 to 5 percent of GDP for the next year or two, OK. I’d rather they were lower but it’s not a catastrophe,” Kudlow said. “Going down the road, of course we’d like to slim that down as much as possible and we’ll work at it.”

Construction spending, Trade

Highlights

A solid rise in residential spending offset a mixed showing for non-housing components and made for a 0.1 percent July rise in overall construction spending to barely come within Econoday’s consensus range. Residential spending rose 0.6 percent but July’s gain was entirely centered in home improvements which jumped 2.1 percent to offset outright declines of 0.3 percent in single-family homes and 0.4 percent for multi-families.

Private non-residential spending fell 1.0 percent in the month, pulled down by a sharp fall in commercial projects, where spending has been uneven in recent months, that offset a fourth straight sharp gain in transportation. Public spending on educational building and highways & streets posted gains following declines in June.

Year-on-year rates help underline what is a healthy rate of growth in construction spending, up 5.8 percent overall with residential spending up 6.7 percent and both private nonresidential and public categories showing low to mid single digit gains. Nevertheless, reports out of housing have been uneven and are clouded further by the declines in single- and multi-family homes in this report.

Highlights

The nation’s trade deficit deepened sharply in July, to $50.1 billion vs a revised $45.7 billion in June. The deficit in goods jumped to $73.1 billion from $68.9 billion in June while the surplus in services slipped slightly to $23.1 billion.

Exports of capital goods fell $1.0 billion to $46.3 billion with civilian aircraft down $1.6 billion to $3.5 billion in the month. Exports of foods & feeds fell $0.9 billion to $13.2 billion with exports of consumer goods down $0.4 billion to $16.0 billion.

The import side shows a $0.8 billion decline in consumer goods to $52.6 billion with other components, however, on the rise including capital goods up $0.7 billion to $58.2 billion and autos up $0.5 billion to $30.7 billion.

The bilateral deficit with China deepened to $36.8 billion in unadjusted country data with the EU at a deficit of $17.6 billion. The deficit with both Japan and Mexico came in at $5.5 billion in July and Canada at $3.2 billion.

July’s deficit is much deeper than the $45.6 billion monthly average for the second quarter and points to a major uphill battle for net exports in the third-quarter GDP report.

Also, as you may know, I’ve been busy running for Governor of the USVI.

To see what that’s all about visit mosler4governor.com

And if you want to make a contribution click here:

warren4governor.com/donate

Many thanks!

warren

Trade, Redbook, Consumer Confidence, Durable goods orders, China, Architecture index, Bank loans

Larger than expected:

Highlights

In some of the early data coming out in this period of trade disputes, the goods deficit of the July trade report totaled a much deeper-than-expected $72.2 billion. Exports of goods fell 1.7 percent in the month to $140.0 billion showing a very steep 6.7 percent month-to-month decline in food & feeds together with a 2.5 percent dip in exports of consumer goods and a 1.7 percent decline in the nation’s largest export, that of capital goods.

Imports also added to the widening of the deficit in July, up 0.9 percent compared to June to $212.2 billion with foods & feeds up 2.1 percent, vehicles up 1.6 percent, and industrial supplies, which include petroleum products, up 0.9 percent. The nation’s largest import category is consumer goods which was the only category to fall on the import side of the data, down 1.5 percent in the month.

July’s $72.2 billion goods deficit compares with a monthly average of $66.7 billion in the second quarter which was a very good quarter for trade, representing 1.1 percentage points of the quarter’s 4.1 percent pace. Today’s results, however, pose a very slow start for the third quarter.

Same store retail sales seem to be growing nicely, now that the number of stores has been reduced:

Highlights

Same store sales were up 5.1 percent year-on-year in the August 25 week, accelerating by 0.4 percentage points to the third fastest growth pace of the year. Month-to-date sales versus the prior month were up 0.4 percent, while the full month year-on-year gain widened by 0.2 percentage points to 4.8 percent, the second strongest reading for this comparison this year. Redbook’s same store sales point to continued robust strength in ex-auto ex-gas retail sales.

Consumer confidence looking strong, in line with the stock market, while consumer sentiment fell:

Highlights

The consumer sentiment index at mid-month came in much weaker than expected in complete contrast to today’s consumer confidence index which easily tops expectations, at 133.4 for August vs Econoday’s high forecast for 128.0 and median consensus for 126.8. This is the strongest result since the dotcom fever of October 2000. July is revised 5 tenths higher to 127.9.

The most important detail in the August report is a notable decline in those saying jobs are currently hard to get which is down very steeply from an already thin 14.8 percent to 12.7 percent. This is extremely favorable for this reading and is certain to raise expectations for a very healthy monthly employment report for August.

A second detail that speaks to impressive strength is the outlook on income. Optimists here rose a very sharp 5.1 percentage points to 25.5 percent with pessimists shrinking 2.4 points to 7.0 percent. The gain here not only reflects the strength of the labor market but also the strength of the stock market.

Boosted by jobs hard to get, the present situation index rose from 166.1 to 172.2 while the expectations index, boosted by income prospects, increased from 102.4 last month to 107.6 this month.

Another positive in the report, at least for Federal Reserve policy makers who are concerned that inflation doesn’t overshoot their target, is a 2 tenths dip in year-ahead inflation expectations to 4.8 percent which for this reading is nevertheless elevated.

Bulls are dominating stock market sentiment, at 39.4 percent for a 2.2 point gain from July with bears at 24.5 percent and down 4.1 points. Most see interest rates moving higher, at 69.4 percent vs 71.4 percent in July.

Buying plans are yet another major positive showing strong gains across the board: autos, homes, and major appliances. This report points to a noticeable upward revision in Friday’s consumer sentiment report and more importantly hints at building consumer momentum for third-quarter GDP.


Weak apart from ‘core capital goods’ but best to wait until next month’s revisions before passing judgement:

Highlights

A stunning showing for core capital goods orders steals the show in what looks on the surface, based on the 1.7 percent headline drop, to be a weak durable goods report for July. Orders for core capital goods (nondefense ex-aircraft) surged 1.4 percent to easily beat Econoday’s consensus for a 0.5 percent gain and also top Econoday’s high forecast for 1.2 percent. Computers & electronics as well as machinery were positive contributors for the capital goods group where July’s strength points to further acceleration for what has already been very strong growth in business investment.

The headline weakness is tied to the always volatile commercial aircraft component where orders come in big batches, and July does not include one of those big batches as orders fell 35.4 percent. Orders for defense aircraft were also weak and together with commercial aircraft skew the transportation reading to a 5.3 percent decline. This decline masks another strong positive in today’s report and that’s a 3.5 percent jump in motor vehicle orders. Excluding all transportation equipment, orders inched 0.2 percent ahead in July.

Turning back to core capital goods, the surge in orders will feed into shipments which is what the GDP account for business investment specifically tracks. Shipments here are up 0.9 percent following a 2 tenths upward revised gain of also 0.9 percent in June. The July gain marks a fast start for third-quarter nonresidential fixed investment while the upward revision to June will give a small boost to revision estimates for second-quarter GDP.

Other details include a very large 1.3 percent build in durable inventories which had looked too lean going into the third quarter. Large builds for commercial aircraft equipment as well as continuing builds for primary metals and fabrications, both affected by tariffs, gave inventories a boost, one that will also be a plus for third-quarter GDP. Shipments of durables slipped 0.2 percent in the month and may reflect stubborn shortages of truck drivers in the transportation sector. Unfilled orders, which had been on the climb, were unchanged.

Durable goods are one of the most volatile indicators on the economic calendar and today’s results further cement this reputation. But looking past the headline and at the strength of computers and machinery and vehicles, the factory sector continues to be the headline strength of the 2018 economy.

These numbers are not adjusted for inflation, so on an inflation adjusted basis we remain well below the highs of 10 years ago and well below the highs of 20+ years ago as well:

China to keep hitting back at U.S. over trade, to boost government spending

(Reuters) China will keep hitting back at Washington as more U.S. trade tariffs are imposed, but its counter-strikes will remain as targeted as possible to avoid harming businesses in China – whether Chinese or foreign, Finance Minister Liu Kun said. There are three things China needs to do well – lowering taxes and cutting fees, preserving the intensity of its fiscal spending so that its effect can be better felt, and supporting the real economy and lightening the burdens of companies, he said.

Going nowhere:

Trade, Employment, ISM, Japan swf

Larger than expected which also means q2 GDP will be revised down some:

Highlights

The nation’s trade deficit proved a little deeper than expected in June,, at $46.3 billion vs Econoday’s consensus for $45.6 billion.

After a run of strength going back to February, exports posted a 0.7 percent decline to $213.8 billion in the month with a rise in service exports offset by a drop in goods exports where capital goods, vehicles and especially consumer goods posted declines.

Imports, in special focus of course given the tariff situation, rose 0.6 percent to a monthly $260.2 billion with consumer goods, the sore spot in the nation’s deficit, rising a sharp $2.0 billion to $53.4 billion. Oil imports were also up, rising $1.2 billion to $14.1 billion.

Country data show a deepening deficit with China, at $33.5 billion in June with the year-to-date deficit 8.6 percent wider at $185.7 billion. Other year-to-date deficits include an 11 percent deepening with Europe at $77.6 billion, a 5.5 percent deepening with Mexico at $38.0 billion, and a 23.4 percent improvement with Canada at $8.1 billion.

Though deeper than expected in June, the nation’s trade deficit has been improving though the outlook, given tit for tats on tariffs, is uncertain.


Chugging along as low participation rates and low wage growth tell me there’s still a lot of excess capacity:

Highlights

Slowing job growth may be a welcome outcome given the risk that economic activity may be pressing up against capacity limits. A 157,000 rise in nonfarm payrolls for July is at the low end of Econoday’s consensus range but is still healthy growth that is strong enough to absorb new entrants into the labor market. And revisions to prior months are favorable, a net 59,000 gain with June revised up to 248,000 and May higher at 268,000 in what were two very strong months for job growth.

The slowing in July is also favorable for the inflation outlook as average hourly earnings showed a little heat, up 0.3 percent which was expected but still firm. The year-on-year rate, at an as-expected 2.7 percent, has been steady which is a relief to Federal Reserve policy makers who are focused on keeping inflation stable at current rates.

The payroll breakdown is led by temporary help services which rose 28,000 in a very strong gain that indicates employers, stacked up with orders and backlogs, are scrambling to meet demand. Construction payrolls also standout with a strong 19,000 gain in the latest indication of strength in this sector. Manufacturing payrolls rose 37,000 to more than double Econoday’s consensus with trade & transportation, reflecting strong activity in the supply chain, up 15,000. Weakness in payrolls comes from mining, down 4,000 after a long series of gains, and also government payrolls which fell 13,000 to nearly reverse the prior month’s 14,000 jump.

The unemployment rate fell 1 tenth in July to 3.9 percent with the number of unemployed actively looking for a job down 284,000 to 6.280 million. The pool of available workers, which includes those wanting a job but aren’t looking, fell 379,000 to 11.443 million which hints at capacity limits in the labor force, again underscoring the risk of wage inflation. The participation rate holds at 62.9 percent.

Though the headline is softer than expected, this is yet another positive employment report that speaks to the strength of the labor market and the success, so far, of Federal Reserve policy.

Analysts have been crying wolf on ‘wage inflation’ for several years now:


The deceleration had seemingly reversed a year ago, but in any case employment growth is modest at best:


Hasn’t been much of a recovery:

Fyi,

I don’t see the public purpose behind this at all, of course:

Japan plans sovereign wealth fund to finance US infrastructure

(Nikkei) The Japanese government intends to create a sovereign wealth fund to invest in American infrastructure projects. The state-backed fund will support infrastructure construction along with resource development and storage, as well as invest in joint U.S.-Japanese projects in other countries. It could work with a $113 million Indo-Pacific investment initiative announced this week by U.S. Secretary of State Mike Pompeo. Japan is expected to offer the fund as a concrete example of economic cooperation with the U.S. at the “free, fair and reciprocal” trade talks that the two sides will launch on Aug. 9.

Industrial production, China retail sales, Miles driven, Federal interest payments, Budget charts

A weaker than expected print due to auto sales which have been volatile, but charts show it’s still chugging along at a modest pace:

Highlights

A big drop in autos skewed industrial production lower in May, slipping 0.1 percent and missing what was an already soft consensus by 2 tenths. Manufacturing volumes fell a very steep 0.7 percent, pulled down by a 6.5 percent monthly drop in motor vehicles that itself reflected the effects of a fire early in the month at a supplier in Michigan.

Yet readings outside autos are also soft with hi-tech production up only 0.2 percent and production of business equipment down 1.1 percent. Excluding autos, manufacturing production fell 0.2 percent in the month. The manufacturing component of this report never really has shown the kind of strength being posted by factory shipments or factory orders.

Manufacturing makes up the great bulk of industrial production and once again is overshadowing another standout month for mining which surged 1.8 percent. Year-on-year mining production is up 12.6 percent vs only a 1.7 percent rate for manufacturing. Utility production has been mixed, up 1.1 percent in May for 4.0 percent yearly growth.

Capacity utilization is over 90 percent for mining at 92.4 percent vs 79.4 percent for utilities and 75.3 percent for manufacturing. Utilization overall, down 2 tenths to 77.9 percent, is not extreme and points to available slack in the industrial sector.

Putting mining and utilities aside, industrial production is once again an anomaly, not pointing as other reports to building strength and a rising tempo for the nation’s factory sector.

Note that traditional non-NAICS numbers for industrial production may differ marginally from NAICS basis figures.


Growth slowing:

Will the tax cuts and spending increases save us?

Trade, Consumer credit

The trade deficit narrowed but due to a drop in consumer spending on imported cell phones, which doesn’t bode well for retail sales, which are under pressure from the reduced growth of real disposable personal income. And the widening trade gap with the euro area is fundamentally euro friendly even as fears of Italian politics are frightening portfolio managers:

Highlights

Helped by a dip in cellphone imports, the nation’s trade gap narrowed sharply in April to a much lower-than-expected $46.2 billion. Cellphone imports fell $2.2 billion to pull down the consumer-goods deficit which narrowed by $2.8 billion in the month.

Despite the improvement for consumer goods, the bilateral gap with China rose a noticeable $2.1 billion to an unadjusted $28.0 billion in results that probably won’t ease ongoing trade friction. Note that country data, unlike other data in this report, are traditionally tracked in unadjusted terms due to small monthly totals yet adjusted data for China are available and tell a different story with the gap at a higher level of $30.8 billion but down in month-to-month terms from an adjusted $34.2 billion in March.

Turning back to unadjusted country data, the gap with Europe also deepened, by $2.5 billion in April to $14.6 billion with the Japanese gap little changed at $6.3 billion. Turning to North America, the gap with Mexico narrowed by $2.4 billion to a deficit of $5.7 billion while a small March surplus with Canada turned into a $785 million deficit in April.

Imports of iron and steel mill products rose $228 million to $2.1 billion with imports of bauxite and aluminum up slightly to $1.5 billion. It will be interesting to watch whether these totals, due to U.S. tariffs on steel and aluminum, begin to slide in the month’s ahead.

Overall, exports rose 0.3 percent in the month to $221.2 billion with goods, led by a gain for industrial supplies and also food, up 0.2 percent at $141.3 billion and despite a 0.1 percent slip in service exports which totaled $70 billion. Imports fell 0.2 percent with goods, again reflecting the weakness in cellphones, down 0.3 percent to $209.5 billion and services up 0.6 percent to $47.9 billion.

April’s deficit is more than $1 billion narrower than March and far under the $53.1 billion monthly average of the first quarter. This points to a big net-export lift for second-quarter GDP.

The petroleum deficit appears to have leveled off, while trade overall still looks to be trending further into deficit, recognizing the volatility around year end:


Deceleration continues:

Highlights

Consumer credit rose a lower-than-expected $9.3 billion in April though consumers did run up their credit-card debt slightly as revolving credit, which was in the negative column the last two reports, rose $2.3 billion in the month. Nonrevolving credit, which includes student loans and also vehicle financing and which often posts double-digit gains, rose only $7.0 billion in the month.

Existing home sales, Durable goods, China debt, State index

More weakness:

Highlights

Yesterday’s new home sales report showed less strength than expected while today’s existing home sales results are outright disappointing. Sales fell 2.5 percent in April to an annualized rate of 5.460 million which falls below Econoday’s low estimate.

The decline in sales came despite a sizable increase in supply on the market, at 1.800 million for a monthly gain of 9.8 percent though the year-on-year rate remains squarely in the negative column at minus 6.3 percent. On a sales basis, supply rose to 4.0 months from 3.5 months.

The median price for a resale rose 3.2 percent in the month to $257,900 which no doubt held down the month’s sales. But the year-on-year rate for the median, in contrast to FHFA or Case-Shiller data which are near 7 percent, is a more moderate 5.3 percent.

All regions were weak in the month especially the Northeast where sales fell 4.4 percent. And only one region, the South, is in the year-on-year plus column and at only 2.2 percent.

Housing got off to a slow start this year and the first indications on the second quarter are not pointing to any acceleration. Housing, like consumer spending, has been unexpectedly flat.

Been near flat for going on three years now:


Ex aircraft better than expected, apparently due to the tariffs. The chart shows modest growth and levels that have not yet exceeded 2008 in real terms:

Highlights

Tariff-related price inflation may be driving up dollar totals in the factory sector which, based on the April advance durable goods report, has gotten off to a very strong start for the second quarter. Forget the 1.7 percent headline decline in the month, one due entirely to an understandable swing lower for what have been very strong aircraft orders. Excluding aircraft and other transportation equipment, durable goods orders rose 0.9 percent to beat Econoday’s consensus by 3 tenths.

Orders for primary metals, where tariffs on steel and aluminum are in effect, jumped 1.3 percent in April on top of March’s giant 4.6 percent surge when tariffs first took effect. Orders for fabricated metals, also affected by tariffs, rose 2.0 percent following March’s 1.2 percent gain. These two components make up more than 20 percent of total durable orders.

Elsewhere, capital goods put in a very strong April showing in what is very auspicious news for second-quarter business investment. Core orders, which exclude aircraft, rose 1.0 percent with core shipments, which are direct inputs into fixed nonresidential investment, up 0.8 percent.

Civilian aircraft orders fell by 36.2 percent but follow March’s 71.7 percent climb. And defense aircraft helped narrow the difference, rising 7.5 percent in the month. Vehicle orders also opened up the second-quarter on a strong note with a 1.8 percent gain.

The factory sector, as has been indicated by the regional reports, is picking up steam and, showing no immediate negatives and possibly positives from tariffs, looks to be an increasing contributor to the 2018 economy. Other details include a third straight strong rise in unfilled orders, up 0.5 percent in April, and a useful 0.3 percent build for inventories.

These numbers are not adjusted for inflation:

China debt crackdown leaves regional institutions short of cash

(Nikkei) China is cutting off funds to financial companies and banks tied to regional governments in a crackdown on risky debt. China’s massive state-owned banks are largely responsible for keeping the interbank market flush. Chinese regional governments that have hit limits on debt issuance have traditionally founded quasi-private companies to handle infrastructure and public works, borrowing as needed. From the beginning of 2018 through last week, financial institutions and companies sold just under 460 billion yuan in securitized products, a drop of 10% from a year earlier.

This chart has been revised by the Fed and now looks very different:

Mtg purchase apps, New home sales, Architecture billing index, China

Weakness continues:

Housing, while growing modestly, remains very depressed historically:

Highlights

Month after month the new home sales report shows its volatility behind which, however, slight strength is evident. Sales in April came in 15,000 short of Econoday’s consensus, at a 662,000 annualized rate with revisions pulling down the prior two months by a total of 30,000. Yet compared to the prior report, when sales beat expectations by 64,000 and when upward revisions added 81,000, today’s report doesn’t reverse what is still an upward slope for new homes.

Yet details are mixed. Price discounting may be underway as the median fell a very steep 6.9 percent in the month to $312,400 for a year-on-year gain of only 0.4 percent. Relative to sales, which are up 11.6 percent year-on-year, prices look like they have room to climb. Supply data are also a concern. New homes on the market rose only 2,000 to 300,000 with supply relative to sales also moving only marginally higher, to 5.4 months from 5.3 months.

Until supply begins to build at a better pace, sales of new home homes will lack acceleration. Residential investment, where new home sales are a major piece, proved flat in the first quarter though improvement in the second quarter, however limited, does look like it’s underway. Watch tomorrow for existing home sales which have been flat and which are expected to remain so.

This chart is not population adjusted:

Permits are also growing very modestly and remain historically depressed. Again, this is not population adjusted:


This has also been historically depressed this cycle;

https://asia.nikkei.com/Economy/China-curbs-infrastructure-spending-as-local-debt-climbs

China curbs infrastructure spending as local debt climbs

BEIJING — China is slamming the brakes on infrastructure investment to reel in soaring local debt, but the move is certain to hurt regions reliant on public works projects, widening the country’s already stark economic gaps.

Infrastructure spending in the January-April period rose 12.4% on the year, 0.6 percentage point lower than the growth marked in the three months ended March, data from China’s National Bureau of Statistics shows. The seemingly strong growth appears less impressive when put in context. The annual increase has been around 20% in recent years. In 2017, when the Communist Party held its twice-a-decade congress, the figure was 19%.

Overall fixed asset investment expanded just 7% in the January-April period, the slowest since 6.3% in 1999.

Employment, Durable goods, Bank loans, Collections index, China phone sales

  • Economic intuitive sectors of employment were mixed with truck transport contracting.
  • This month’s report internals (comparing household to establishment data sets) was inconsistent with the household survey showing seasonally adjusted employment expanding only 3,000 vs the headline establishment number expanding 164,000. The point here is that part of the headlines are from the household survey (such as the unemployment rate) and part is from the establishment survey (job growth). From a survey control point of view – the common element is jobs growth – and if they do not match, your confidence in either survey is diminished. [note that the household survey includes ALL jobs growth, not just non-farm).
  • The household survey removed 236,000 people to the labor force.

  • Growing modestly but on an inflation adjusted basis still well below 2008 levels:


    Total bank credit growth abruptly slowed in 2016 around election time and has yet to pick up:


    C and I loan growth picked up a bit recently but is still way down from prior rates of growth:

    Some of the decline can be blamed on the Chinese Lunar New Year. The holiday cut into smartphone production. As a result, on a sequential basis, shipments declined 34% from the fourth quarter of last year. Since the fourth quarter includes the holiday shopping season, that decline might not be as ominous as the 13.4% drop year-over-year. Chinese shipments as a percentage of the total number of Q1 global smartphone deliveries dropped under 30%.

    Vehicle sales, Industrial Production revisions, Tariff comments

    Still looking very weak:

    From WardsAuto: U.S. Light-Vehicle Forecast: Sales Down Slightly; Inventory Declines to Match Demand

    A Wards Intelligence forecast calls for U.S. automakers to deliver 1.60 million light vehicles in March. … The report puts the seasonally adjusted annual rate of sales for the month at 16.9 million units, higher than last year’s 16.7 million but slightly under last month’s 17.0 million.

    Read more at http://www.calculatedriskblog.com/#3AcCy7RlAWmvrpDV.99

    Big downward revision. This is somewhat like how we’ve gotten ‘revised into recession’ in past cycles:

    RESULTS OF THE REVISION

    Industrial Production

    Manufacturing output is now estimated to have declined about 1 1/2 percent in 2015, to have been little changed in 2016, and then to have advanced about 2 percent in 2017. These rates of change are lower than their previously reported values, especially for 2015, which was revised down 1.0 percentage point. The cumulative effect of these revisions leaves manufacturing IP in February 2018 about 5 1/2 percent below its pre-recession peak.

    The rates of change for mining have been revised up for 2014 and 2015 and revised down for 2016 and 2017. The contour for mining output shows an especially large gain in 2014 followed by sizable drops in 2015 and 2016; output increased strongly in 2017. The rates of change for utilities output are revised down only slightly for each year from 2013 to 2016, while the gain in the index for 2017 is now reported to be 0.8 percentage point lower than previously published.

    Production by Industry Group

    The output of durable goods manufacturers is now reported to have fallen in 2015, moved a little lower in 2016, and advanced in 2017; output was previously reported to have risen in 2016, and the rates of change for 2015 and 2017 were also revised down. Within durables, the revisions for the 2015 – 17 period were widespread across industries. Revisions to the rates of change for nondurables were smaller and more mixed. The revised estimates show the output of nondurables increasing about 1/2 percent in both 2015 and 2016 and rising 2.2 percent in 2017.

    The output index for industries in scope for manufacturing IP that are not part of manufacturing under the North American Industry Classification System (NAICS) – that is, logging and publishing – fell sharply in 2014, 2016, and 2017, and was relatively little changed in other recent years. The revisions to this index were mixed, moving the rate of change higher in 2013, 2015, and 2016 and lower in 2014 and 2017.

    Production by Market Group

    The index for consumer goods has increased in each of the past few years, though the gains in 2014, 2015, and 2017 are now smaller than reported earlier. The rates of change for business equipment were revised down significantly for 2015 and 2016, but the gains were revised up for 2017. The revisions for construction supplies and business supplies were smaller. In addition, the index for materials is now estimated to have fallen more rapidly in 2015 and 2016 and risen more slowly in 2017, with downward revisions for both the energy and non-energy components.

    Capacity

    Total industrial capacity expanded modestly in each year from 2015 to 2017, and it is expected to increase about 2 percent in 2018. The growth rate for 2016 is now noticeably higher than the value reported earlier, but the gains in other years are now reported to have been smaller. Manufacturing capacity contracted slightly in 2014 and 2015, but it increased between 1/2 and 1 1/2 percent each year thereafter. For 2016 in particular, the gain in manufacturing capacity is larger than stated previously, reflecting a more-rapid increase in capacity for nondurables industries as well as a less-steep decline in capacity for logging and publishing (”other manufacturing” industries). Capacity at mines declined in 2016 and 2017, but it is expected to jump about 5 percent in 2018. As compared with previous reports, the growth of capacity at mines was significantly higher in 2016 and significantly lower in 2017. Capacity at utilities has grown in recent years; the gain for 2017 was revised up more than 1 percent, but revisions to other years were negative.

    Capacity Utilization

    Capacity utilization for total industry declined in 2015 and 2016 but rose in 2017.[3]The decrease in 2015 resulted from a large drop in the rate for mining and from smaller reductions in the rates for both manufacturing and utilities. Compared with earlier estimates, capacity utilization for total industry is now reported to have been somewhat higher for 2014, little changed in 2015, and lower for 2016 and 2017.

    Utilization at manufacturers fell in 2016 and rose in 2017; the current readings for these years are each between about 1/2 and 1 percentage point lower than previously reported, as capacity revised down by less than output. For the fourth quarter of 2017, the utilization rate at manufacturers is estimated to have been more than 3 percentage points below its long-run average. Within manufacturing, there were sizable downward revisions to the utilization rates for both durables and nondurables for 2016 and 2017.

    The utilization rate for durable manufacturing was above its long-run average in 2014, but it fell back in 2015. By the fourth quarter of 2017, the utilization rate for durables was more than 2 percentage points below its long-run average. Of the 11 major categories of durables, about half recorded operating rates below their long-run averages.

    The utilization rate for nondurable manufacturing has been below its long-run average for several years. As of the fourth quarter of 2017, the operating rates for all nondurable manufacturing industry groups were around or below their industry-specific long-run averages.

    Capacity utilization rates for mining declined sharply in 2015 and fell further in 2016, before rising sharply in 2017. The declines in 2015 and 2016 were largely due to decreased output in the oil and gas drilling and servicing sector. Relative to its previously published rates, utilization at mines for 2017 is about 2 percentage points higher; revisions to other recent years were smaller. In 2017, the utilization rate for mining was 1/2 percentage point above its long run average of 87.0 percent; it had last been above this average in 2014. The operating rates for utilities have been well below their long-run average for the past several years; the revisions to this index were positive except for 2017.

    So maybe it’s all about infecting China with US financial sector firms?

    U.S., China Quietly Seek Trade Solutions After Days of Loud Threats

    Mar 26 (WSJ) — China and the U.S. have quietly started negotiating to improve U.S. access to Chinese markets. The talks are being led by Liu He, China’s economic czar, U.S. Treasury Secretary Steven Mnuchin and U.S. trade representative Robert Lighthizer. In a letter Messrs. Mnuchin and Lighthizer sent to Mr. Liu late last week, the Trump administration set out specific requests that include a reduction of Chinese tariffs on U.S. automobiles, more Chinese purchases of U.S. semiconductors and greater access to China’s financial sector by American companies.