FHA house price index, Existing home sales, Industrial production

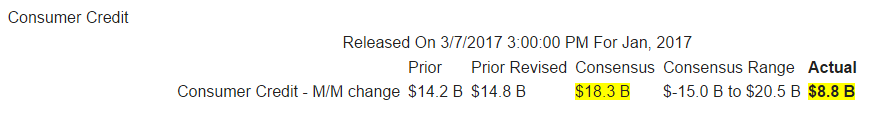
This was a surprise:

Highlights

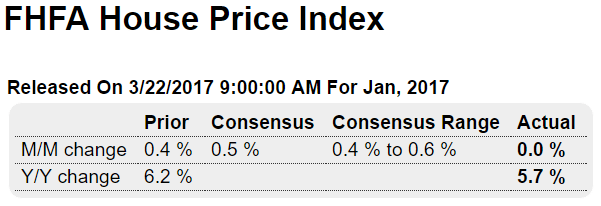
In an unusually weak showing, the FHFA house price index came in unchanged in January with year-on-year appreciation falling a steep 5 tenths to 5.7 percent. This is the weakest month-to-month showing in more than 4 years and the weakest year-on-year rate in 2-1/2 years.
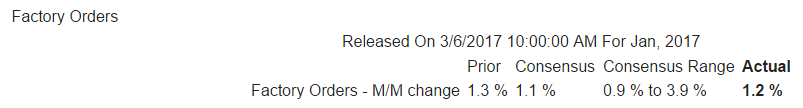
Also weak:

Highlights

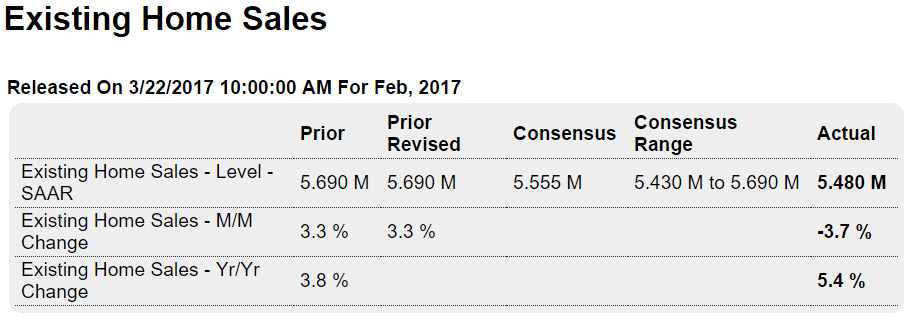
Existing home sales are on the soft side of expectations, down 3.7 percent in February to a 5.480 million annualized rate and below the Econoday consensus for 5.555 million. Details are mostly weak including a 3.0 percent decline for single-family sales to a 4.890 million rate and a sharp 9.2 percent drop for condos to a 590,000 rate. Year-on-year, single-family sales are up 5.8 percent with condos fading and barely over zero at 1.7 percent.

But total year-on-year sales are up a solid 5.4 percent and still below pricing where the median, at $228,400, is up a healthy 7.7 percent. Supply has been very thin but is improving, with 1.750 million resales on the market for a 4.2 percent gain from January. And relative to sales, supply is at 3.8 months vs January’s 3.5 months. Days on the market are very short, at 45 vs 59 days a year ago.

By region, the Northeast had a very weak February, down 13.8 percent to a 690,000 rate. And there is also weakness in the Midwest, with a 7.0 percent monthly decline to a 1.200 million rate, and the West, down 3.1 percent to 1.250 million. But the West is showing the most yearly strength at plus 9.6 percent while the Northeast brings up the rear at plus 1.5 percent.

The pending home sales index, which tracks initial contract signings for resales, accurately anticipated weakness in today’s report, one that underscores the still hesitant activity in the housing sector. Watch for new home sales on tomorrow’s calendar where, unlike this report, improvement is the call for February.

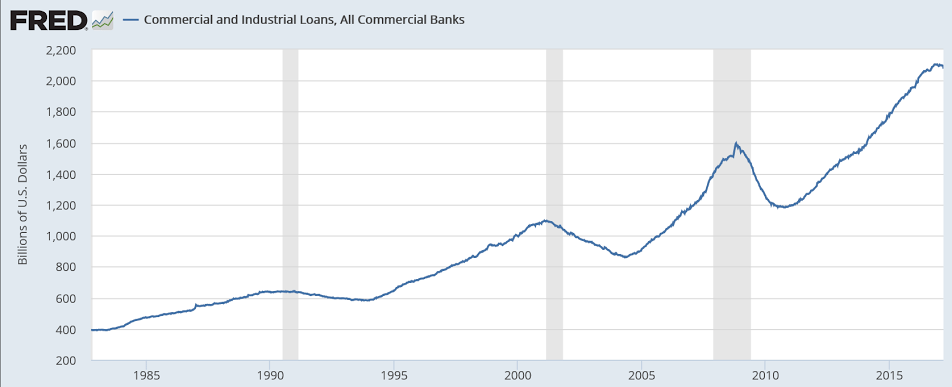
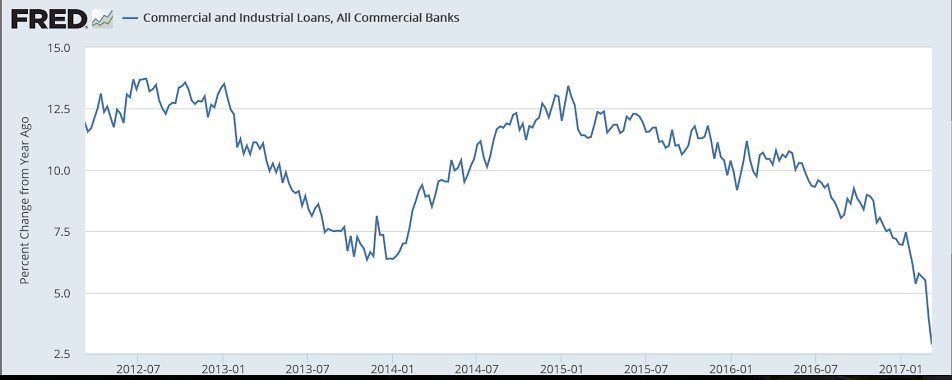
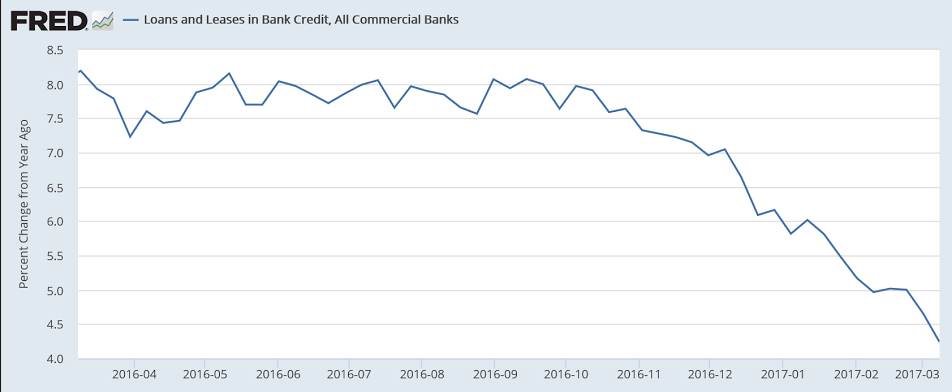
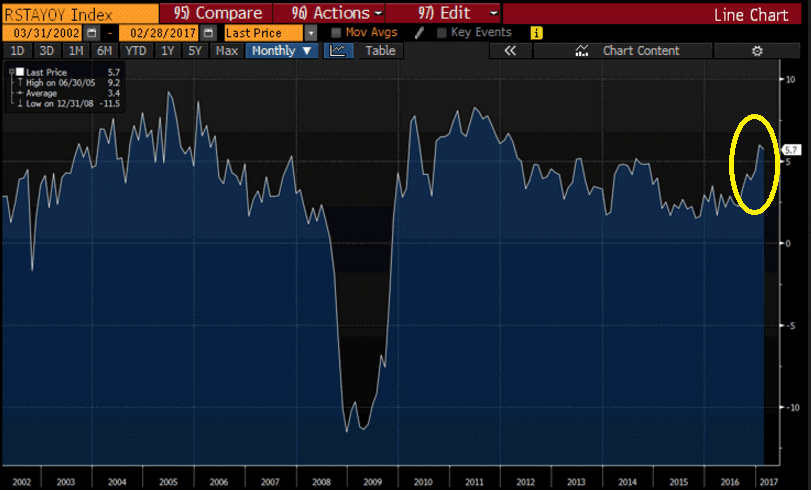
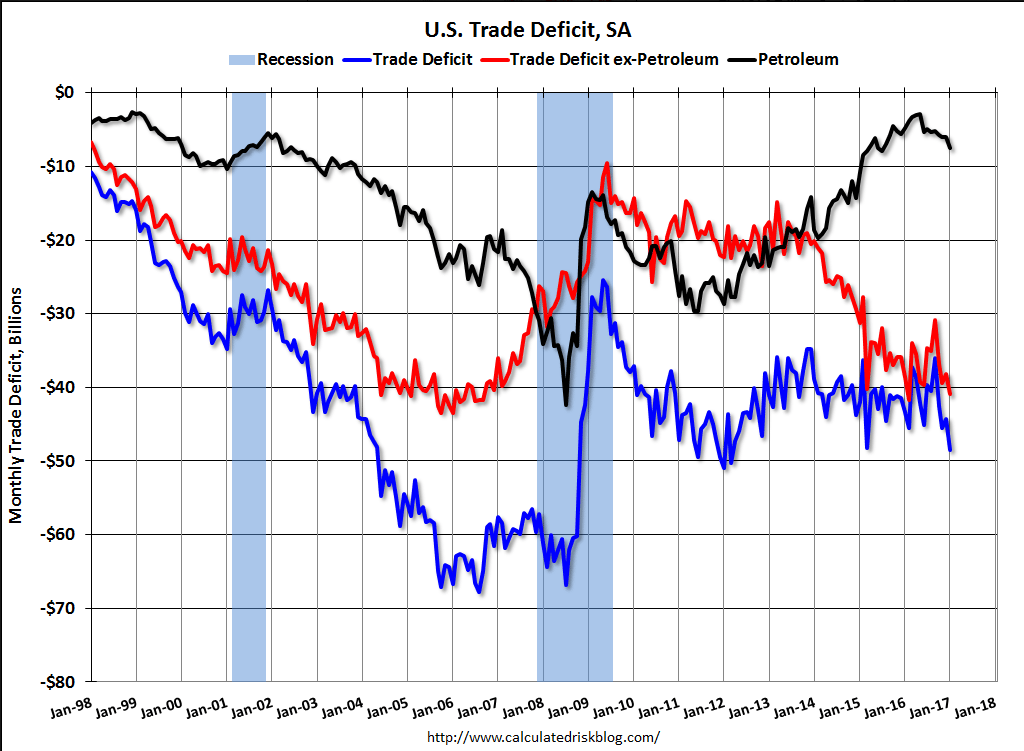
This was released a few days ago.

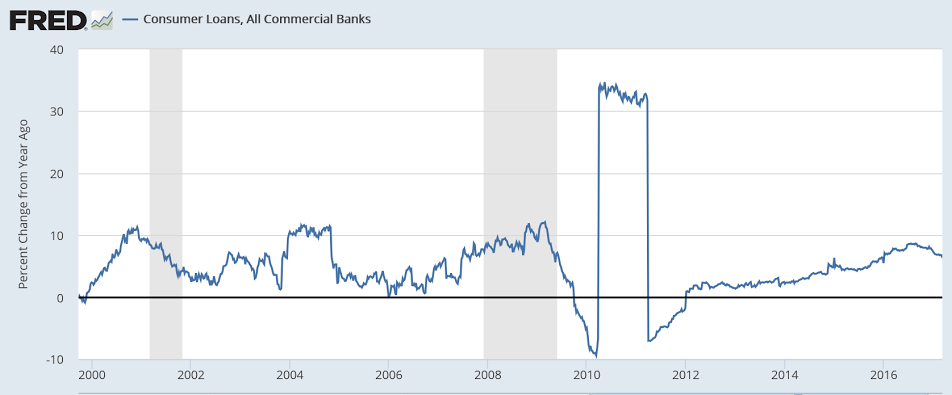
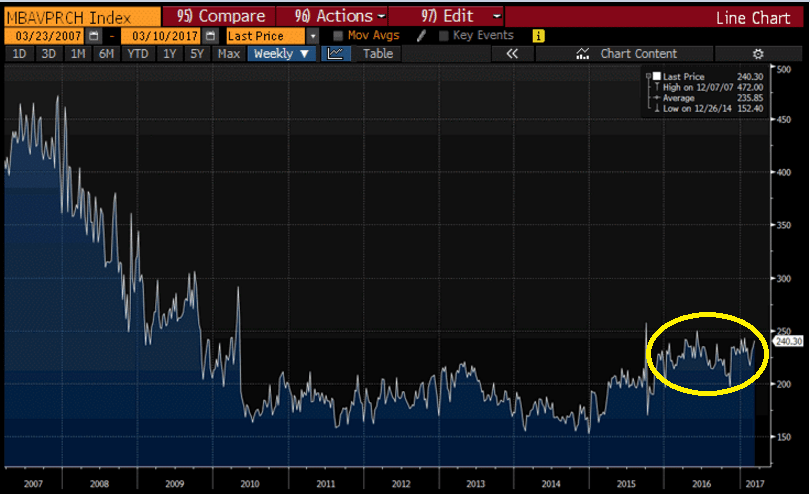
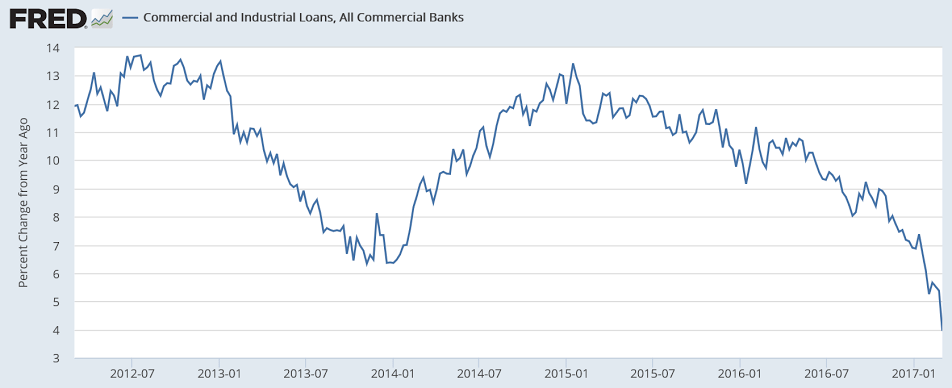
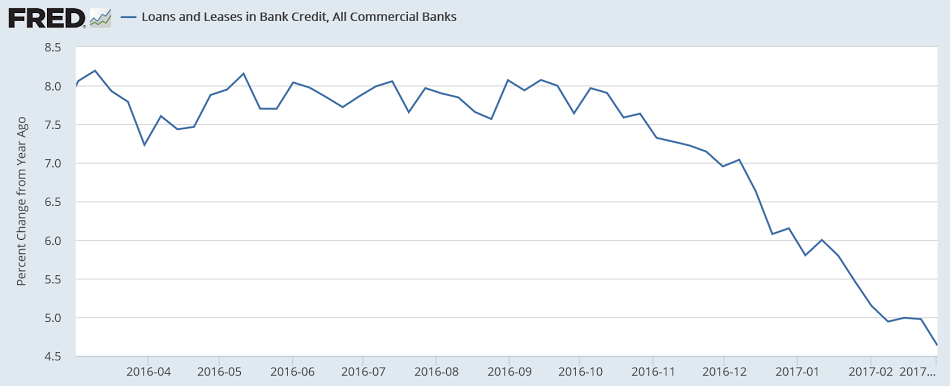
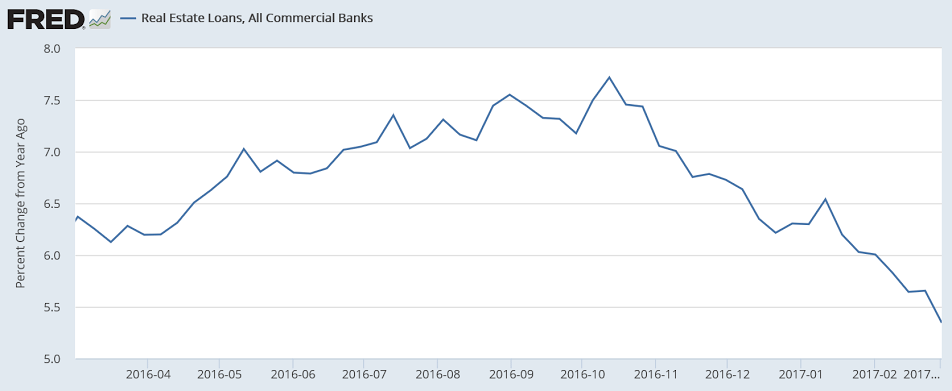
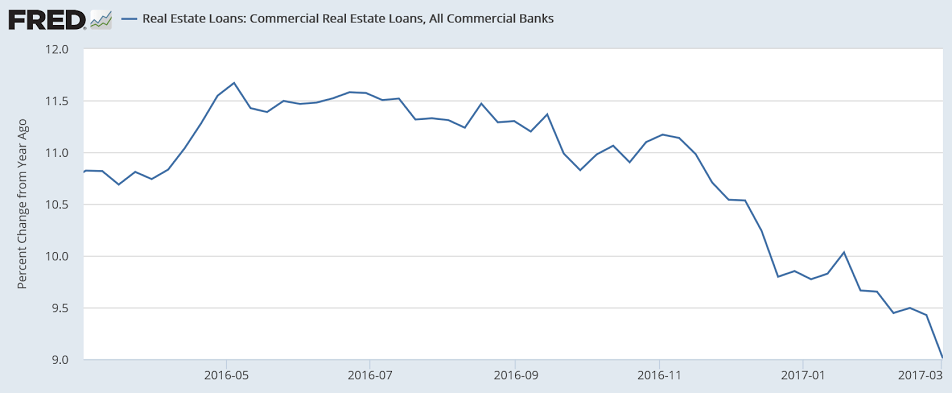
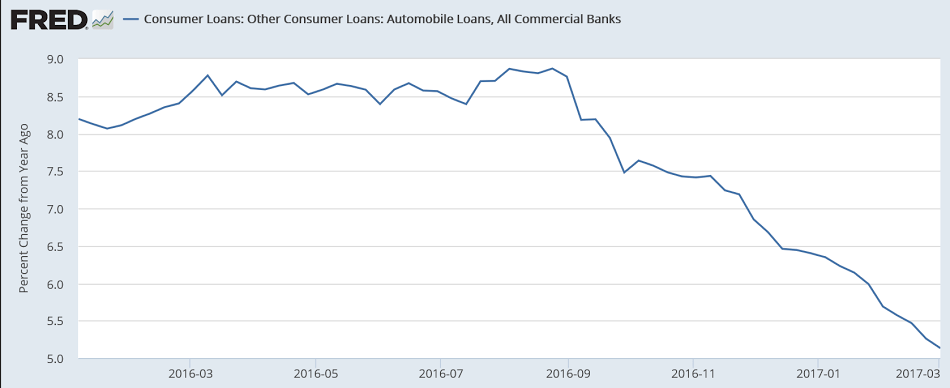
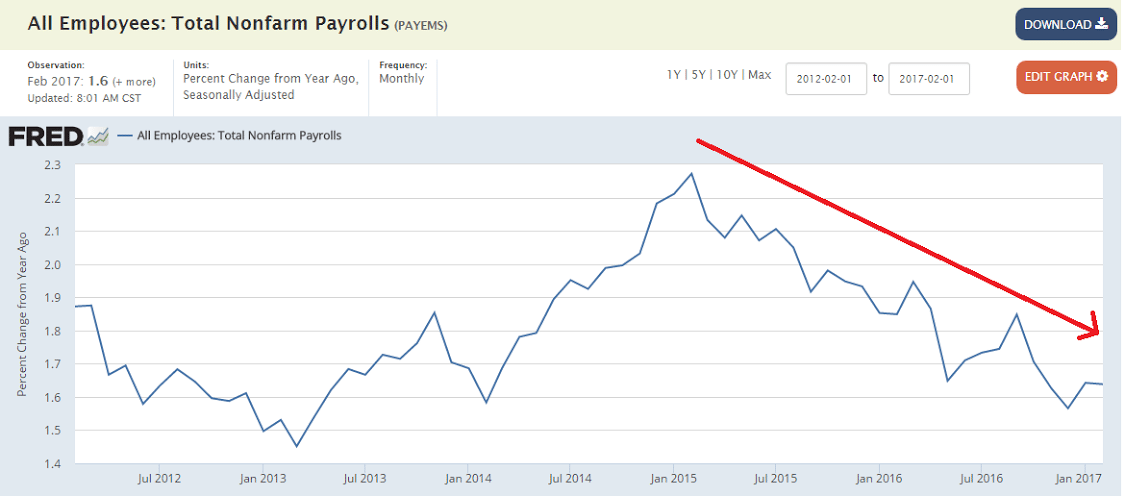
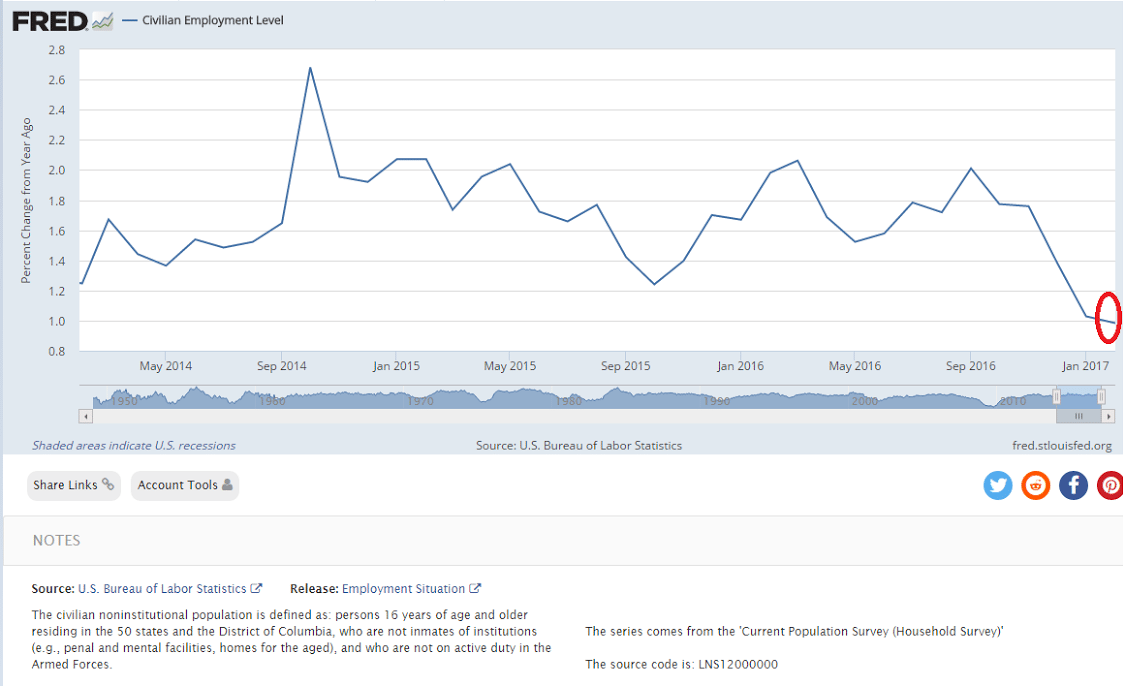
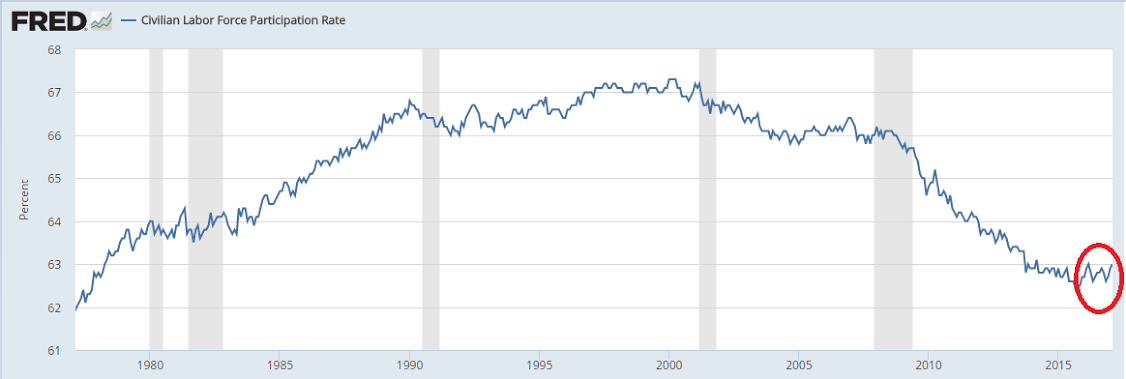
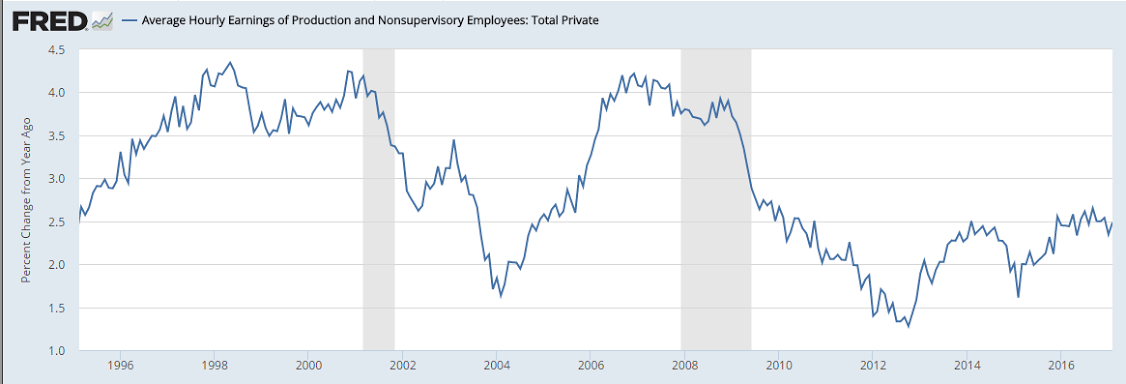
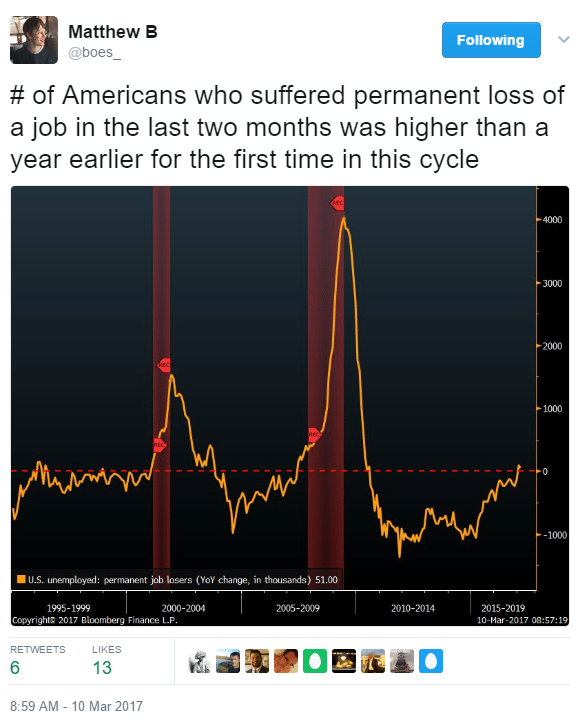
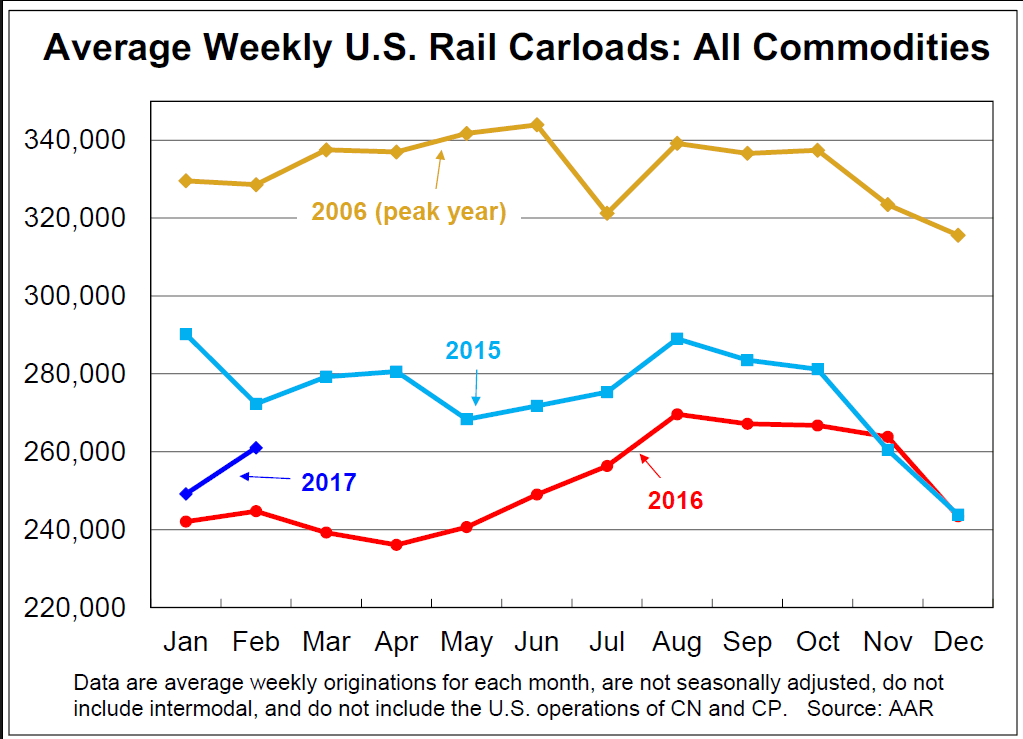
Note how the move down historically has coincided with recessions:

Credit check

Note how it’s all been decelerating since the collapse in oil capex, and most recently the deceleration has
intensified:

This is the absolute level of loans outstanding, which seems to only go negative like this in recessions

This is the annual growth rate which appears to be in a state of collapse:


Note the pattern of accelerating into recession, then decelerating:

Housing starts, Atlanta Fed Q1 GDP forecast

No houses built without a permit:

Highlights

Strength in single-family permits leads a mostly favorable housing starts report for February where however the headlines are mixed, at a 1.288 million annualized rate for starts and a 1.213 million rate for total permits. The results compare with Econoday expectations of 1.270 million for both.

Permits for single-family homes, where building costs and sale prices are the highest, rose 3.1 percent in February to an 832,000 rate that, in good news for a thinly supplied new home market, is up 13.5 percent year-on-year. This is offset, however, by a downturn in multi-family units where permits fell 22 percent in the month to a 381,000 rate that is down a yearly 11.2 percent.

Starts for single-family homes, like permits, are also favorable, up 6.5 percent to an 872,000 rate and a 3.2 percent on-year gain. Multi-family starts fell 3.7 percent in the month to 416,000 but are still up 13.0 percent on the year.

Regional data for total permits show special strength in the Midwest, a region where starts have been on a sharp decline. Starts in the Northeast are especially strong with the South also showing strength.

Yet supply relief for single-family homes is still in the offing as completions, in a detail that home builders will note, fell 6.5 percent to a 754,000 rate. Nevertheless, new supply is coming as homes under construction rose 1.3 percent to 1.091 million for the highest reading since the great bubble in October 2007.

Permits still seriously depressed vs last cycle and going nowhere for over a year now:


Down again, as is the ‘blue chip consensus’:

Mtg purchase apps, Retail sales, Business inventories, Housing index

The seasonally adjusted Purchase Index increased 2 percent from one week earlier. The unadjusted Purchase Index increased 3 percent compared with the previous week and was 6 percent higher than the same week one year ago.
Read more at http://www.calculatedriskblog.com/#rYAGsCBZRKvRLYa4.99

Depressed and moving sideways for over a year:

Prior month revised up, but current month worse than expected, and I suspect the seasonal adjustments a nominally small increase in sales to translate into a much larger seasonally adjusted number, to be reversed later in the year:

Highlights

February and January have to be averaged but together they confirm strength in the consumer. Retail spending could manage only a 0.1 percent gain in February but January, which was already solid, is now revised 2 tenths higher to 0.6 percent.

A surprising point in this report is that these headline gains, though less than astonishing, were made despite weakness in the motor vehicle component which had been strong late last year and makes up about 1/5 of total retail spending. Auto sales fell 0.2 percent in February and 1.3 percent in January. Excluding autos, February retail sales rose 0.2 percent with January showing a standout 1.2 percent surge which is the strongest monthly gain in 5 years, since February 2012.

Gasoline pulled down February’s results, falling 0.6 percent after rising 2.1 percent in January. When excluding both autos and gasoline, sales rose 0.2 percent vs January’s very strong 1.1 percent. And control group sales, which are another core measure, inched only 0.1 percent in the month but follow an outstanding 0.8 percent gain in January, one that initially posted at 0.4 percent.

It’s the January revision that is most striking and which points to an upward revision for total consumer spending in the national accounts, one that came in at only 0.2 percent in the initial January report. Yet even the two months together, retail sales, though solid, are far from the astonishingly strong readings underway in consumer confidence, a mismatch that will play out in the months ahead. Another factor to note is that January and February are the two slowest months for retail sales, which makes for an outsized effect from seasonal adjustments.


Still high and still coming down and thereby weakening output and gdp. Auto inventories are particularly bloated due to lower sales:

Highlights

Inventory growth looks moderate and stable, at an expected 0.3 percent in January and roughly in line with underlying sales growth which came in at an even more moderate 0.2 percent. The inventory-to-sales ratio is unchanged at 1.35.

Heavy auto inventories at dealerships are key right now in the inventory picture, and weakness in auto sales (posted this morning in the retail sales report) doesn’t point to much of a draw for auto inventories in February. Dealership inventories in January surged 2.4 percent with total retailer inventories at plus 0.8 percent. Excluding autos, however, retail inventories were unchanged. Manufacturer inventories rose a steady 0.2 percent in January with wholesalers reporting a 0.2 percent draw.


Trumped up expectations:

Highlights

Strong optimism is the theme of so many reports including the housing market index which is up a very sharp 6 points in March to 71 for the best reading of the economic cycle. Home builders peg current sales at an index of 78, up 7 points from February, and see future sales also at 78, for a 5 point gain. And their assessment of traffic is perhaps most telling, at 54 for an 8 point gain. This is the 3rd plus 50 score for this reading in the last 4 months and it suggests that first-time buyers, who have held down the housing sector this cycle, are also optimistic and are looking to buy a new home.

This report points to strength for permit data in tomorrow’s housing starts report and also to strength in next week’s report on new home sales. But optimism doesn’t always translate into immediate strength for hard economic data and it’s important to remember that new home sales have been struggling in recent months.

NFIB index, Redbook retail sales, Oil

Trumped up expectations falling off some,
and the details don’t look so good:


Highlights
The small business optimism index fell 0.6 points in February to 105.3, retreating slightly from the lofty levels reached in the previous months after the post-election surge in November and the largest increase in the history of the survey in December that shot the index to the highest reading since December 2004. The small decrease was in line with expectations and the fact of the index remaining above 105 for three consecutive months indicates the continuation of a very high level of optimism for small business owners.

Of the 10 components of the index, 3 slightly increased, 6 modestly declined and 1 remained unchanged. Current inventories rose 3 points to minus 2 and plans to increase inventories increased by 1 point to 3. Current job openings also rose by 1 point to 32, the highest level since December 2000. But plans to increase employment fell 3 points to 15, as did expectations of higher real sales, which fell to 26, and the view that now is a good time to expand, which also dropped 3 points to 22.

NFIB noted that business owners are being squeezed, on the one side by historically tight labor markets, where the scarcity of qualified workers pressured 26 percent of owners to raise compensation, the highest reading in 10 years. At the same time, owners are limited in how much they can increase compensation since they are not so confident of their ability to pass on the costs by raising prices for consumers. Although business owners reported higher sales in February, which rose to the first positive reading since early 2015, expectations of future higher sales did fall 3 points. And earnings trends, the outlier negative among the components, remain quite weak and weakened further in the month by 1 point to minus 13.

Though an exceptionally large net 47 percent of small business owners still expect the economy to improve, a decrease of only 1 point from the January survey, the question remains whether small business owners will turn their optimism into action. According to NFIB, this will happen when their two biggest priorities, health care and taxes, are addressed.


Marginally better but nowhere near the 3-4% gains from before oil capex collapsed:


No telling what they might do next:

Payrolls, Gasoline demand

Better than expected, but not nearly enough to even begin to conclude that the multi year deceleration has reversed:


This chart does not tell me this multi year downtrend has been broken:


And growth of the household survey is down to 1% year over year:


Participation seems to be settling in at depressed levels not seen since before women started entering the labor force:


Compare the recent gains with those of prior cycles:


Above 0 has coincided with recession:


Obama the Tea Party hero:


Substantial drop:

Mtg apps, ADP payrolls, Wholesale trade, Atlanta Fed GDP forecast, Tax refund delays

The growth rate has slowed and the level of apps remains depressed:


Nice move up. This is just a forecast of Friday’s number:

Highlights

The February employment report looks to be a blockbuster based on ADP’s estimate for giant growth of 298,000 in private payrolls. This would be the biggest gain since October 2015 and one of the very largest of the cycle. ADP isn’t always followed closely but its call last month for outsized growth in January payrolls did prove correct.

Mark Zandi, chief economist of Moody’s Analytics said, “February was a very good month for workers. Powering job growth were the construction, mining and manufacturing industries. Unseasonably mild winter weather undoubtedly played a role. But near record high job openings and record low layoffs underpin the entire job market.”
Read more at http://www.calculatedriskblog.com/#Gvm71i5cM1idEJoW.99

Highlights

Wholesale inventories fell 0.2 percent in January while sales declined 0.1 percent, a comparison that keeps stock-to-sales at a healthy 1.29 ratio. Auto inventories at the wholesale level were depleted in the month, down 3.1 percent against a 3.2 percent rise in sales which points to restocking and a gain for auto production.

Wholesale inventories have been steady as have factory inventories, though retail inventories have been less lean. Low inventories are a plus for the economy but a negative for the GDP calculation which makes today’s report an early negative for first-quarter GDP. January data on February retail inventories will be posted next week with the business inventories report.

Trumped up surveys while the hard data continues to head way south:

Might explain the recent weakness…

A new law prevented the Internal Revenue Service from paying out refunds for tax returns claiming those credits until mid-February, and the agency warned those households not to expect access to their money until Feb. 27 due to processing and other delays.

The law, intended to prevent fraud by giving the IRS time to double-check income data, caused many refund payments to go out later than usual this year. As of Feb. 10, the IRS said it sent out 14.1 million refunds totaling $28.93 billion—down sharply from 2016, when 29.2 million refunds totaling $94 billion were sent through Feb. 12. The tax agency began to release those postponed payments around the middle of the month and by Feb. 17, the IRS said it had sent 32.9 million refunds totaling $103.24 billion.

Trade, Consumer credit

As previously discussed, trade looks to be more negative in q1 than it was in q4:

Highlights

January’s trade deficit came in very deep but at least right on expectations, at $48.5 billion and reflecting a surge in foreign consumer and vehicle imports and higher prices for imported oil.

January imports rose 2.3 percent from December to $197.6 billion with imports of consumer goods jumping 2.4 percent to $52.1 billion and with vehicle imports up 1.3 percent to $13.6 billion. Petroleum imports totaled $15.3 billion in the month, up 19 percent and reflecting both higher prices, at $43.94 per barrel vs December’s $41.45, and a rise in volumes, at 8.4 million barrels per day vs 7.7 million.

Though dwarfed by imports, exports did rise 0.6 percent to $128.0 billion led by industrial supplies (where higher oil prices are at play) and also a 1.3 percent gain for vehicle exports to $13.6 billion as well as a $0.6 billion gain for foods. Exports of capital goods fell a sharp 1.9 percent to $43.5 billion in a decline that only partially reflected aircraft. Exports of services, usually the strength for the U.S., were unchanged in the month at $64.1 billion.

Unadjusted country data show a monthly widening with China, to a monthly deficit of $31.3 billion, and a widening with Canada, at $3.6 billion. Deficits narrowed with the EU, to $11.5 billion, with Japan, to $5.5 billion, and with Mexico, to $4.0 billion.

Strong demand for foreign goods and light demand for U.S. services and capital goods is not a favorable mix for GDP. This report puts first-quarter GDP on the defensive.

Higher oil prices and the end of the one time surge in soybean exports, etc:


A lot worse than expected:

Highlights

Consumers held back on credit-card borrowing in January as nonrevolving credit fell $3.8 billion for the first monthly decline since February last year and the largest since December 2012. But nonrevolving credit, where vehicle financing and student loans are tracked, rose a respectable $12.6 billion and offers a reminder that overall credit growth, including revolving credit, has been steady. Yet, at least for January, nonrevolving credit couldn’t offset the weakness in revolving credit as total credit increased only $8.8 billion for the smallest rise since July 2012.

Factory orders, Rail Carloads, Trump comments

Back to slow growth from the lower levels:


Durable goods orders:


Capital goods:


It’s gone from bad to worse. Hard to see how this can continue much longer:

Trump’s Wiretap Claims: What We Know and What We Don’t

White House sources acknowledge that Trump had no idea whether the claims he was making were true when he made them. He was basing his claims on media reports—some of them months old—about the possibility that the Foreign Intelligence Surveillance Court may have authorized surveillance of Trump associates, presumably pursuant to a federal investigation of their ties to Russia.

Later Saturday morning, White House Counsel Don McGahn told staffers to avoid discussions about the president’s tweets or any possible investigation—an order that effectively paralyzed the White House staff for much of the day. Staffers were afraid to talk to one another for fear of running afoul of McGahn’s guidance and even those authorized to talk to the media were nervous about doing so.

At 8:55 on Sunday morning, the White House issued a statement about the president’s tweets and the ensuing controversy. “Reports concerning potentially politically motivated investigations immediately ahead of the 2016 election are very troubling. President Donald J. Trump is requesting that as part of their investigation into Russian activity, the congressional intelligence committees exercise their oversight authority to determine whether executive branch investigative powers were abused in 2016. Neither the White House nor the President will comment further until such oversight is conducted.”

The formal language masks the rather extraordinary work that this statement is doing: The White House is asking Congress to investigate in order to determine whether President Trump’s tweeted claims were true.