NFIB small business index, household spending expectations, restaurant performance index, Trump news

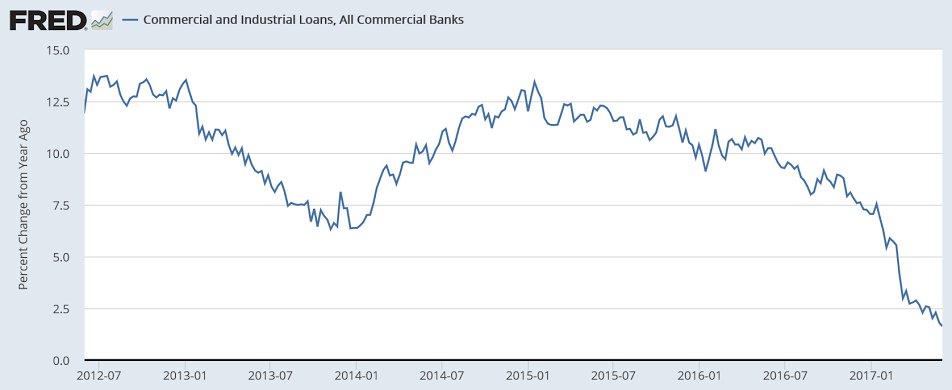
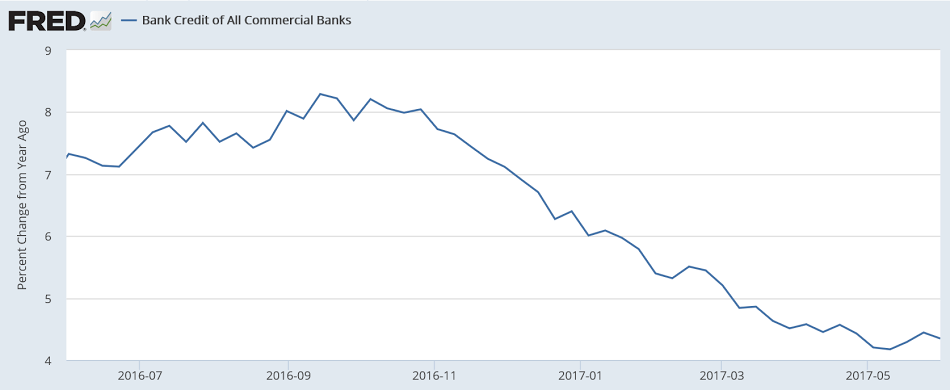
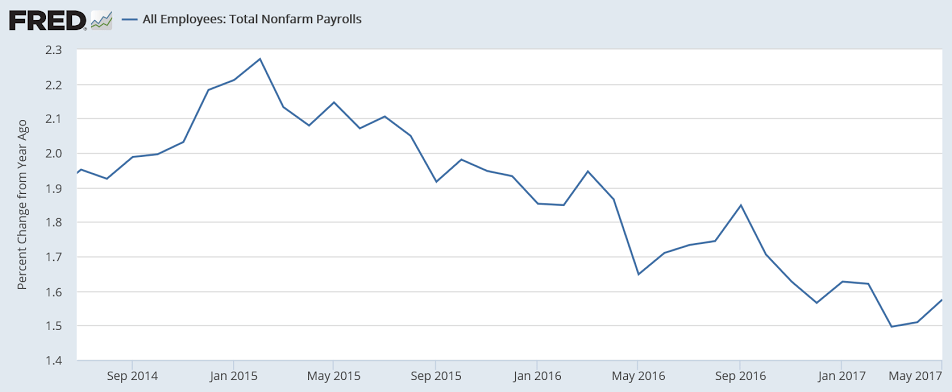
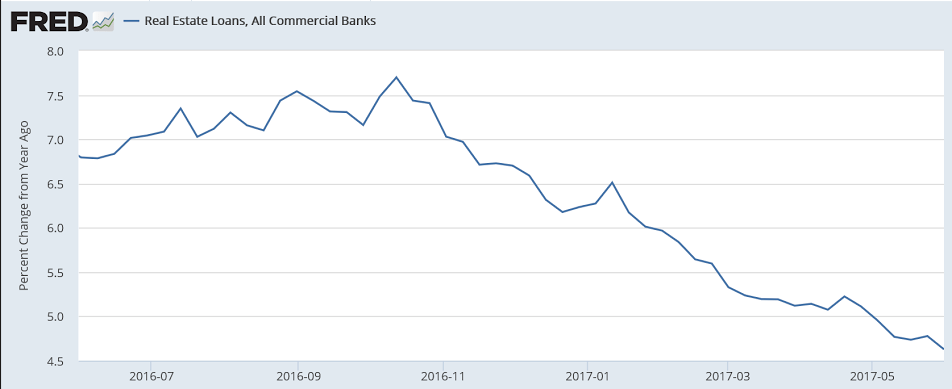
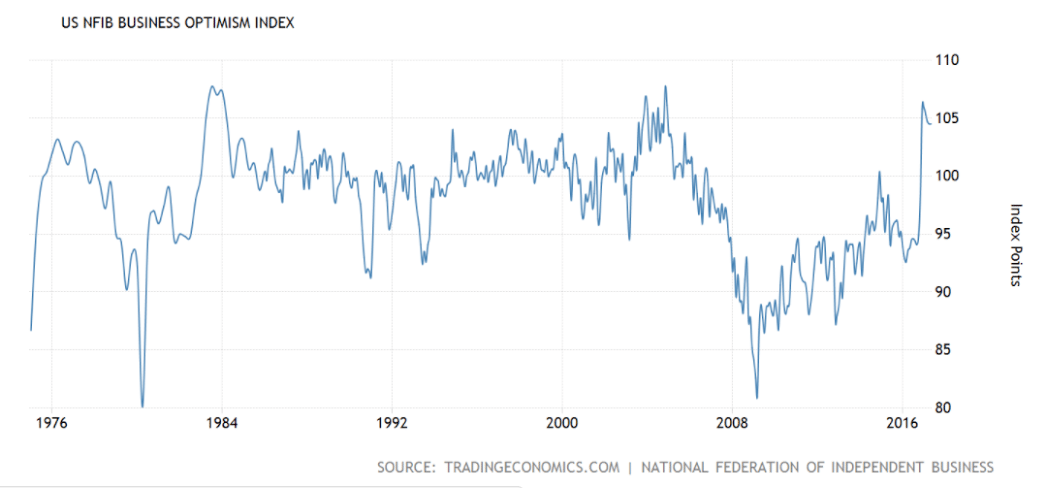
Trumped up expectations coming off only slowly. Actual business conditions have
not yet responded:

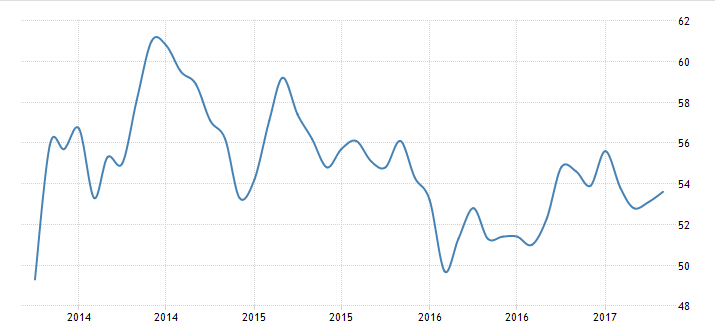
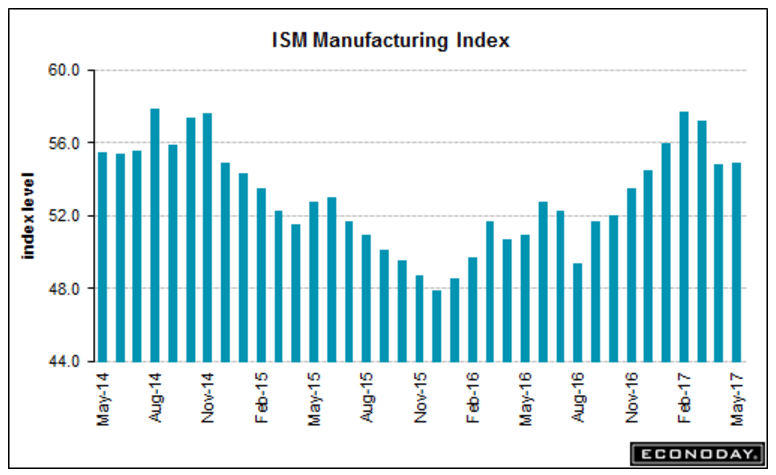
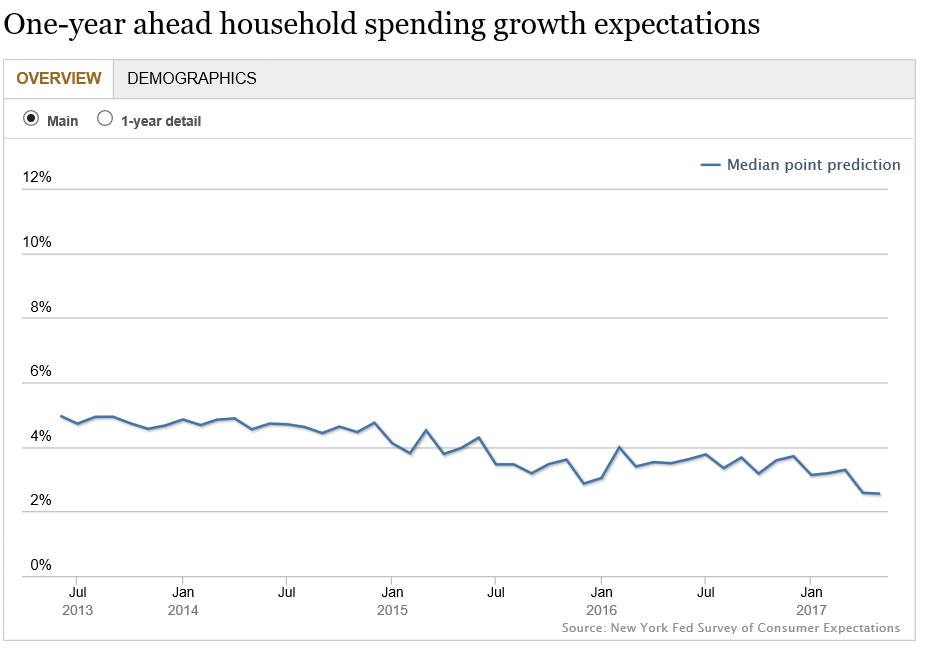
Not much optimism here:

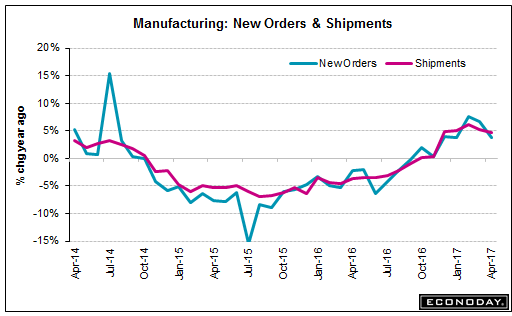
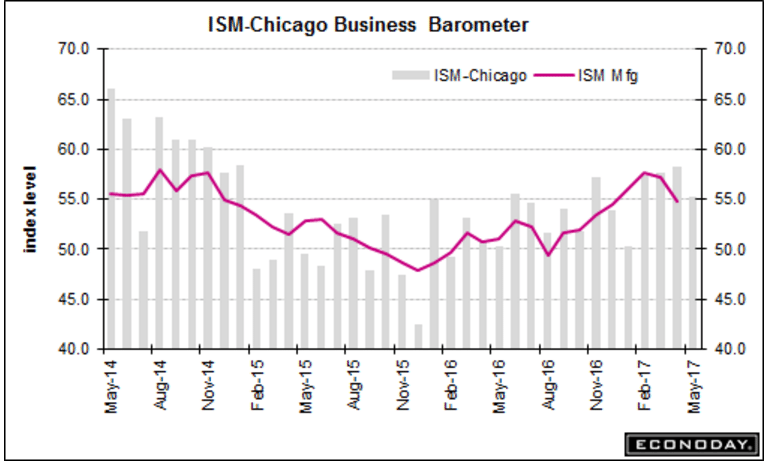
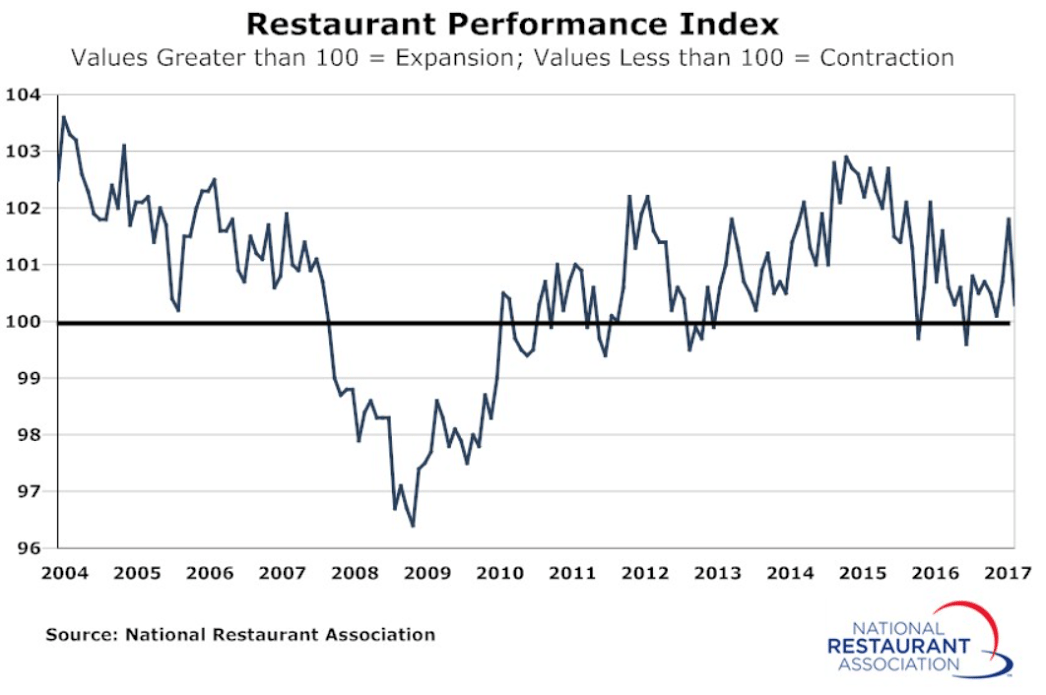
Trumped up expectations reversed more quickly here:

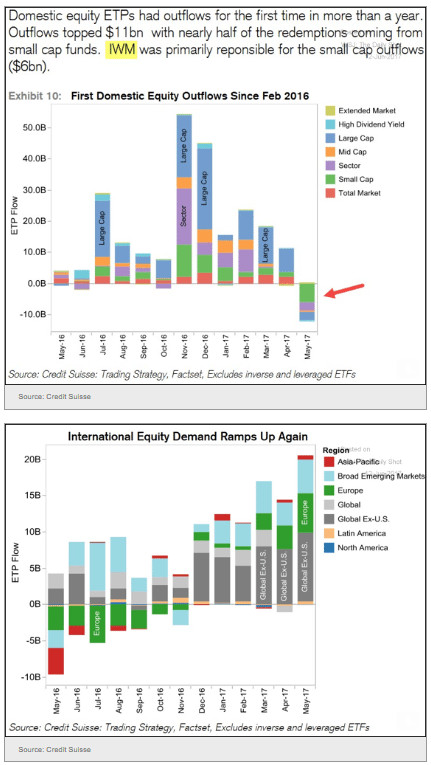
Indicates active selling of US equities and buying of euro equities. This could be part of the process of portfolio managers selling $US to buy euro, reversing shifting in the other direction for the last several years as portfolios shifted out of euro due to political fears and fears of ‘money printing’ by the ECB, which have failed to be of expected consequence.

Meanwhile, at current fx prices, the massive euro area trade surplus continues, which is by identity a ‘rest of world’ deficit, ‘draining’ that many net euro from the global economy:

This was yesterday’s news and has already been replaced by today’s stories as this type of thing seems to be growing exponentially:

“Never has there been a president, with few exceptions … who has passed more legislation, done more things,” Trump declared, even though Congress, which is controlled by his party, hasn’t passed any major legislation.

He hailed his plan for the “single biggest tax cut in American history,” even though he hasn’t proposed a plan and Congress hasn’t acted on one.

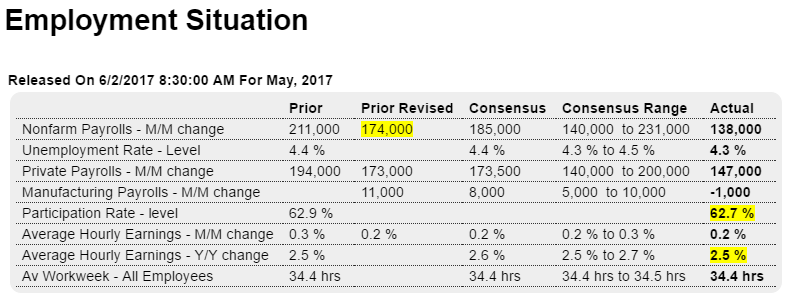
He said “no one would have believed” his election could have created so many new jobs over the past seven months (1.1 million), even though more jobs (1.3 million) were created in the previous seven months.

Credit check, Fed comment

The collapse continues.

With total bank credit just over $12.5 trillion, it’s about $500 billion less than it would have been had last year’s loan growth continued.

If this lower rate of loan growth continues, and isn’t replaced by some other channel that facilitates agents spending more than their incomes, the implication is that GDP could be a full 2% less than last year, as a substantial portion of bank lending finances purchases of real goods and services:

Looks like another rate hike coming from the Fed next week.

Seems to me the Fed models (not mine) tell them rates work through the credit channels, the idea being a rate hike will slow down credit growth and thereby keep the economy from overheating, etc.

But with credit growth as it is per the above charts, seems they are already decelerating.

So what would be the point of a rate hike?

To make credit growth decelerate even faster?

JOLTS, Q1 Mortgage Report

Maybe the reasoning openings are so much higher than hires is because openings are for jobs that pay less than current employees are earning, in the hopes the company can replace them? ;)

Highlights

Job openings are nearly 1 million ahead of hirings in a widening spread pointing to skill scarcity in the labor market. Job openings totaled 6.044 million in April which is well outside Econoday’s high estimate for 5.765 million and up from a revised 5.785 million in the prior month. Hirings totaled 5.051 million which is well down from March’s 5.304 million with the spread between the two nearly 150,000 higher at 993,000.

Job openings, representing labor demand, is a complementary statistic to unemployment, which represents labor supply. Useful comparisons for this report are the 6.9 million unemployed and the 12.4 million in the total available labor pool. The gap between openings and hiring first opened up about 2 years ago signaling that employers are having a hard time finding people with the right skills. Today’s report offers confirmation that demand for labor, in distinction to hiring, is a chief feature of the economy.

This chart doesn’t look so good to me:

Press Release: Black Knight’s Mortgage Monitor: Q1 2017 Originations Fall 34 Percent, Led By 45 Percent Drop in Refinance Lending; Despite Recent Rate Softening, Home Affordability Remains Near Post-Recession Low

Today, the Data & Analytics division of Black Knight Financial Services, Inc. released its latest Mortgage Monitor Report, based on data as of the end of April 2017. This month, Black Knight looked at Q1 2017 purchase and refinance originations, finding significant quarterly declines in volume among both. As Black Knight Data & Analytics Executive Vice President Ben Graboske explained, the declines are rooted in the upward interest rate shift seen in Q4 2016.

“Overall, first lien mortgage originations fell by 34 percent in the first quarter of 2017,” said Graboske. “As expected, the decline was most pronounced in the refinance market, which saw a 45 percent decline from Q4 2016 and were down 20 percent from last year. They also made up a smaller share of overall originations than in the past; just 45 percent of total Q1 originations were refinances vs. 54 percent in Q4 2016. Purchase originations were also down 21 percent from Q4 2016, although the first quarter is historically the calendar-year low for such lending. Purchase lending was up year-over-year, but the three percent annual growth is a marked decline from Q4 2016’s 12 percent, and marks the slowest growth rate Black Knight has observed in more than three years – going back to Q4 2013. At that point in time, interest rates had risen abruptly – very similarly to what we saw at the end of 2016 – and originations slowed considerably. The same dynamic is at work here.

“Likewise, refinance lending among higher-credit-score borrowers, who have largely driven the refinance market these past several years, saw a quarterly decline of 50 percent. As we’ve seen in the past, these borrowers tend to strike quickly and often when interest rate incentives are present, but tend to hold back when the conditions are less favorable. At the other end of the credit spectrum, lower credit borrowers – those with credit scores below 700 – only saw refinance volumes decrease by 24 percent. Again, we saw a similar phenomenon when rates rose in late 2013/early 2014. This is worth noting as we monitor the future performance of 2017 originations. Not only are refinances — which generally tend to outperform purchase mortgages — making up a smaller share of the market, but there’s also been a net lowering of average credit scores as well. The average Q1 2017 refinance credit score was 742, down from 751 in Q4 2016, and the lowest average credit score since Q3 2014. Both of these factors could have a dampening factor on mortgage performance, holistically speaking.”

Read more at http://www.calculatedriskblog.com/#IWytwlvI9bjUdXXs.99

Interest rates, PMI services, Factory orders, ISM services

So I was reminded that I did write and post in November about what might happen if rates went up in anticipation of Fed hiking in a weak loan demand environment. (Thanks David for reminding me!) I was thinking that some portion of whatever borrowing interest there was might no longer qualify, causing a decline in the growth of borrowing to spend by businesses as well as consumers.

If rates go up when loan demand is strong enough so the borrowing continues, the added loan payments flow back to earnings for the lender, and govt. pays more interest, so it can all not only keep going but accelerate. However, if demand is weak, and rates go up as they did late last year due to anticipation of Fed hikes, borrowing and spending can decelerate, as per the charts:

A couple of other indicators that started sagging in November:

Highlights

Moderate is the message from the PMI services index which finishes May at a lower-than-expected 53.6, down 4 tenths from the mid-month flash but up a solid 1.1 points from final April and up 5 tenths from April’s flash. Most readings rose back to strength early in the year including new orders with backlog orders showing their first build since January. Employment is at a 3-month high with optimism on the general outlook, however, remaining subdued. There are badly needed signs of inflation in the report with input costs on the rise and selling prices also moving higher. This is a positive though far from robust report. Up next is the ISM non-manufacturing report which has been running much stronger than the services PMI with the Econoday’s consensus at 57.0.

Highlights

The weak run of second-quarter data continues with April’s 0.2 percent decline in factory orders. The durable goods component fell 0.8 percent in the month reflecting a give back in aircraft orders and wide weakness for most readings. Orders for non-durable goods rose 0.4 percent reflecting moderate gains for food and energy.

The ex-transportation reading, which excludes aircraft, managed only a 0.1 percent gain in the month with core capital goods orders (nondefense ex-aircraft) also up only 0.1 percent. April’s shipments of core capital goods, which are an input into second-quarter GDP, also rose only 0.1 percent which is another negative in this report. And only a marginal positive for GDP is a 0.1 percent rise in total inventories. Total shipments were unchanged in the month keeping the inventory-to-shipments ratio unchanged at 1.38.

Positives in the report include a 0.6 percent rise for motor vehicle orders and a 1.6 percent rise for computers. Also total unfilled orders, which contracted through most of last year, are up 0.2 percent for a second straight small gain.

Another positive in the report is an upward revision to March factory orders which now stand at 1.0 percent following February’s 0.8 percent gain. But the prior gains were driven by aircraft as the ex-transportation reading could move only modestly higher. The factory sector is not living up to the promise of the high-flying regional reports and, instead of accelerating this year, now appears to be struggling.

Credit check

The charts show it all went bad around November. And it continues to deteriorate with every passing week, with the latest data showing cars, housing, and employment decelerating accordingly.
Must have been some event that set it off? It was around the time of the election, but I can’t recall specifically what would set off something like this?
Comments welcome!

Employment, Trade

The chart says it all- deceleration that started when oil capex collapsed not abetting, and the decelerating credit charts indicate much more of same coming:

Highlights

An unexpectedly weak employment report has put a rate hike at this month’s FOMC in doubt. Nonfarm payrolls rose only 138,000 in May which is nearly 50,000 below expectations. Importantly, April and March have been downwardly revised by a net 66,000.

Average hourly earnings are also not favorable, up only 02 percent in May with April revised down 1 tenth and now also at 0.2 percent. Wages are going nowhere with the year-on-year rate sitting at 2.5 percent.

A fall in the participation is yet another negative, down 2 tenths to 62.7 percent and pulling the unemployment rate down 1 tenth to only 4.3 percent. Unemployment is very low and contrasts with the lack of wage pressure.

Manufacturing jobs fell 1,000 in May, retail trade down 6,000, and government down 9,000. There were gainers including construction at 11,000, financial also at 11,000, and professional services at a healthy 38,000.

And these gains tell the other side of this report, that payroll growth, though moving lower, is still healthy. That is what the hawks are going to have argue at the June 13 & 14 meeting, that and the theoretical inevitability that wage pressures will soon build.

Higher than expected trade deficit means GDP was that much lower than expected. And all highly $US unfriendly:

Highlights

The bad news is accelerating for the second quarter. The trade deficit widened in April to $47.6 billion from a revised $45.3 billion in March. This opens the quarter on yet another defensive front.

Exports fell 0.3 percent in April to $191.0 billion as a fractional rise in service exports to $64.0 billion could not outmatch a 0.4 percent decline in goods exports to $126.9 billion.

Imports meanwhile jumped 0.8 percent to $238.6 billion with increasing pressure centered in goods but also including services.

The best positive in the details is a rise in aircraft exports and the worst negative is yet another jump in consumer goods imports, up $2.0 billion in the month to $51.0 billion. Country data show a sharp widening with China, to a $27.6 billion total gap in the month, with the EU gap also up sharply to $14.6 billion.

The conclusion? U.S. demand for foreign products is strong and foreign demand for U.S. products is not.

ADP employment, Construction spending, PMI and ISM manufacturing, Car sales

While it did spike up some this week, the downtrend is still intact as per the chart:

Highlights

On the strong side this year, ADP is calling for a resumption of outsized employment gains, at 253,000 for private payrolls in tomorrow’s May employment report vs Econoday’s consensus for 172,000 (Econoday’s consensus has since moved to 173,500 following ADP’s report). ADP has been hitting and missing this year, making remarkably good calls for oversized strength in January and February followed by a very bad call for a third month of strength in March, a month that came up well short. ADP’s call for April was respectably accurate, at 177,000 (now revised to 174,000) vs actual private payroll growth of 194,000.

More stats that supported q1 gdp seem to be reversing for q2:

Highlights

Volatility once again hits the construction spending report where an unexpected sharp decline in April, at minus 1.4 percent, is offset by a giant upward revision to March which now stands at plus 1.1 percent vs an initial 0.2 percent dip.

The residential side of the report, at minus 0.7 percent in April, shows the first decline in 7 months, pulled lower by a sharp drop in residential improvements and spending on new condos that offset a solid 0.8 percent gain for new single-family homes.

The non-residential side shows a 0.6 percent decline for private building, hit by contraction for factories and power plants, and a 2.0 percent dip for public building with both highways and education lower.

This report is yet another bad result for April as the upward revision to March pulled spending out of the second quarter and into the first. And it’s the second quarter that is in focus right now and housing, including sales and starts and now construction, have all been disappointing.

Highlights

Growth in Markit’s U.S. manufacturing sample is as slow as it has been in 8 months, at 52.7 and little changed from the mid-month flash (52.5) and April (52.8). Growth in this sample peaked in January at 55.0 and has been moving lower as new orders, also at an 8-month low, and employment have slowed. Production is steady at a modest level and the sample, in a sign of caution, continues to work down inventories. Other details include slowing in both input costs and selling prices and weakness in export sales. This report, of all the private manufacturing reports, has been signaling the weakest conditions for a factory sector that opened the year with promise which it has yet to fulfill. Watch for the ISM report coming up at 10:00 a.m. ET this morning.

Worse than expected and on the decline. 2017 now forecast to be lower than 2016, all confirmed by the chart showing auto loan growth slowing:

Mortgage purchase applications, ISM Chicago, Pending home sales, Vehicle sales

Another down week but still a bit higher than last year. But actual loan growth is far lower than last year:


Trumped up expectations coming down:

Highlights

Business growth is slowing in the Chicago area with weakness appearing in orders. The May PMI of 55.2, though down more than 3 points in the month, is still very solid but new orders slowed abruptly in the month to a 4-month low with backlog orders in contraction for a sixth straight month. Employment is flat and production is slowing. A factor that adds to the headline composite is slowing in delivery times which the report attributes in part to lack of inventories among suppliers. Input costs are also easing but remain elevated. This report, which tracks all areas of Chicago’s economy, is not showing the acceleration consistent with general expectations for a second-quarter surge.

This seal it for the housing market:

Highlights

Spring sales data have not been favorable for the housing sector. Pending home sales are down for a second straight month, 1.3 percent lower in April to an index of 109.8 which is 3.3 percent below this time last year. This index tracks contract signings for resales and the results point to weakness for final sales in May and June. Final resales contracted in April as did new home sales while the month’s housing starts were also weak. Spring is the big season for housing and these are not the results of a sector that will be leading the 2017 economy.

Vehicle sales looking weak again for tomorrow’s release:

U.S. auto sales seen up 0.5 percent in May: JD Power and LMC

May 25 (Reuters) — The seasonally adjusted annual rate for the month will be 16.9 million vehicles, down from 17.3 million last year.

The consultancies cut new vehicle sales forecast for 2017 to 17.2 million units from 17.5 million units.

U.S. sales of new cars and trucks hit a record high of 17.55 million units in 2016. But as the market has begun to saturate, automakers have been hiking incentives to entice consumers to buy.

Major automakers posted declines in U.S. new vehicle sales for April, an indication of the long boom cycle that lifted the American auto industry to record sales last year losing steam. (reut.rs/2qnsNQa)

“While consumers will see substantial discounts this Memorial Day weekend, they are not expected to overcome the slowing demand in auto sales,” said Deirdre Borrego, senior vice president of automotive data and analytics at J.D. Power.

The consultancies said consumer discounts averaged $3,583 per unit, a record for the month, surpassing the previous high for the month of $3,342, set in May last year.

The average number of days a new vehicle sits on a dealer’s lot before being sold hit 71 in the first 14 days of May, the highest level for any month since July 2009.

Personal income and spending, consumer confidence, small business hires, gone mainstream…

As expected with prior month’s spending revised up .2. Annual growth rates still not looking so good, as per the charts:

Highlights

April was mostly a favorable month for the consumer who benefited from strong wage gains, kept money in the bank, and was an active shopper at least compared to the first quarter. Consumer spending opened the second quarter with an as-expected 0.4 percent gain with strength in durables spending, including vehicles, offsetting another subpar increase, however, for services at only 0.3 percent. Personal income rose 0.4 percent in April with the wages & salaries component posting an outsized 0.7 percent gain and offsetting weakness in proprietor income and interest income. The savings rate held at 5.3 percent for a third straight month.

Inflation data in this report, which are the FOMC’s key inflation gauges, are more subdued than the spending readings. The core PCE (less food & energy) managed a 0.2 percent monthly gain but the year-on-year rate slipped another 1 tenth to 1.5 percent. This is the lowest rate since December 2015 with this year’s weak pressures having erased a full year of improvement. Overall prices also rose 0.2 percent with this year-on-year rate also lower, down 2 tenths to 1.7 percent.

A small positive in the report is an upward revision to March spending from no change to plus 0.3 percent. That’s a positive, however, that falls into the first quarter, not the second which is the focus right now. Consumer spending put in a respectable April but nothing spectacular which some had been expecting given positive seasonal factors including the inclusion of Easter. But the inflation readings are very quiet and won’t be raising expectations much further for a rate hike at the June FOMC.


Health care premiums count as personal consumption expenditures and you can see how they have influenced total pce which is now weakening again:


Trumped up expectations coming down:

Small business hires fall in May, but employees got raises, Paycheck survey shows

By Berkeley Lovelace Jr.

May 30 (CNBC) —

  • Small business hiring fell in May, but wages continued to rise, Paychex says.
  • The Small Business Jobs Index now has its weakest three-month change since July 2009.
  • “Small business owners now seem to be taking a more wait-and-see approach to hiring,” Paychex President and CEO Martin Mucci says.
  • Looks like I’m now officially mainstream with the latest paper I wrote with Professor Silipo published in a mainstream economics journal:

    Dear Warren Mosler,

    Your paper “Maximizing price stability in a monetary economy” that has just been published today on “Journal of Policy Modeling” has been found by Peerus.
    Peerus is an App that monitors your scientific field – Journals, Authors (colleagues / competitors), Keywords – and identifies new papers as soon as there are published.