Maybe the reasoning openings are so much higher than hires is because openings are for jobs that pay less than current employees are earning, in the hopes the company can replace them? ;)

Highlights
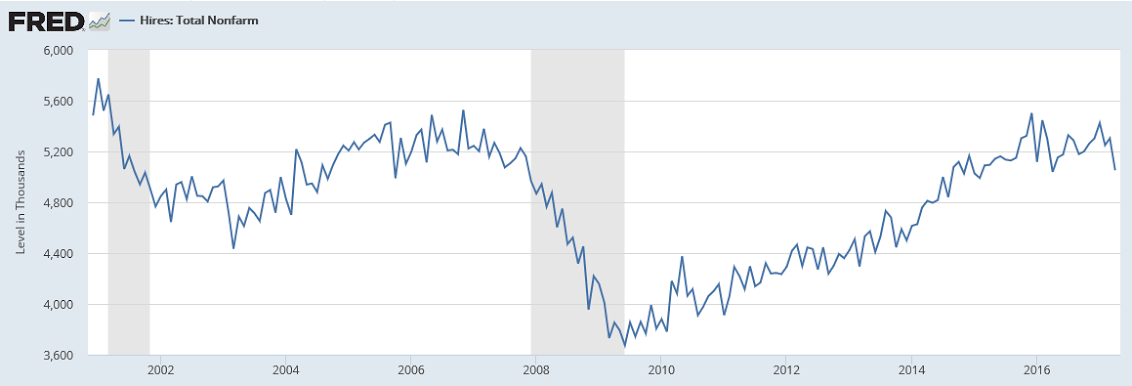
Job openings are nearly 1 million ahead of hirings in a widening spread pointing to skill scarcity in the labor market. Job openings totaled 6.044 million in April which is well outside Econoday’s high estimate for 5.765 million and up from a revised 5.785 million in the prior month. Hirings totaled 5.051 million which is well down from March’s 5.304 million with the spread between the two nearly 150,000 higher at 993,000.
Job openings, representing labor demand, is a complementary statistic to unemployment, which represents labor supply. Useful comparisons for this report are the 6.9 million unemployed and the 12.4 million in the total available labor pool. The gap between openings and hiring first opened up about 2 years ago signaling that employers are having a hard time finding people with the right skills. Today’s report offers confirmation that demand for labor, in distinction to hiring, is a chief feature of the economy.
This chart doesn’t look so good to me:

Today, the Data & Analytics division of Black Knight Financial Services, Inc. released its latest Mortgage Monitor Report, based on data as of the end of April 2017. This month, Black Knight looked at Q1 2017 purchase and refinance originations, finding significant quarterly declines in volume among both. As Black Knight Data & Analytics Executive Vice President Ben Graboske explained, the declines are rooted in the upward interest rate shift seen in Q4 2016.
“Overall, first lien mortgage originations fell by 34 percent in the first quarter of 2017,” said Graboske. “As expected, the decline was most pronounced in the refinance market, which saw a 45 percent decline from Q4 2016 and were down 20 percent from last year. They also made up a smaller share of overall originations than in the past; just 45 percent of total Q1 originations were refinances vs. 54 percent in Q4 2016. Purchase originations were also down 21 percent from Q4 2016, although the first quarter is historically the calendar-year low for such lending. Purchase lending was up year-over-year, but the three percent annual growth is a marked decline from Q4 2016’s 12 percent, and marks the slowest growth rate Black Knight has observed in more than three years – going back to Q4 2013. At that point in time, interest rates had risen abruptly – very similarly to what we saw at the end of 2016 – and originations slowed considerably. The same dynamic is at work here.
“Likewise, refinance lending among higher-credit-score borrowers, who have largely driven the refinance market these past several years, saw a quarterly decline of 50 percent. As we’ve seen in the past, these borrowers tend to strike quickly and often when interest rate incentives are present, but tend to hold back when the conditions are less favorable. At the other end of the credit spectrum, lower credit borrowers – those with credit scores below 700 – only saw refinance volumes decrease by 24 percent. Again, we saw a similar phenomenon when rates rose in late 2013/early 2014. This is worth noting as we monitor the future performance of 2017 originations. Not only are refinances — which generally tend to outperform purchase mortgages — making up a smaller share of the market, but there’s also been a net lowering of average credit scores as well. The average Q1 2017 refinance credit score was 742, down from 751 in Q4 2016, and the lowest average credit score since Q3 2014. Both of these factors could have a dampening factor on mortgage performance, holistically speaking.”
Read more at http://www.calculatedriskblog.com/#IWytwlvI9bjUdXXs.99
