Housing starts, Industrial Production, Q3 GDP

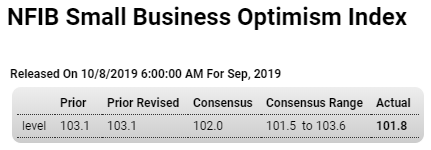
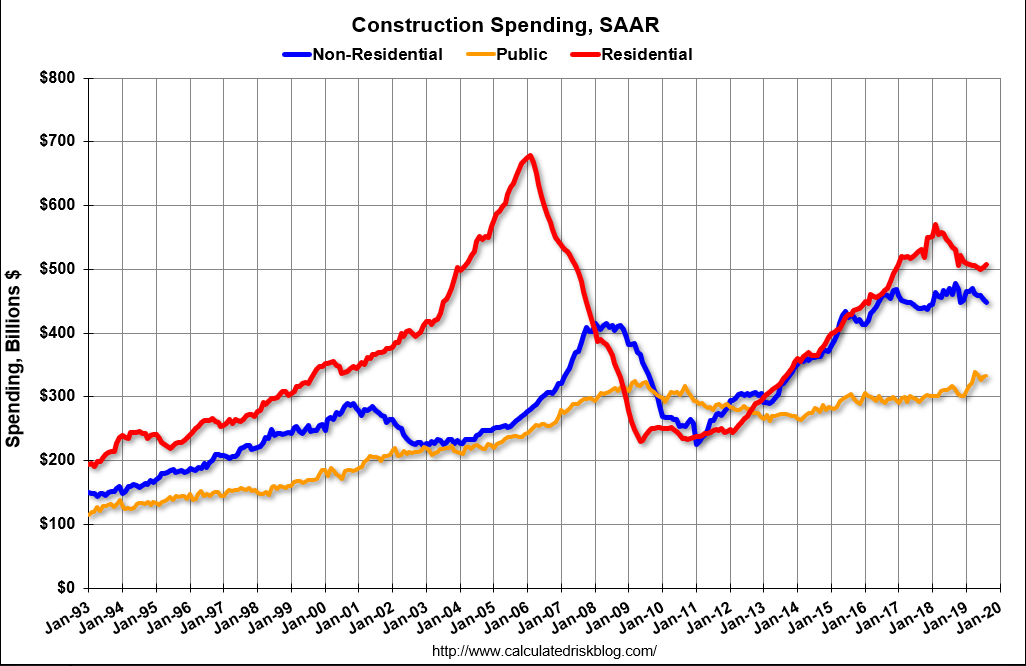
Fell back this month after last month’s spike from the drop in rates and still looking to me like it’s going nowhere from historically depressed levels, and not population adjusted:

Highlights

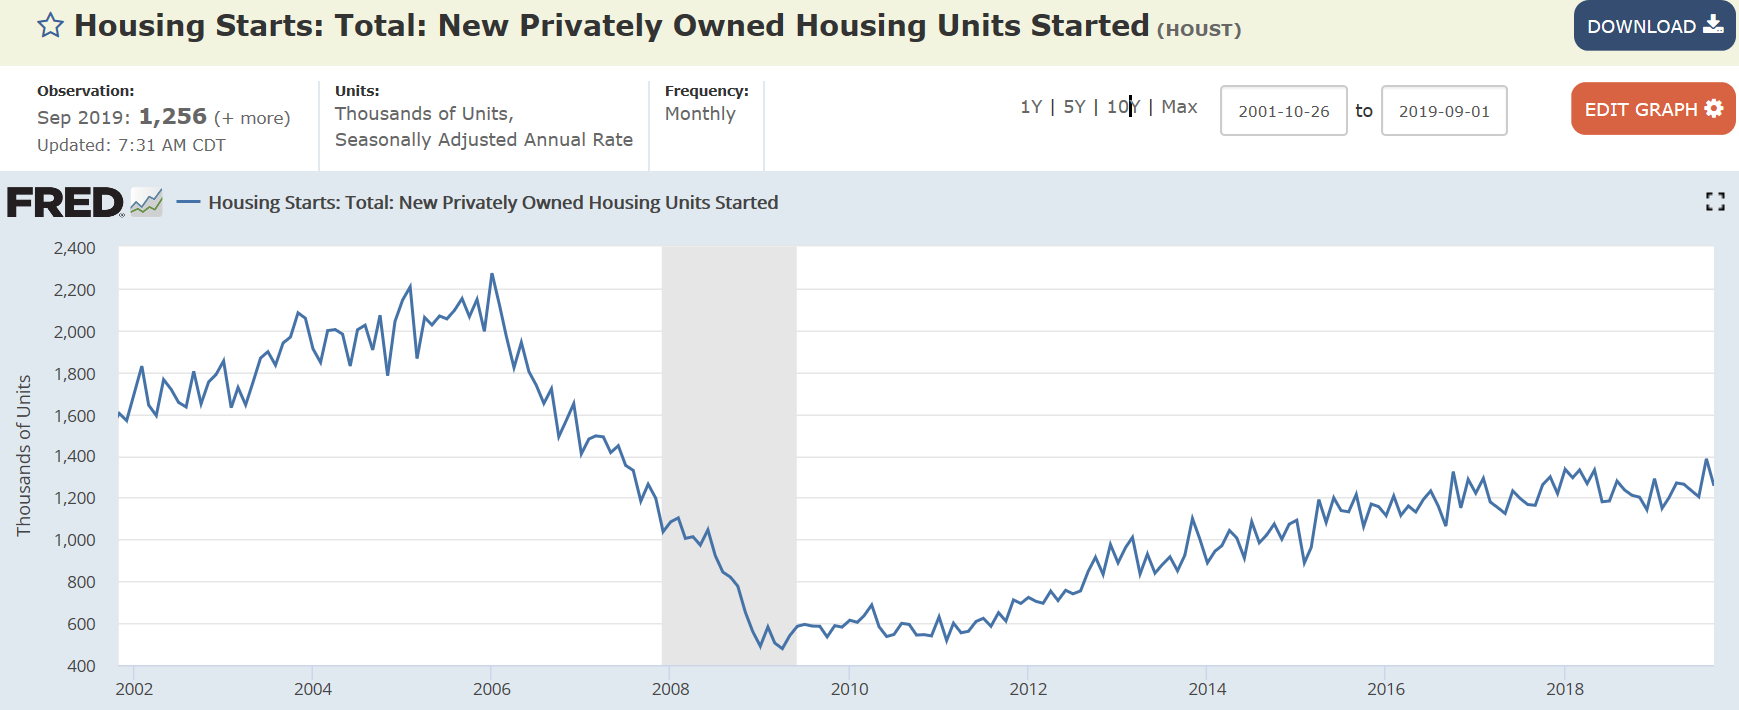
Upward trajectory is the theme of housing starts and permits, in data where September’s headlines don’t always tell the fundamental story. Housing starts came in at a 1.256 million annual rate in September that falls not only well short of expectations but also August which is revised higher to 1.386 million. But behind the headline is a small gain, to 918,000, for single-family starts. These pack more GDP punch per unit than multi-family starts which dropped a very sharp 28.2 percent to 338,000. The three-month average for single-family starts is up very sharply, at 901,000 for the 5th straight increase.

Permits for single-family homes are keeping pace with starts, at 882,000 in the month with this three-month average up 20,000 to 862,000 for a fourth straight increase. Total permits dipped back to 1.387 million reflecting a sharp fall in multi-units to 505,000.

Year-on-year, single-family starts are up 4.3 percent with single-family permits up 2.8 percent. These are solid positives for residential investment which, after six straight quarters of pulling GDP lower, may yet contribute positively to third-quarter GDP. But the weakness in multi-family units is a risk for residential investment with starts here down 5.1 percent on the year though permits, in what points to emerging strength and only temporary weakness for starts, up a very sharp 17.4 percent.

A negative in today’s report is decline in completions, down for single-family and multi-units in results that will limit immediate improvement for new home sales. But this report, especially the monthly gains for single-family data and the year-on-year gain for multi-unit permits, does point to the possibility that the housing sector, struggling to move higher as it has all year, may begin to contribute to economic growth.


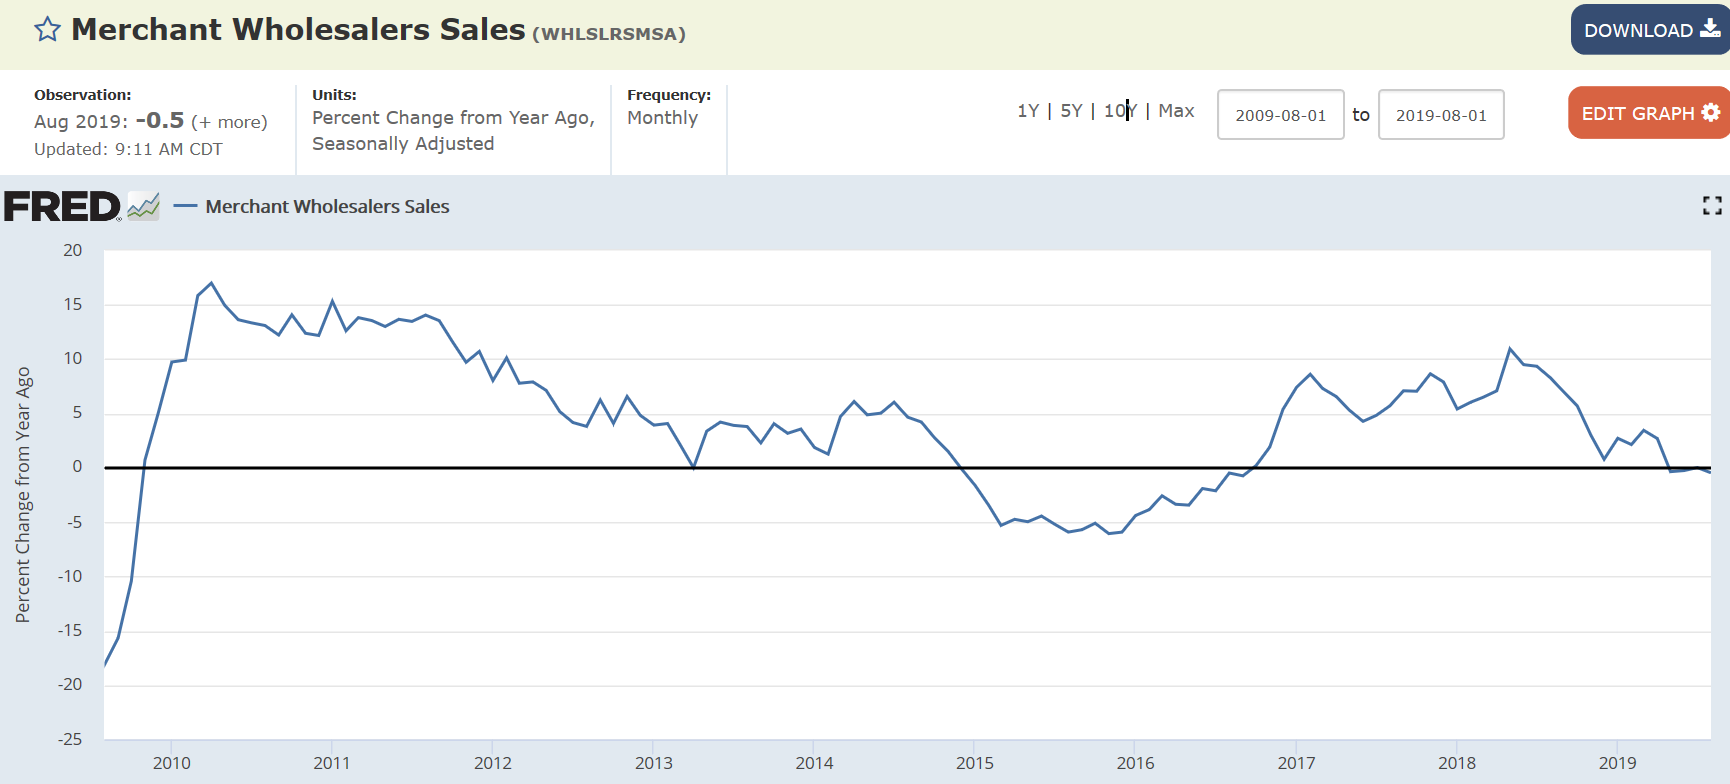
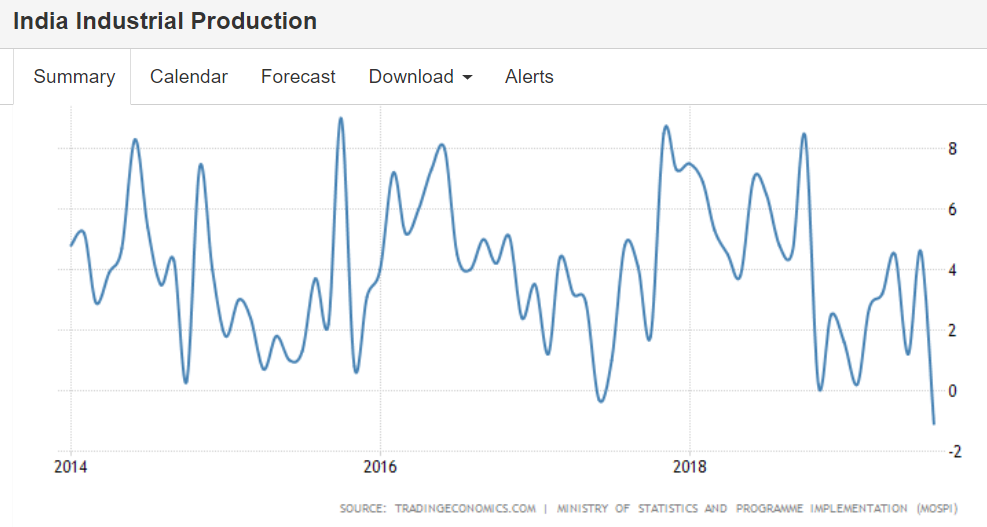
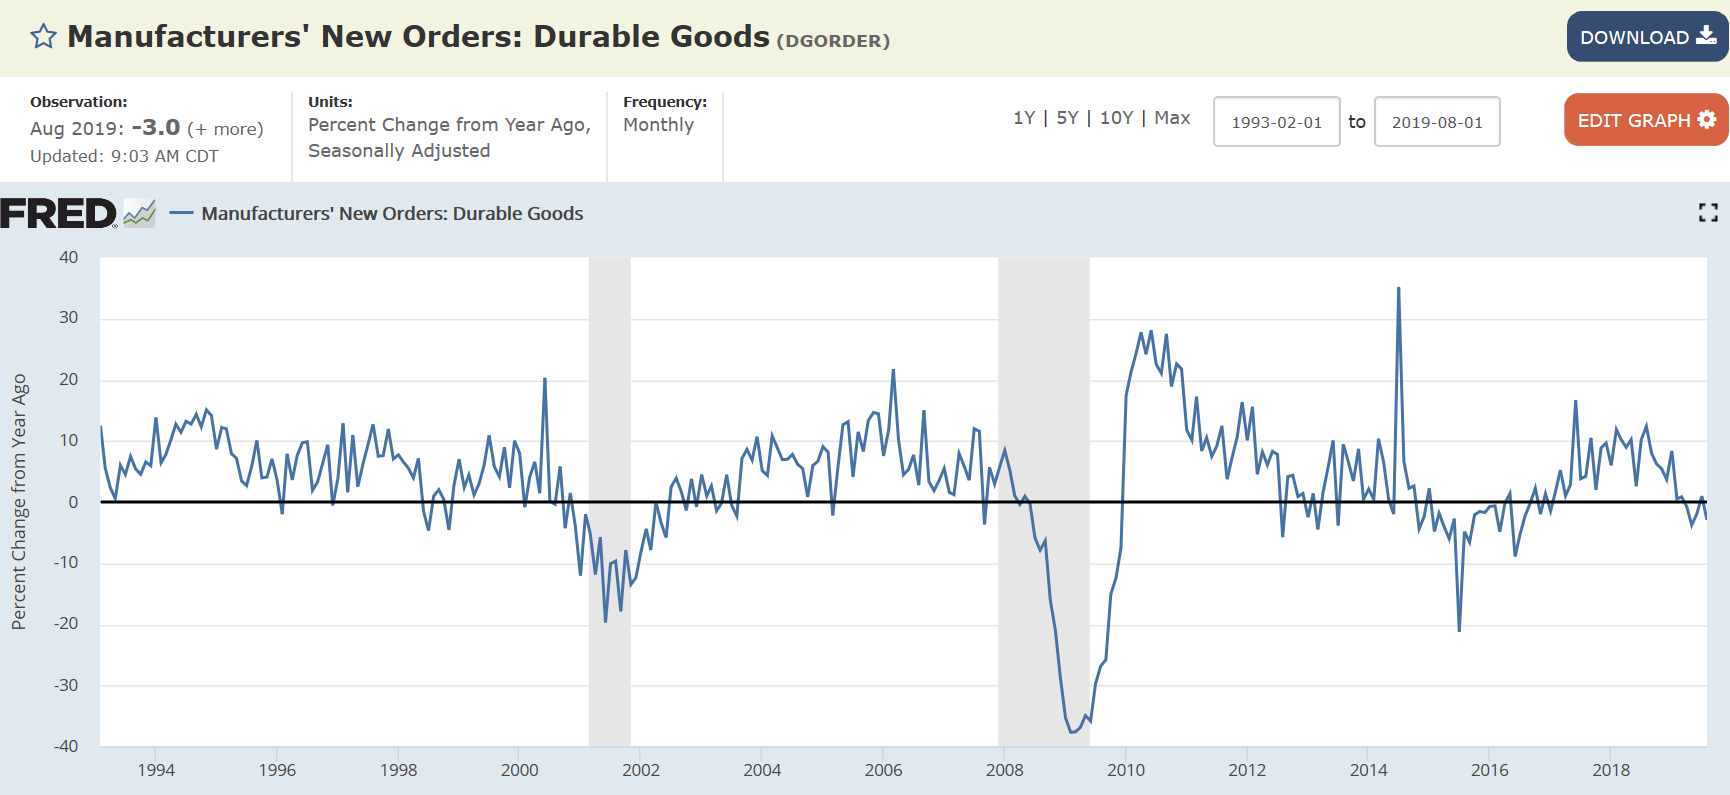
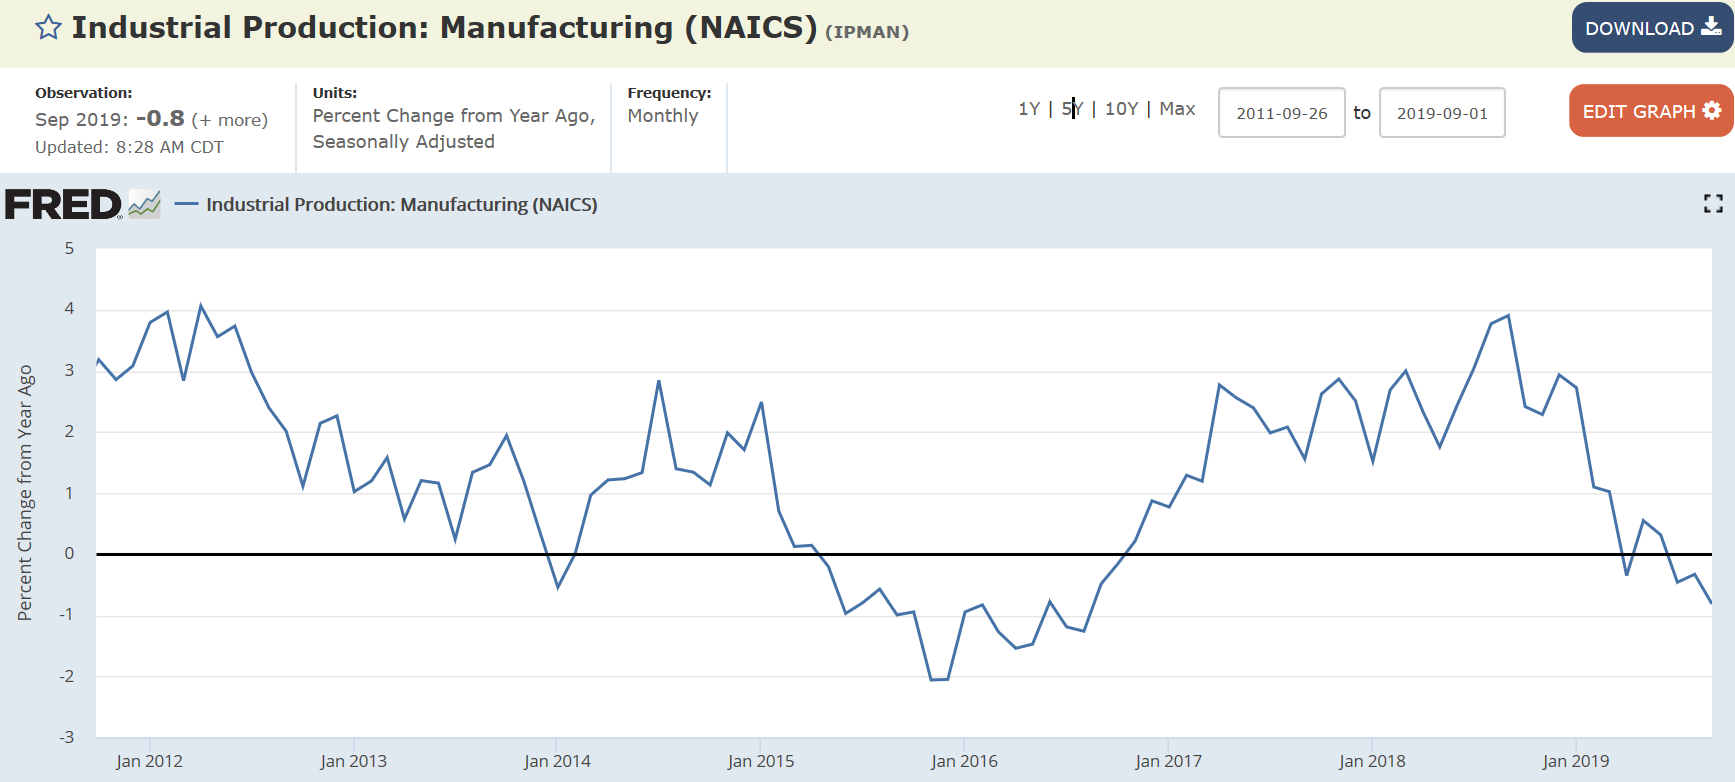
The global collapse continues:

Highlights

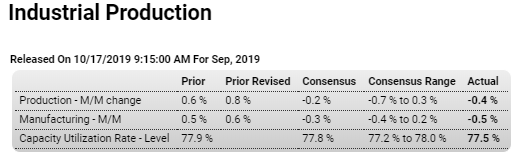
After a strong August, industrial production fell back more sharply than expected in September with year-on-year rates especially betraying the report’s generally weakening trends. Pulled down by manufacturing, industrial production fell a monthly 0.4 percent in September and double the expected contraction. Manufacturing volumes fell 0.5 percent, nearly double the expected decrease and reflecting wide declines across readings including a 4.2 percent monthly drop for motor vehicles, significantly reflecting the GM strike, and a 0.7 percent decline for business equipment.

The report’s two smaller components were mixed with utilities rising 1.4 percent in September but mining falling 1.3 percent. Mining had been enjoying two years of exceptional strength in this report but has since faded. Year-on-year, mining volumes are up a moderate 2.6 percent with utilities up 1.2 percent.

The trouble for manufacturing, which is being held down by weakening demand for US exports, is framed convincingly by 0.9 percent year-on-year contraction in this report. Vehicle production is down 5.4 percent on the year and improvement may be slow based not only the risk of an extended GM strike but also on yesterday’s retail sales report where vehicles sales were a major negative. Business equipment is another negative, down 0.8 percent on the year which won’t be giving the hawks at the FOMC much strength in their arguments to limit further rate cuts. Weakness in business equipment, the result of falling business expectations, is a central concern, if not the central concern, for monetary policy makers.

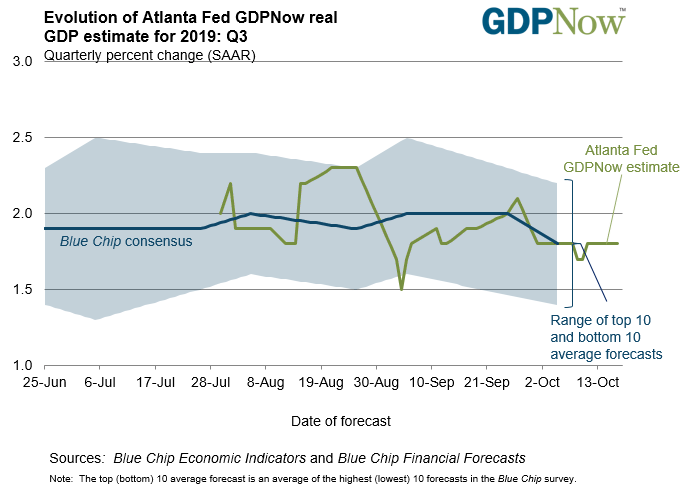
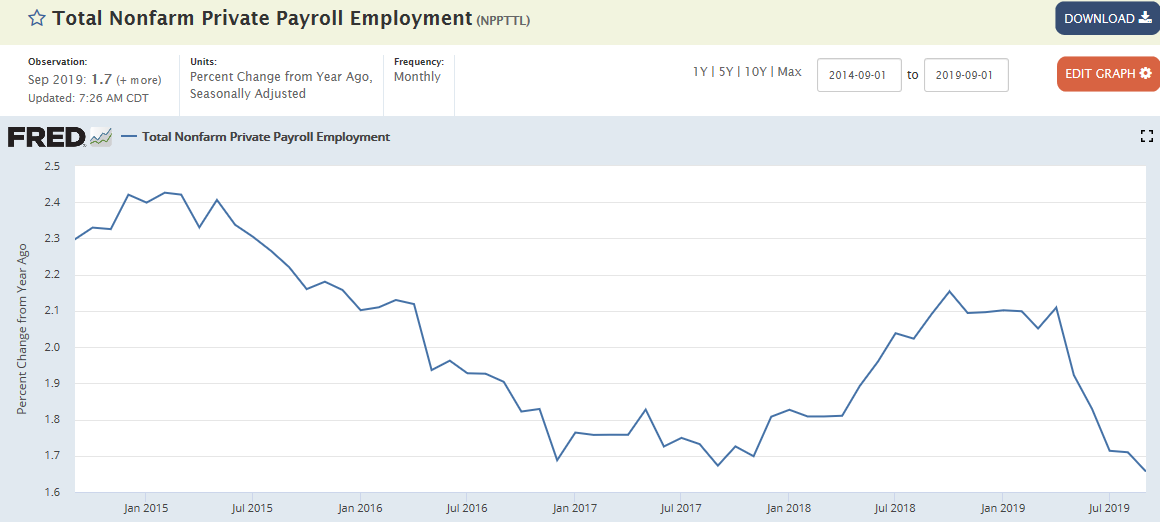
GDP continues to decelerate:

The economy probably only grew 1.5% in Q3 amid consumer weakness, CNBC tracker shows

Retail sales, Business inventories

Weak income and employment growth tends to coincide with weak retail sales growth, as the global trade collapse continues:

Highlights

The consumer cooled but not enough to not knock back a still rising trend for retail sales which in September fell an unexpected 0.3 percent. All the breakdowns also came in well below expectations including a 0.1 percent dip when autos (one of September’s weaknesses) are excluded and no change when also excluding gasoline.

Perhaps the best gauge to this report is the control group, which is part of the GDP mix and which came in flat. Limiting the unwelcome message from September is a revision to the upside for August, up an additional 2 tents to 0.6 percent, and also a look at the total year-on-year rate which did ease 3 tenths in September to 4.1 percent that, next to August’s 4.4 percent, is still the second best rate since October last year.

Auto sales (in contrast to a rise in previously reported unit sales) fell 0.9 percent though this does follow a 1.9 percent jump in August. Year-on-year growth for autos did slow, down 1.4 percentage points yet to a still favorable 5.6 percent. Gasoline sales, held down by low prices, once again pulled down total sales, falling 0.7 percent in the month after August’s 1.3 percent drop.

Nonstore retailers (dominated by e-commerce) are also in the negative column in September, down a monthly 0.3 percent though year-on-year growth continues to easily top all categories at 12.9 percent. Building materials fell 1.0 percent in September while general merchandise fell 0.3 percent. One of the positive showings is by apparel stores at 1.3 percent and furniture stores at 0.6 percent. Restaurants posted a 0.2 percent monthly gain for very respectable yearly growth of 4.9 percent that, like yearly growth in auto sales, underscores the fundamental strength of the consumer.

Today’s report will limit expectations for the third-quarter contribution from consumer spending, which nevertheless remains favorable and the central underpinning for economic growth. For the Federal Reserve, consumer slowing could make policy more vulnerable to the slowdown underway in global demand and the US manufacturing sector, and in turn strengthen the arguments of the doves who are pushing for more rate cuts.

Highlights

Businesses are holding back inventory growth as sales growth stalls. Total inventories were unchanged in August against only a 0.2 percent rise in sales, a modest mismatch that isn’t enough to move the inventories-to-sales ratio which held unchanged at a lean and favorable 1.40.

Inventories relative to sales look stable right across components with retailers showing the only change and that’s downward, with this ratio a bit more lean at 1.44 versus 1.45 in July.

When it comes to production and employment, nimble inventory management helps smooth out disruptions from economic ups and downs, yet however positive this may be for general economic health a slowing inventory build does hold down GDP growth.

Annual sales growth is negative:


Inventories remain elevated:

Bank loans, CEO confidence, India

Tariffs have caused a global economy (that has a pro cyclical bias) to turn south.

It’s always an unspent income story. When decisions to not spend income (decisions to ‘save’) are not sufficiently ‘offset’ by agents spending more than their incomes GDP (sales/income) decelerates until said deficit spending- private or public- expands to fill the gap.

JOLTS, Wholesale trade

Heading south:


Sales in contraction year over year and inventories again elevated:

Highlights

Wholesale inventories rose 0.2 percent in August which is down from an initial estimate of 0.4 percent posted late last month. Inventories in July rose 0.2 percent.

Sales at the wholesale level are subdued, unchanged in August to keep the stock-to-sales ratio in the sector unchanged at 1.36. For GDP, wholesale inventories in the first two months of the third quarter rose roughly in line with the second-quarter build which would be neutral for the inventory component of third-quarter GDP.

Small business, Japan, Rails

Highlights

Small business optimism continues to ease, down 1.3 points in September to a slightly lower-than-expected 101.8. No components rose in the month with six down and three unchanged. The report notes that uncertainty is up and respondents are more reluctant to make major spending commitments. Tariffs are cited by 30 percent of the sample as a negative for their business. Labor compensation continues to rise in contrast, however, to selling prices which are comparatively flat.

Global trade continuing to contract:

Japan’s current account surplus came in at JPY 2.16 trillion in August 2019, widening from last year’s JPY 1.82 trillion and above market expectations of JPY 2.07 trillion. The goods account switched to a JPY 0.05 trillion surplus from a JPY 0.26 trillion deficit, as imports fell to JPY 6.03 trillion from JPY 6.91 trillion, while exports fell to JPY 6.08 trillion from 6.65 trillion.

Deep in contraction:

Employment, Vehicle sales

Weakness continues and new tariffs kicking in will only make it worse:

Highlights

Is there slack in the labor market or isn’t there? Judging by September’s 3.5 percent unemployment rate, a rate that falls below Econoday’s consensus range, there may not be much available capacity at all. Yet wage pressures, as measured by average hourly earnings, eased significantly in September for a 2.9 percent year-on-year growth rate that is the lowest since July last year.

Payroll growth itself is running a notch or two below last year and is well under 200,000, but it is still very solid as well as steady and would look to further test the labor market’s available capacity. Nonfarm payrolls rose 136,000 in September with August revised sharply higher, up an additional 38,000 to 168,000. Yet manufacturing, the economy’s weak link right now due to slowing global trade, is showing weakness, down 2,000 in September versus expectations for a 3,000 gain. Over the last three months this sector has added only 4,000 payroll jobs, a detail that won’t miss the eye of Federal Reserve policy makers who are focused specifically, and with concern, on the health of this sector.


After the great oil capex collapse, the blip up from the tax cuts has been more than offset by the tariffs:


Down to the lows and then sideways:


Stalled out 3 years ago at levels from 20 years ago:

Employment, Vehicle sales, Consumer durables, NYC

Rapid deceleration:

BEA: September Vehicles Sales increased to 17.2 Million SAAR

“The job market has shown signs of a slowdown,” said Ahu Yildirmaz, vice president and co-head of the ADP Research Institute. “The average monthly job growth for the past three months is 145,000, down from 214,000 for the same time period last year.”

Negative year over year:

BEA: September Vehicles Sales increased to 17.2 Million SAAR

BEA released their estimate of September vehicle sales this morning. The BEA estimated sales of 17.19 million SAAR in September 2019 (Seasonally Adjusted Annual Rate), up 1.1% from the August sales rate, and down 0.7% from September 2019.

Sales in 2019 are averaging 16.96 million (average of seasonally adjusted rate), down 1.1% compared to the same period in 2018.

Manhattan real estate prices take the biggest tumble since the financial crisis

ISM Manufacturing, Construction, Trump Fed comments

The deceleration that’s been going on all year due to the tariffs seems to finally be getting some media attention after US manufacturing reports that it’s in contraction. Something like the 10th plague…

Highlights

Contraction in export orders is severe and is pulling composite activity for ISM manufacturing’s sample under water. September’s 47.8 headline is more than 1 point under Econoday’s consensus which is significant, since nearly all forecasters take a stab at this report. And bleeding at a troubled rate are new export orders which at 41.0 posted their the third straight month of contraction that echoes the very substantial contraction being suffered by the PMI manufacturing sample in Germany right now.

Total new orders in September’s report are at 47.3 and also well below break even 50 to indicate outright monthly contraction. Backlog orders at 45.1 have been in contraction for this sample since May, and evaporating backlogs are not a positive signal for employment which at 46.3 is under 50, and well under 50, for a second straight month and is pointing to trouble for factory payrolls in Friday’s employment report. Suffering from a downturn in new orders and a lack of backlogs to work down, production is also under 50 for a second straight month, at 47.3.

Other details include flat price pressures for inputs, contraction in inventories, and improvement in delivery times — all consistent with a sample that is sinking. This report is very closely watched, whether among policy makers or among US manufacturers themselves who frequently cite it in their own statements and forecasts. Slowing in global trade has hit this sample hard and confirms the concerns at the Federal Reserve which started its move to rate cuts in July citing the risk that slowing global demand would specifically hurt US manufacturers. Today’s report will build expectations for now that the Fed, despite its own internal divisions, is likely to cut rates at least one more time this year.


Rolled over and heading south. And adjusted for inflation still way below prior cycle peak:


The President has the interest rate thing backwards, of course, but so does the Fed, and pretty much everyone else, as markets anticipate more fed rate cuts in response to the weak economic data: