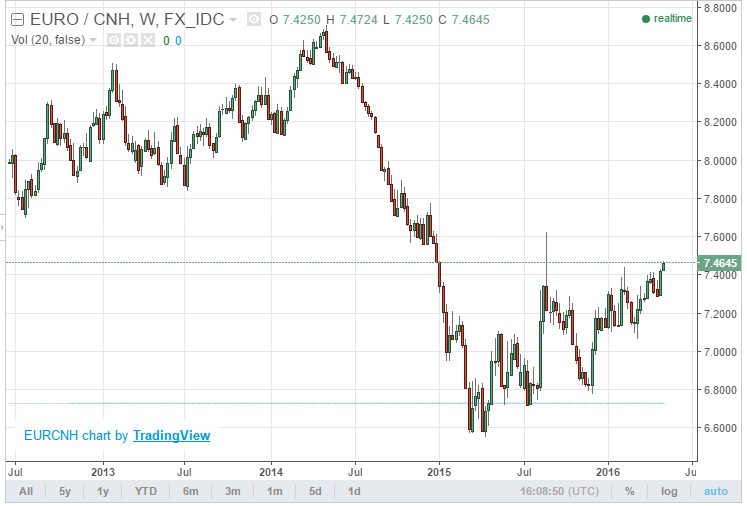
Good chance China is now rebuilding euro reserves sold when they panicked over negative rates, qe, etc. In fact, they could now be targeting the euro area for export growth:
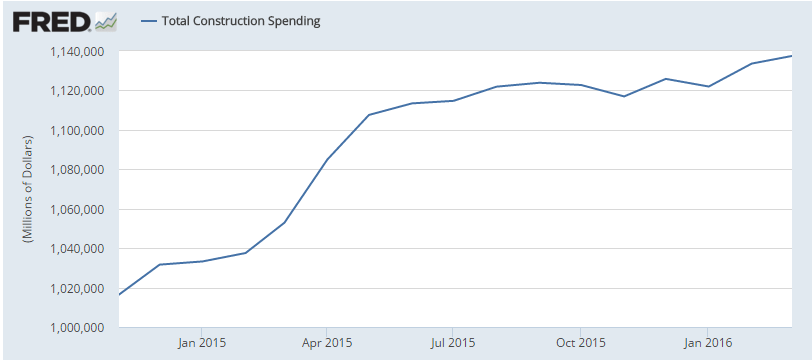
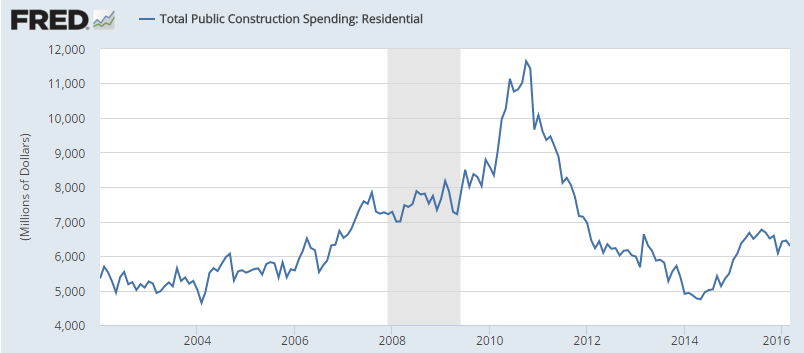
This came out this am. Note how construction flattened in the middle of last year when the NY tax incentives expired, and so far there is no sign of a repeat of last year’s growth for this year:
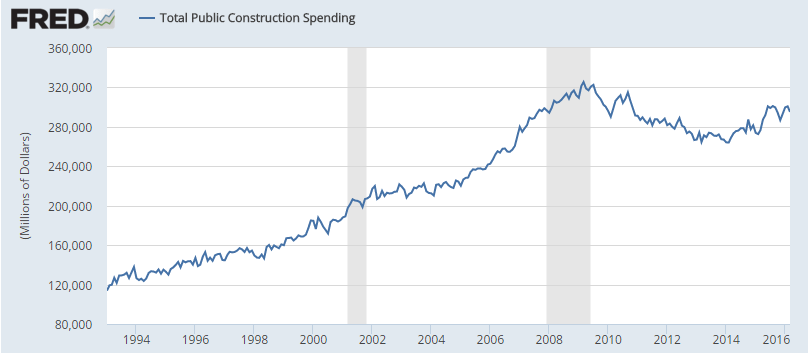
When it comes to downsizing govt, Obama looks to have been the best ever. What more could the Tea Party ask for?
Author Archives: WARREN MOSLER
ISM manufacturing, Construction spending, PMI manufacturing index
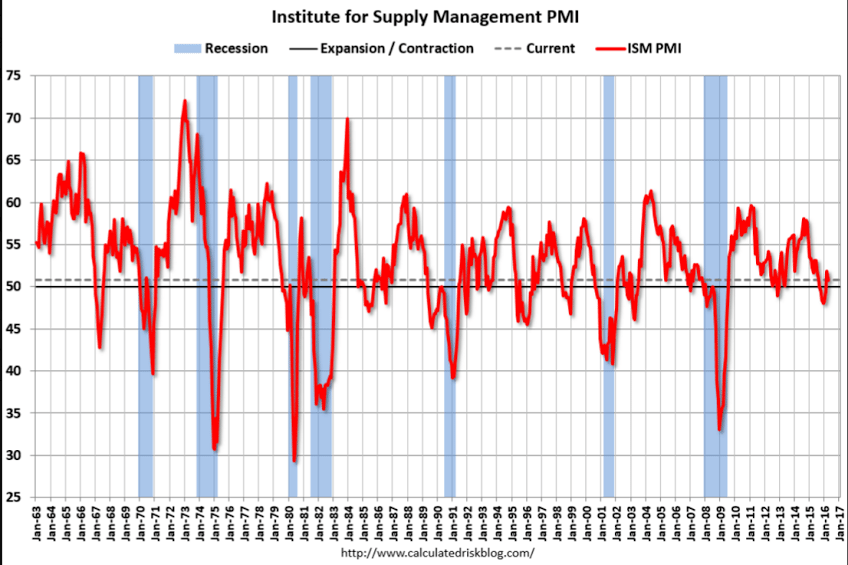
Another worse than expected report, and now it’s been over a year since it all started going bad, even as analysts continue to find reasons to be optimistic that have yet to pan out:
ISM Mfg Index
Highlights
April’s 50.8 for the ISM manufacturing index may be moderately below expectations for 51.5 but details in the report are positive. New orders did slow by 2.5 points but the level at 55.8 still points to a very solid rate of growth. New export orders, offering positive evidence on the effects of the lower dollar, are also positive, unchanged at 52.5 which isn’t dramatically above breakeven 50 but is still very solid for this reading and the best since December 2014. Production did slow 9 tenths but at 54.2 is also more than respectable. Backlog orders are still rising, though just barely at 50.5, but this along with March’s 51.0 are the best two months for this reading also since December 2014.
Now the weaknesses in the report, led by employment which did rise 1.1 points but is still below 50 at 49.2. Supplier deliveries, down 1.1 points at 49.1, pulled the composite index lower in the month and likely reflect lack of inventories at suppliers. And ISM’s sample continues to be very defensive regarding inventories with both raw materials and finished goods in accelerating contraction. Prices paid, at 59.0 for a sharp 7.5 point gain, reflects higher oil-related costs. There are no indications in this report on selling prices but other readings, including from this morning’s April PMI, have been negative.
But there’s reasons for optimism in this report centered entirely where it must be — in orders.

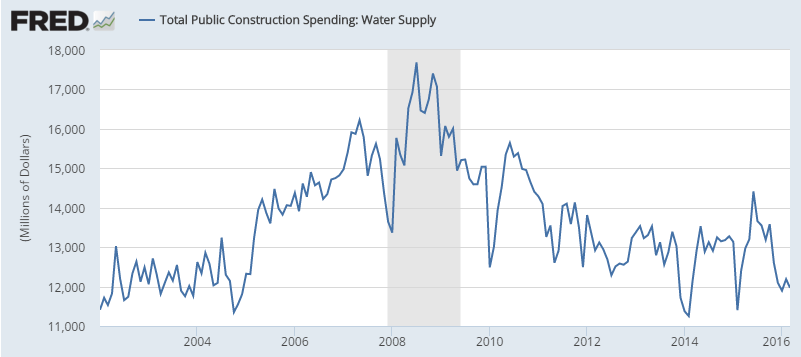
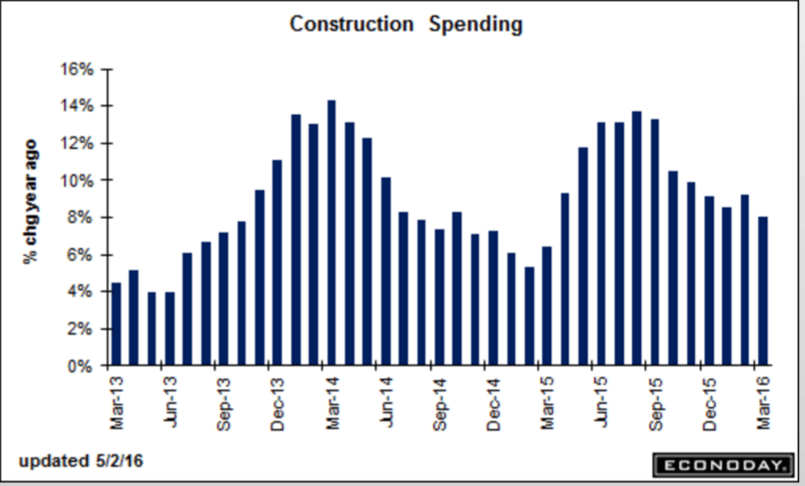
As per the chart, the year over year growth rate continues to decline, meaning this year’s construction activity won’t be adding as much to growth as last year’s did:
Construction Spending
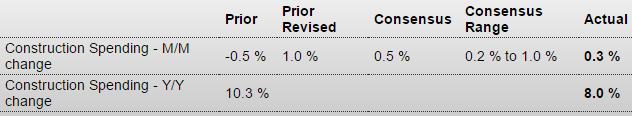
Highlights
Home sales may be puttering along but construction spending nevertheless remains one of the strongest reports on the calendar. Construction spending did inch 0.3 percent higher in March, which is lower than expected, but February is now revised sharply higher, from a 0.5 percent decline to a 1.0 percent gain. Gains for March and February are positives for near-term momentum though they are offset by a sharp downward revision in January to minus 0.3 percent from plus 2.1 percent.
Back to March, residential spending rose 1.6 percent driven by gains for multi-family homes with single-family homes flat. The latter is a disappointment but does follow a trend of steady strength in prior reports.
Non-residential spending rose 0.7 percent in March led by transportation and including a respectable gain for manufacturing, one that may hint at better results for capital spending. Public spending on educational building and on highways is also up though Federal spending remains weak and state & local spending, which has been strong, fell in the month.
Year-on-year, total construction spending is up 8.0 percent, which includes a 7.8 percent gain on the residential side and a 9.3 percent gain on the non-residential side. These are down from 10 percent rates in prior reports but are still very hard to match anywhere else in the economy.
Also below expectations and not good:
PMI Manufacturing Index
Highlights
The manufacturing sector has started out the second quarter completely flat, based at least on the April PMI which fell 7 tenths to 50.8. New orders did rise modestly in the month but that’s the only good news in the report. Export orders, contracting at the fastest pace in more than a year, are not showing any lift yet from the lower dollar. And higher oil prices are not helping capital spending in the energy sector which remains a major negative for the sample. Output is flat, backlog orders are in contraction for a third straight month, and employment has completely stalled. And manufacturers continue to work down inventories as much as possible. Prices for raw materials, reflecting higher costs for oil-related products, did rise but not selling prices which are decreasing further. This report isn’t closely watched but the ISM manufacturing report is, and similar results for ISM, which will be posted at 10:00 a.m. ET, could shake the U.S. outlook and perhaps global markets with it.
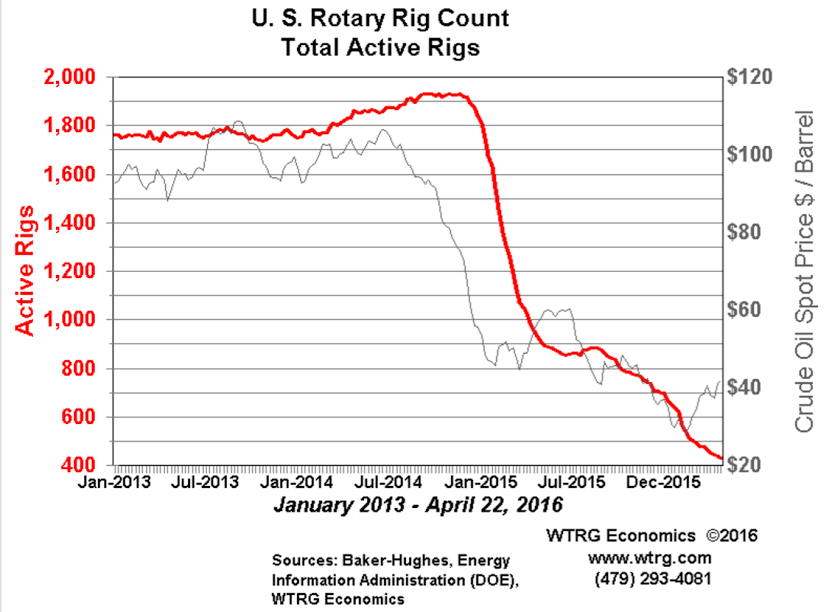
Saudi production, GDP comment, rig count
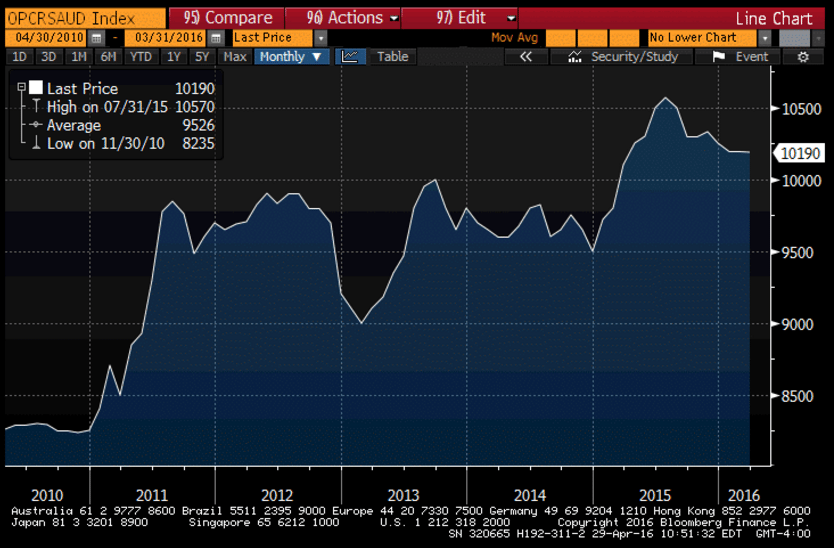
Saudi production remains well below their claimed 12 million bpd current max capacity, as they continue to set price and let sales and output float.
Market action suggest they have altered their posted prices, but so far publicly available information doesn’t indicate a change in pricing policy. If so, the latest move up in prices will prove temporary:
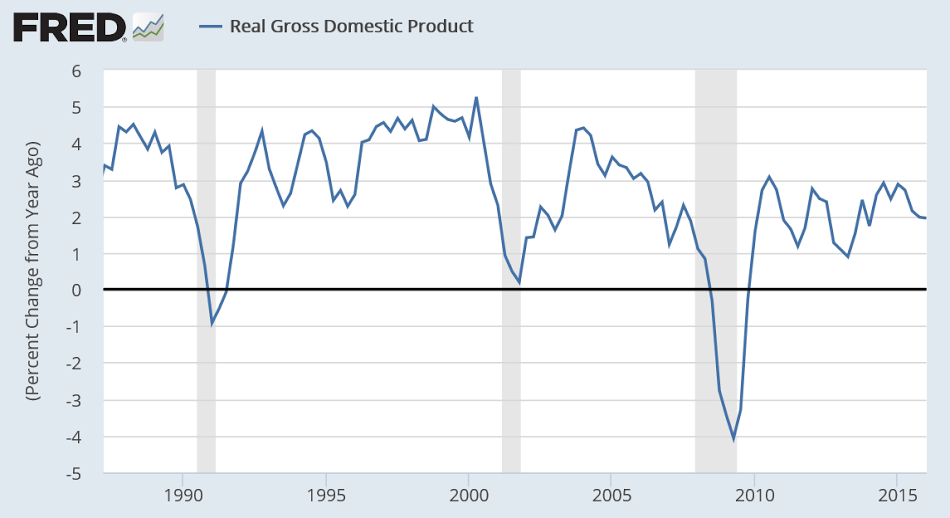
The American Consumer is Doing Less to Support GDP Growth
By Rick Davis
Summary and Commentary
Although the headline remained positive, this is not a report that shows a robust economy. Among the troubling aspects of the report:
The growth rate for consumer spending took another significant hit, dropping substantially for the third consecutive quarter. In fact, the growth rate for consumer spending on goods was barely positive, at a miserable +0.03%. And non-discretionary spending on health care and housing provided most of the remaining growth in consumer services spending.Private investment contracted for the first time since the first quarter of 2011.Exports went deeper into the red.
Looking at the past three quarters as a group, we can see a slow-motion slide into either stagnation or contraction. It is truly sad when stagnation looks to be the better alternative.
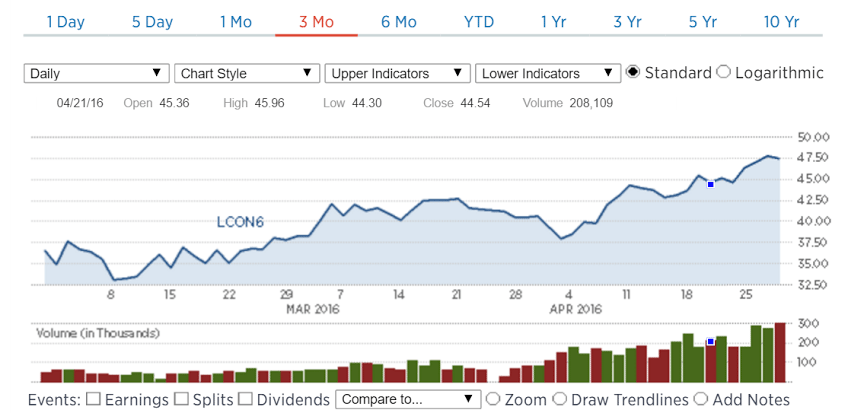
This continues to fall. Production is already declining and this means more of same, which means oil imports will continue to rise, adding to the US trade deficit and increasing that fundamental source of dollar weakness. And while the higher prices add to the cost of imported oil, the prices aren’t high enough for additional capital expenditures. So you might say we’re in the ‘sour spot’ where the higher price is a negative for GDP until it gets high enough for capex to increase. But with the Saudis still firmly in control of price doesn’t seem to me that’s likely to happen?
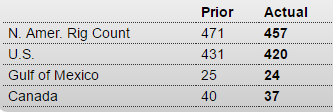
Baker-Hughes Rig Count
Highlights
The Baker Hughes North American rig count is down 14 in the April 29th week to 457. The U.S. rig count is down 11 at 420 and is down 485 rigs from last year. The Canadian rig count is down 3 rigs from last week to 37 and, compared to last year, is down 42 rigs.
GDP, KC Fed
Weak, a bit below expectations, and not much hope left for Q2 either.
And some time last year the govt changed the seasonal adjustments, adding a bit to Q1 and taking some away from the other quarters. So this release included that new seasonal adjustment:
GDP
Highlights
Consumer spending, largely on services, helped hold up first-quarter real GDP which came in at an annualized plus 0.5 percent rate and just below the Econoday consensus for 0.7 percent. Consumer spending (personal consumption expenditures) rose at a 1.9 percent rate, down only 5 tenths from the fourth quarter. Within this, spending on services rose an in-trend 2.7 percent to offset a 1.6 percent decline in durable goods which were hit by weak vehicle sales.
Residential investment, up 14.8 percent, is a highlight of the report and helped offset a sharp 5.9 percent decline in nonresidential investment where weak energy drilling is taking a big toll. Inventories rose in the quarter but at a slower rate which is a negative for GDP while exports, reflecting weak global demand, were a negative for a second quarter in a row. Government purchases were a small plus in the quarter.
Price data are mixed with the price index up only 0.7 percent in the quarter, down 2 tenths from the fourth quarter. But the core deflator is up, 7 tenths higher to plus 1.9 percent which should get some attention.
The consumer bailed out the first quarter, both on services and also on fixing on their homes. But otherwise the report points to nearly no momentum going into the Spring quarter.
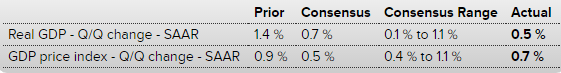
US GDP Growth Slows to 0.5% in Q1
The US economy expanded an annualized 0.5% percent on quarter in Q1, according to the advanced estimate released by the Bureau of Economic Analysis. It is the weakest performance since Q1 2014 as consumer spending slowed, the drag from trade and business inventories worsened and business investment fell for the third straight quarter.
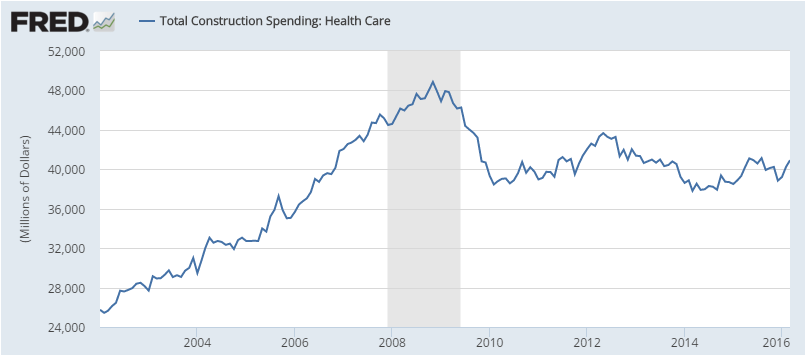
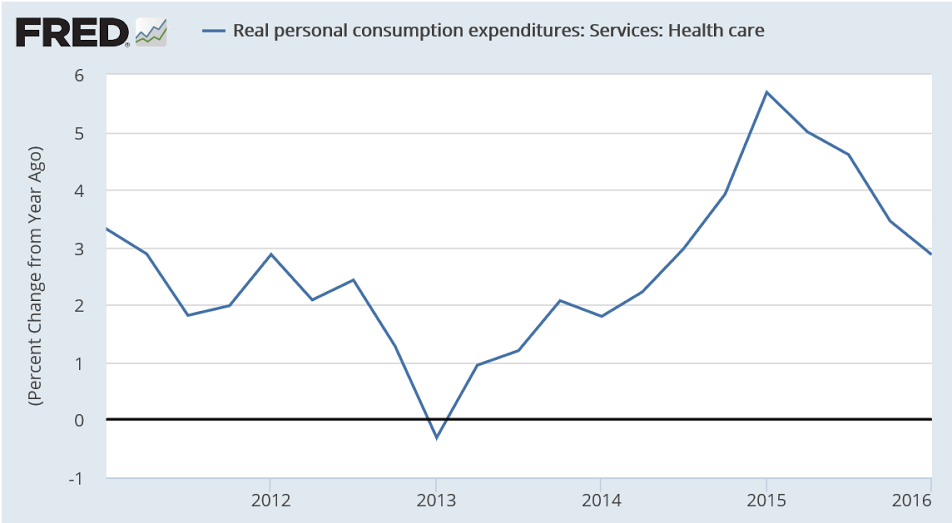
As previously discussed, health care premium count as personal consumption expenditures and GDP, so last year they spiked due to new people being covered by Obamacare, thereby supporting GDP by that much. But that was a one time event and so now consumption, so measured, is softening to where it probably has been all along:
Still negative:
Kansas City Fed Manufacturing Index
Highlights
Oil prices may be higher but steady contraction is the long uninterrupted theme of the Kansas City Fed manufacturing sector where the composite index came in at minus 4 for April. Contraction in new orders is only marginal, at minus 2 for a second straight month, but contraction for backlog orders, at minus 18, remains severe. Employment is also in deep contraction, at minus 12. Output indicators are also weak, at minus 8 for production and minus 9 for the workweek. Selling prices remain in contraction, at minus 6, but raw material prices, at 4, are back in the plus column and reflect the turn around for oil prices. But higher oil prices have yet to give this report much boost where weakness in energy equipment has been a long fixture. Weakness in export orders, at minus 4, has been another fixture.
Mtg purchase apps, Pending home sales, Bank liquidity, Apple
Continues at depressed levels:
MBA Mortgage Applications
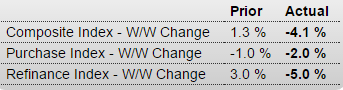
Highlights
Purchase applications are not pointing to Spring acceleration for the housing sector, down 2.0 percent from the April 22 week with the year-on-year rate continuing to come down, to 14 percent from 17 percent. This rate was as high as 30 percent as recently as March. Refinancing activity also declined, down 5.0 percent in the week. Rates remain very low with the average 30-year mortgage for conforming loans ($417,000 or less) at 3.85 percent for a 2 basis point rise in the week.
About as expected but total activity continued to slow:
International Trade in Goods
Highlights
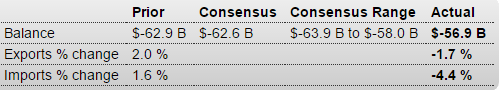
Trade activity slowed sharply in March though the deficit narrowed, down a sharp 9.5 percent to $56.9 billion vs February’s $62.9 billion. Exports fell 1.7 percent to $116.7 billion with consumer goods showing a steep decline together with wide declines for industrial supplies, autos, and foods. A positive, however, is a 1.5 percent uptick in capital goods exports, one that follows a smaller gain in February and hints at resiliency for global business investment. But the import side of the report points at declining domestic demand with consumer goods down a very steep 9.1 percent. Capital goods are also weak, down 3.6 percent. Cross-border activity has been a major negative for the global economy and March’s goods data point to continuing trouble though they will, however, give a lift to first-quarter GDP. This report represents the goods portion of the monthly international trade report which will be posted next Wednesday.
No sign here of housing leading the GDP charge this year:
Pending Home Sales Index
Highlights
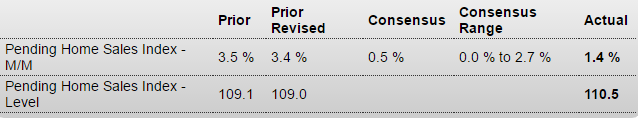
Growth in the housing sector this year has been mostly soft though today’s pending home sales report does hint at greater strength ahead. The pending home sales index, which tracks contract signing for existing home sales, rose a higher-than-expected 1.4 percent in the March report. Yet the year-on-year rate is showing very little improvement, also at plus 1.4 percent.
Pending home sales surged in the Midwest during February but slowed to only plus 0.2 percent in March. Strength in the latest report is centered in the Northeast and also the South, up 3.2 and 3.0 percent respectively. Year-on-year, the Northeast, which is the smallest region for housing sales, is up 18.4 percent with the Midwest up 4.0 percent.
Existing home sales did show life in March as indicated by this report’s February data with today’s data pointing to further improvement. Still, sales data show little momentum going into the Spring selling season.
This is ridiculous and shows no understanding of banking with floating fx. The way I like to put it is ‘the liability side of banking is not the place for market discipline’. Public purpose is best served by the CB supplying unlimited liquidity at the policy rate, and regulating and supervising the asset side:
U.S. proposes rule to shrink big banks’ liquidity risk
(Reuters) The top U.S. banking regulator on Tuesday released its proposal for establishing a Net Stable Funding Ratio. The ratio is intended to ensure liquidity over a one-year horizon, compared with the liquidity coverage ratio of 2014 requiring banks to hold high-quality assets that could be readily converted into cash within 30 days. The ratio will “discourage reliance on more volatile short-term funding,” the FDIC said in its proposal. The proposal is in line with the international Basel standard set in 2015, according to the FDIC. It differs primarily by providing a narrower definition of a “high-quality liquid asset” and a way to address “trapped liquidity.”
GDP=total final sales, so if Apple sales fall $10 billion for a quarter that’s about .2% of GDP (annualized)?
Apple quarterly earnings, revenue miss Wall Street target
(Reuters) Apple said it was raising its capital return program by $50 billion through a $35 billion increase in its share buyback authorization and a 10 percent rise in the quarterly dividend. Apple said it sold 51.2 million iPhones in its second fiscal quarter, down from 61.2 million in the same quarter a year ago. Earnings of $1.90 per share. Revenue of $50.56 billion. Apple forecast third-quarter revenue of $41 billion to $43 billion, short of the Wall Street consensus of $47.3 billion.
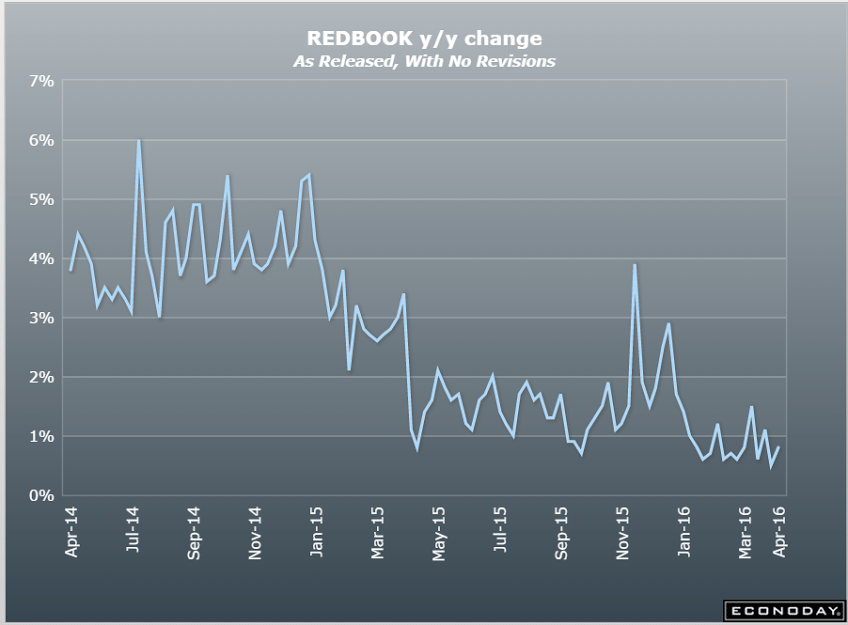
Durable goods orders, Redbook retail sales
Not good.
Note the year over year change.
And inventories remain way high:
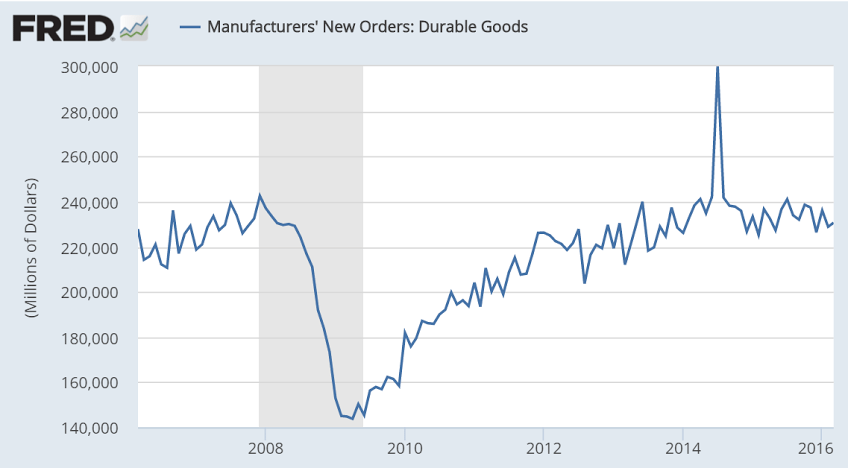
Durable Goods Orders
Highlights
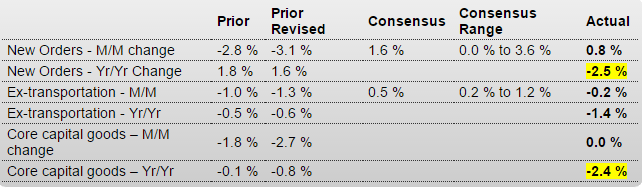
The factory sector posted a respectable March with orders for durable goods up 0.8 percent which follows a revised downswing of 3.1 percent in February and a very solid 4.3 percent gain in January. March reflects a big gain for defense goods which helped offset a downward swing for commercial aircraft. A negative in the report is a 3.0 percent decline for motor vehicle orders reflecting weakness at the retail level.
Data on core capital goods orders are uninspiring, unchanged for new orders in March to extend a soft trend. Shipments for this series, which are inputs into GDP, inched 0.3 percent higher but follow outright declines in the first two months of the quarter.
Shipments in March fell 0.5 percent and unfilled orders fell 0.1 percent. Manufacturers are carefully watching inventories for unwanted builds keeping inventories flat in the month and the inventory-to-shipments ratio unchanged at 1.66.
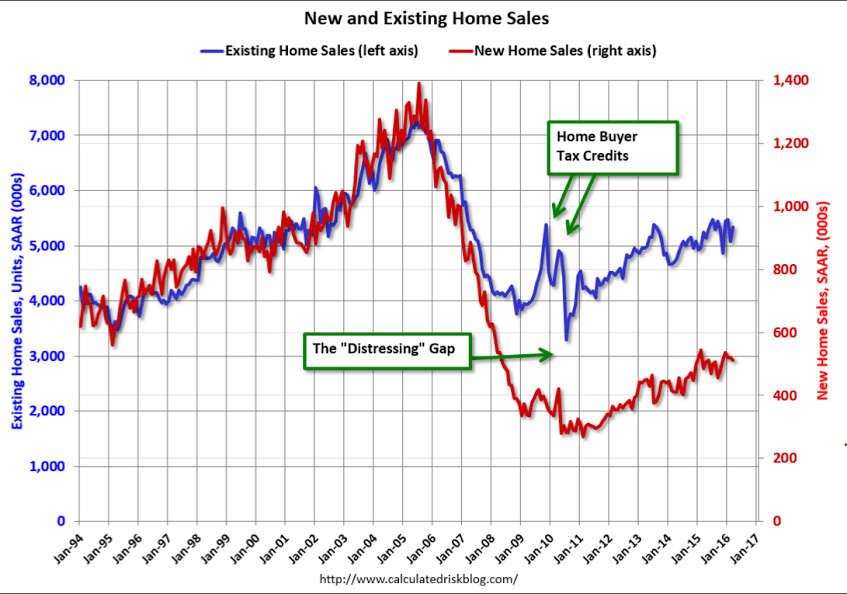
New home sales, Dallas Fed
Still weak and worse than expected.
And prices weakening as well:
New Home Sales
Highlights
Growth in new homes isn’t spectacular but, given how soft general economic conditions are, the sector is posting moderate and still respectable numbers. March sales came in at a 511,000 annualized rate which is on the low side of expectations but the report includes a 7,000 upward revision to 519,000 for February which now stands as among the very best months since 2008. Year-on-year, sales are up 5.4 percent, right in line with permits which are up 4.6 percent.Lack of new homes on the market, which has been holding down sales, improved a bit in April, to 246,000 units for a 2.1 percent monthly gain. And sales relative to supply is also improving, to 5.8 months vs 5.6 months in February and 5.1 months a year ago. Supply at 6.0 months relative to sales is generally considered to be consistent with a balanced market.
New homes aren’t showing much price traction, down 3.2 percent in the month to a median $288,000 which is down, not up, 1.8 percent from last year.

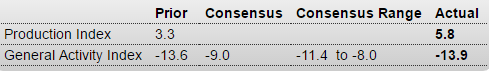
Still negative and worse than expected:
Dallas Fed Mfg Survey
Highlights
The decent of the Dallas Fed report may be flattening out, hopefully. The production index posted its second straight positive reading, at 5.8 in April vs 3.3 in March, but the really good news is new orders which popped into the plus column, to 6.2 following four straight declines. Capacity utilization is another plus, up for a second month.
Still, the overall assessment is negative, at minus 13.9 for the general activity index which is a 16th straight negative score, a run that can be traced back directly to the collapse in oil prices. Employment remains weak, at minus 3.7 for a fourth straight contraction. Price data do show some life with wages up and raw materials, which had been week, also up. Selling prices, however, remain a big negative, at minus 6.6 for what is also a 16th straight month in the wrong column.
Bank lending, quick macro recap
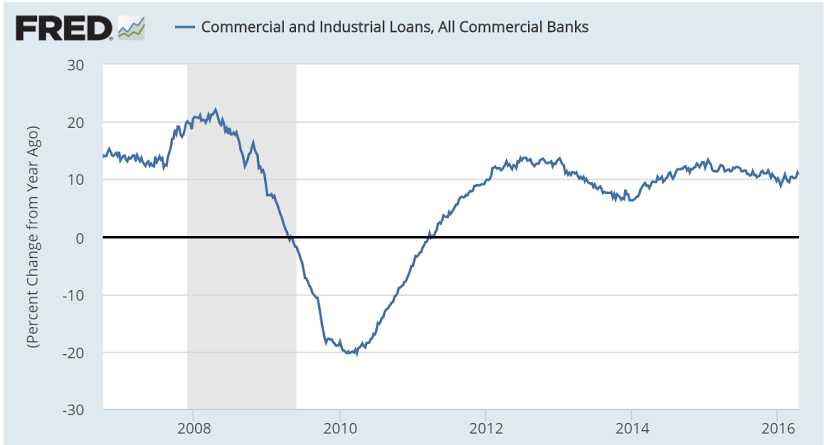
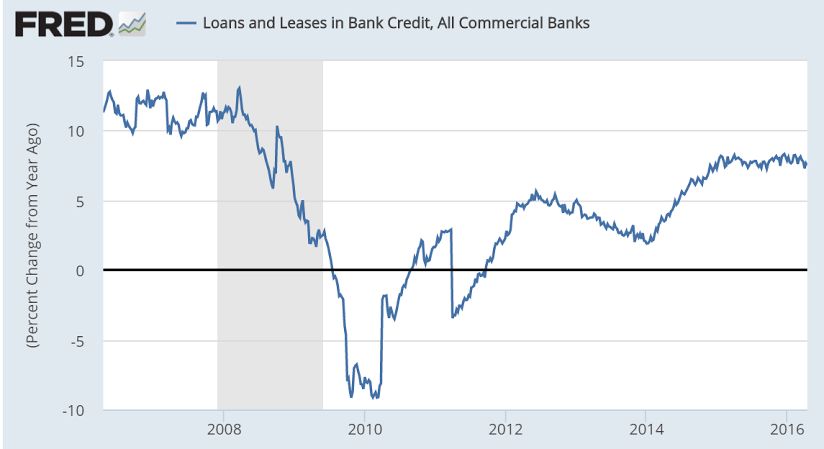
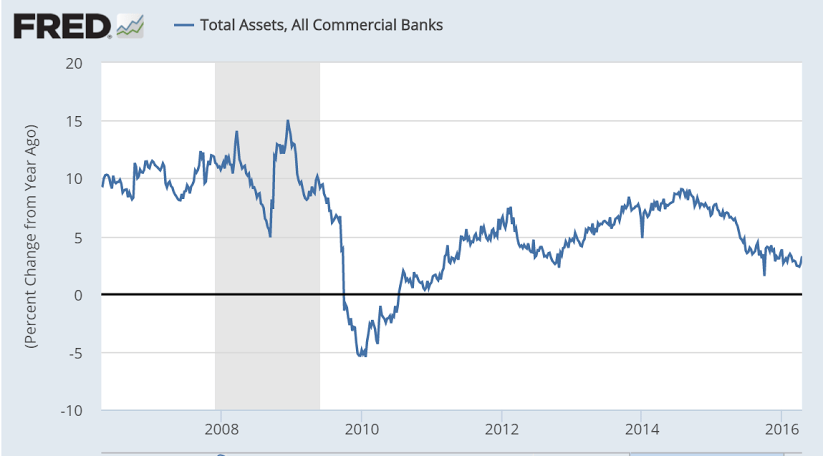
Loan growth remains uninteresting:
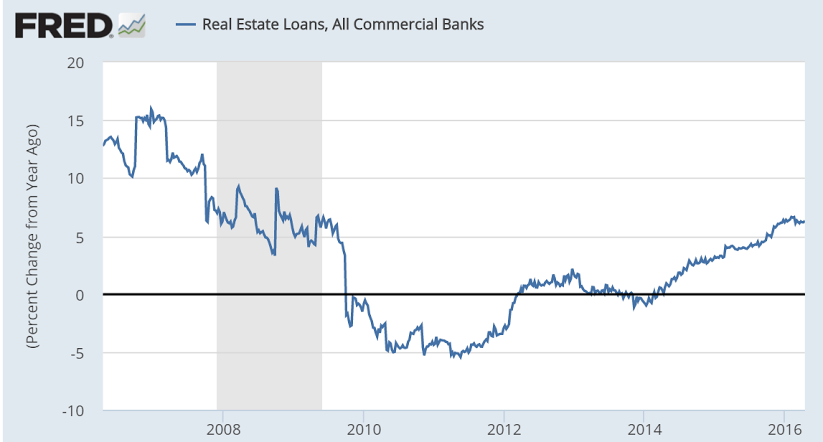
And now real estate loan growth, which wasn’t much to begin with, is showing signs of leveling off:
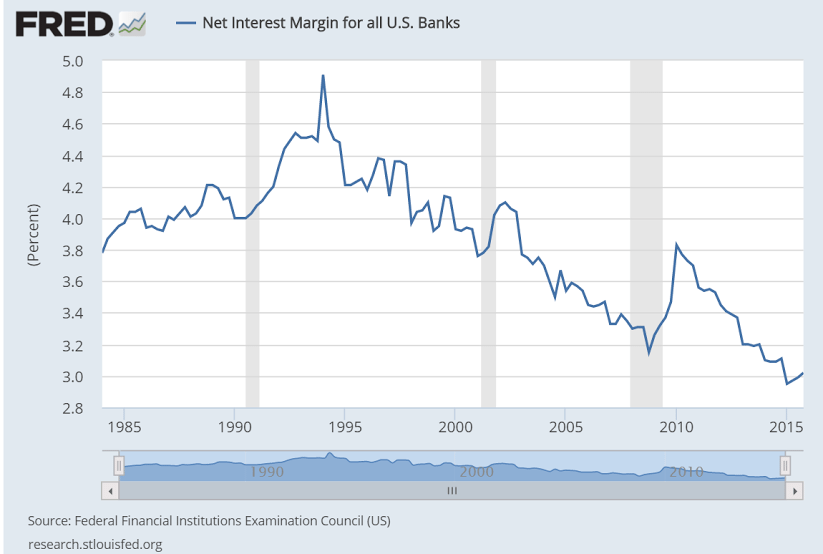
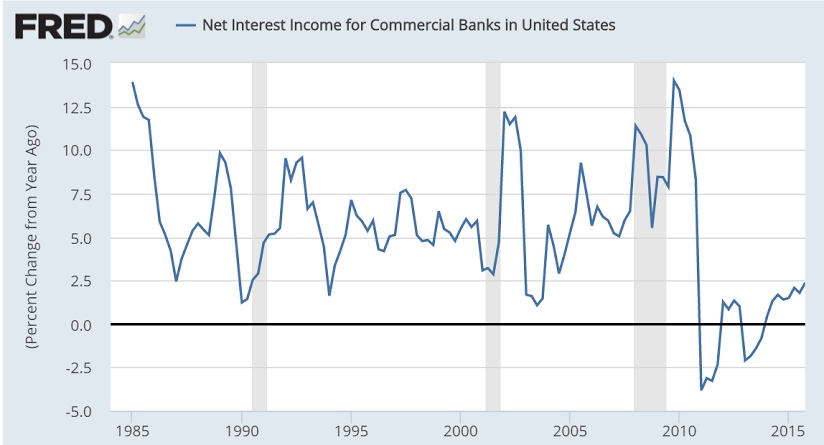
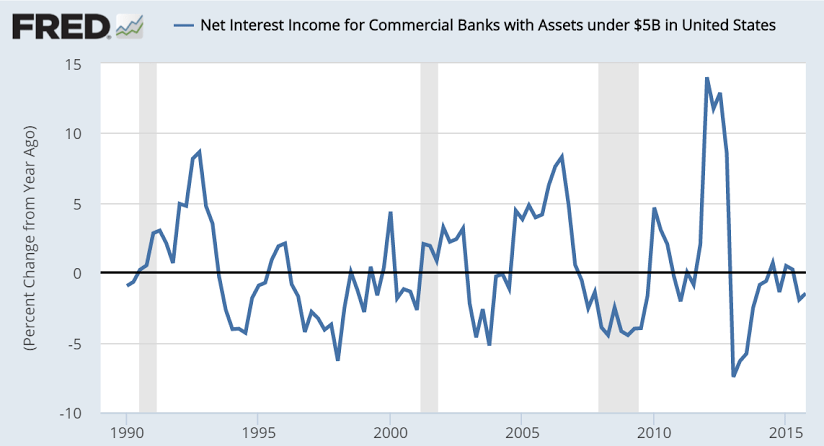
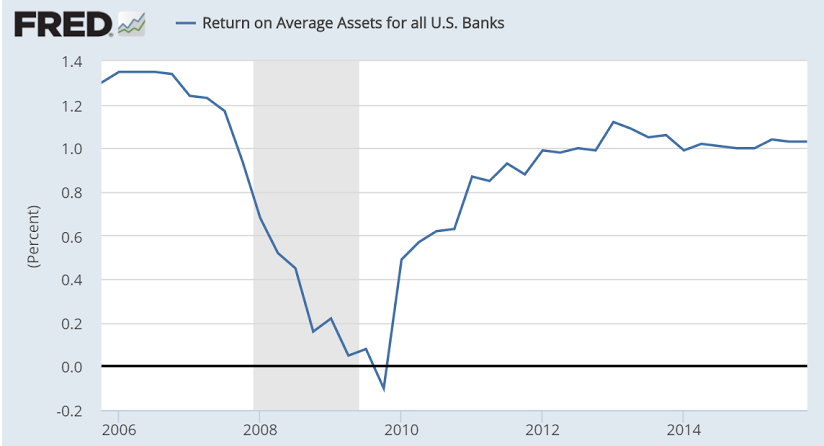
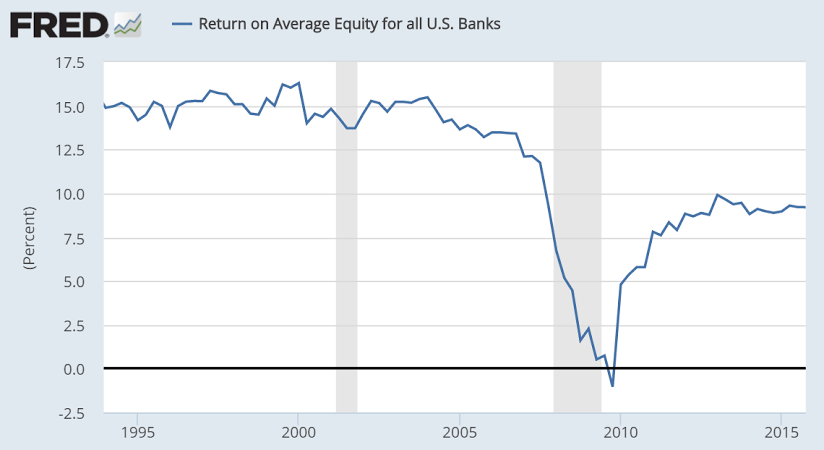
In case you thought today’s macro policies were some kind of gift to banks:
Again, wouldn’t surprise me if revisions in coming years show the US has been in recession since not long after oil prices got low enough for capex to collapse.
And it’s an old fashioned ‘under consumption theory’ slowdown- any agent that spent less than his income needed to be ‘offset’ by another who spent more than his income, or the output wouldn’t have been sold, etc. Unsold output = rising inventories = cutbacks output = reduced income = reduced sales = reduced income = reduced sales = pro cyclical downward spiral, etc. as income reductions in one sector ‘spread’ to cuts into reduced sales in the rest.
And it reverses only after deficit spending- public or private- gets large enough to offset desires to ‘save’/not spend income.
And it’s happening globally, with maybe some signs of some expansionary fiscal policy in China. But the general policy responses, including those of China, are focused on promoting exports/competitiveness, further promoting a global deflationary 0 sum game race to the bottom, with total trade winding down as well, all from a global lack of aggregate demand. And all as evidenced by massive excess capacity, particularly with regard to labor (UNEMPLOYMENT!).
Yes, there are rumblings of a fiscal response, which could in fact immediately restore global demand, but it’s just talk at the moment, with all the ‘action’ coming from monetary policy, which, unfortunately, the CB’s have backwards. They think they are stepping on the gas pedal, when in fact they are stepping on the brake pedal. And when it doesn’t work, they just step on it that much harder. And after 2 decades of supporting data that shows it doesn’t work, they all say they just need a little more time… :(
The Fed’s in a bit of a different position. Rightly or wrongly- it pretty much doesn’t matter if they are right or wrong- they believe the US economy is doing well enough to start tapping the brakes, as they did with their first rate increase. As previously discussed, that in fact adds a bit to aggregate demand via increased federal spending on interest, but so far the rate hike has been tiny and hasn’t been enough to move the demand needle. And if US GDP continues it’s deceleration and the Fed continues to fail to meet its inflation targets, it’s not impossible for them to reverse course and start lowering rates.
Meanwhile, the charts of the real US economy continue to fall/decelerate with most all pointing south, apart from new claims for unemployment which I believe is due to said claims having been made very hard to get, and not labor market conditions. And unemployment looks low only if you believe the drop in the labor participation rates are largely structural (all the women suddenly got too old to work in 2008…) which I find highly doubtful.
Nor do I see any signs of private sector deficit spending stepping up to the plate to replace lost capex spending, which, by the time it collapsed, was all that was left to support GDP growth.
And note that oil related spending cuts are still in progress. Firms are still cutting capex and US states as well as foreign oil producers are just this year cutting back spending due to reduced energy revenues. And all with no ‘offsets’ from other agents increasing their spending. And it all finally got to corporate top line growth and earnings, which have gone negative.
That all means we have to wait for federal deficit spending to increase which could be a long, ugly process.
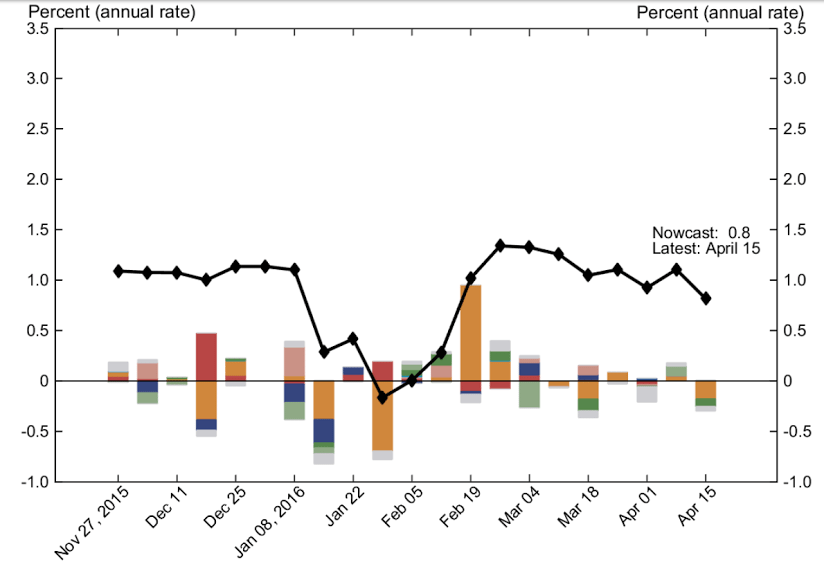
NY Fed Nowcast report:
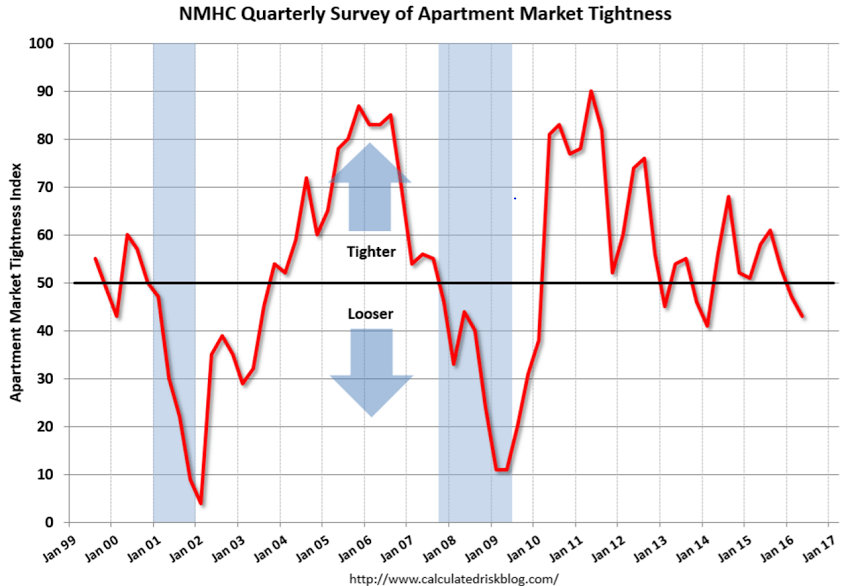
PMI Manufacturing, apt market, ISIS cash
More bad stuff:
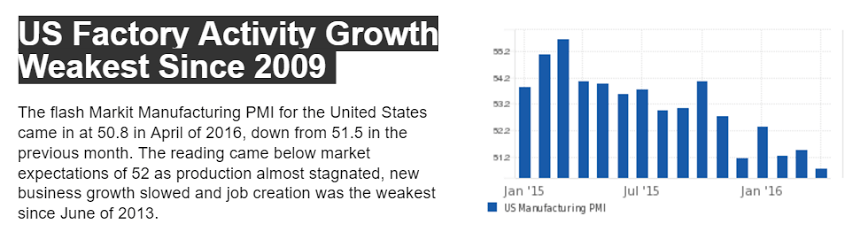
PMI Manufacturing Index Flash
Highlights
Early indications on April factory conditions are no better than mixed with strength in the Empire State report offset by yesterday’s flat readings from the Philly Fed and another set of flat readings from today’s PMI flash. The PMI, at 50.8, is still over 50 to indicate monthly growth but is the least above 50 since the beginning of the recovery, in September 2009. Growth in both output and hiring is slowing as is growth in new orders which are being pulled back by contraction in export orders. The report also cites weakness in the energy sector as a continuing negative.
Backlog orders are down, which is a negative for hiring and also points to operating slack. Manufacturers are keeping their inventories down with stocks of purchases dropping sharply. Delivery times are up, not the result of congestion in the supply chain but, the report says, of insufficient stocks and capacity cuts among suppliers. Prices, reflecting oil, are up slightly for the first increase in 7 months.
The report, in a first of sorts compared to other reports, cites the nation’s “political climate” and its relation to the economic outlook as a possible negative. Politics aside, it may still be too soon for the factory sector to see the benefits of this year’s depreciation in the dollar and upturn for oil. One of next week’s calendar highlights will be durable goods orders for March.
Not so good here either:
Another deflationary bias:
US-led coalition incinerated $500M of ISIS cash stockpiles and cut oil revenues
A U.S.-led coalition air campaign destroyed $500 million in Islamic State cash, reports USA Today.
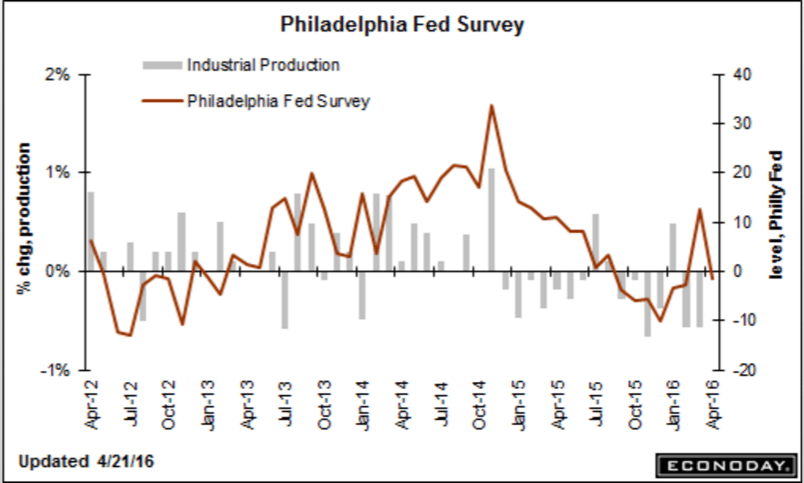
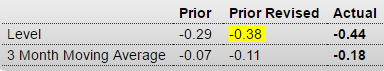
Philly Fed, Chicago Fed, New unemployment claims
Whoops, back down:
Philadelphia Fed Business Outlook Survey
Same here:
Chicago Fed National Activity Index
If this is indeed falling because benefits have been made that much harder to get it means this channel of increased govt expenditures is disabled, and the cycle will get that much worse before it gets better:
Jobless Claims
Highlights
The labor market once again, against a background of soft data, shows itself as the economy’s leading positive. Initial claims fell 6,000 in the April 16 week to a much lower-than-expected 247,000. This is the lowest level since 1973 when, of course, the size of the labor market was much smaller. The 4-week average is down 4,500 to 260,500.