Housing starts, Beijing bans iPhone 6

Not good. Note from the chart how growth has stalled, and housing is not likely to add as much to GDP this year as it did last year:
er-6-17-1

Highlights
Housing starts are solid but not permits. Starts did slip 0.3 percent to a 1.164 million annualized rate in May but the trend is positive with the year-on-year gain at a very strong 9.5 percent. Permits, in contrast, popped 0.7 percent higher in the month to a 1.138 million rate but here the year-on-year rate remains deep in the contraction column, at minus 10.1 percent.

er-6-17-2

Building Permits:
Privately-owned housing units authorized by building permits in May were at a seasonally adjusted annual rate of 1,138,000. This is 0.7 percent above the revised April rate of 1,130,000, but is 10.1 percent below the May 2015 estimate of 1,266,000.
Read more at www.calculatedriskblog.com/#2o0RYeSxs7oQoXgd.99

Interesting:

Beijing bans iPhone 6, saying it’s too similar to Chinese phone

By Kate Rooney
er-6-17-3

CPI, US current account, Philly Fed, Housing market index, Wage data

Continues well below the Fed’s target:

er-6-16-1
Highlights
Whatever pressure may be building in import & export prices or even producer prices, it has yet to give much of a boost to consumer prices which rose only 0.2 percent in May. Core prices, that is prices excluding food and energy, also came in at plus 0.2 percent.

Year-on-year rates aren’t going anywhere, at only plus 1.0 percent for total prices and plus 2.2 percent core prices. Though the 2.2 percent rate does exceed the Fed’s 2 percent target, core consumer prices are not what the Fed tracks most closely, rather core PCE prices which typically run 1/2 point lower.

Housing costs rose 0.3 percent and at a year-on-year 2.4 percent are showing tangible pressure. Medical care is at the top of list showing pressure, up 0.3 percent but still at a manageable year-on-year rate of plus 3.2 percent.

Other readings are much flatter, including a 0.7 percent year-on-year rise for food and a 0.5 percent rise for apparel. Energy prices, though rising 1.2 percent in the month, are still down 10.1 percent on the year with gasoline down 16.9 percent.

It’s the trend that counts most and the trends for consumer prices are still flat, not yet reflecting the recovery in oil prices. This report does not lift the chances for a rate hike at the July FOMC.

You could say it’s ‘flooding the world with dollars’:

US Current Account Gap At 7-Year High

er-6-16-2

er-6-16-3
Highlights
The Philly Fed’s headline index, which is a measure of general sentiment based on a single question, can often read much differently than the assessment of actual conditions. And this is the case for the June report where the constructive looking 4.7 headline doesn’t match the details which are almost uniformly negative.

New orders, at minus 3.0, are contracting for a second month while contraction in unfilled orders, at minus 12.6, is deepening. At minus 2.1, shipments are in a third month of contraction. Employment, at minus 10.9, has been in contraction for the entire year. The sample appears to be destocking and delivery times are shortening, both indications of weakness.

The only signs of actual life in this report are in prices. Input costs are going up, a reflection of fuel and raw materials, while selling prices are edging higher.

Otherwise this report, including the 6-month outlook which continues to show less and less optimism, does not confirm the strength of Wednesday’s Empire State report and will not lift the outlook for what is a very flat factory sector.

er-6-16-4

Up a bit:

er-6-16-5
Canadian wages:
er-6-16-6

Mtg apps, Empire State survey, Industrial Production, Euro area trade surplus

Purchase applications backed off but have been moving higher for several months, though still very depressed:
er-6-15-1
er-6-15-2
A nice move up but as per the chart it’s hovering around 0:
er-6-15-3
er-6-15-4
Worse than expected, and continues at recession levels, and note the decline in autos:
er-6-15-5
Highlights
A steep drop in vehicle production pulled industrial production lower in May, down 0.4 percent. Vehicle production had been leading this report but fell 4.2 percent in the month excluding which the headline loss would have been 2 tenths less severe at 0.2 percent. Utility output is always volatile and fell 1.0 percent, which isn’t helpful, but mining for once is, up 0.2 percent for the first gain since August last year.

The manufacturing component, hit especially by vehicles, is the big disappointment, down 0.4 percent in the month. Declines sweep sub-components including consumer goods, business equipment and construction supplies. Year-on-year, manufacturing volumes are unchanged in what is reminder of how soft the factory is.

There’s also downward revisions to April including manufacturing where the gain is 1 tenth more modest at 0.2 percent. The weakness of the factory sector, and its exposure to foreign markets and declining business investment, is contrasting very sharply right now with strength in the consumer sector.

Note that the traditional non-NAICS numbers for industrial production may differ marginally from the NAICS basis figures.
er-6-15-6

This is what continues to put upward pressure on the euro, offsetting the portfolio shifting due to fears of Brexit, negative rates, and QE, in contrast to the negative US trade gap:

Euro Area Balance of Trade
The Eurozone trade surplus widened 31.5 percent year-on-year to €27.5 billion in April of 2016. It is the highest trade surplus for an April month on record as imports fell at a faster pace than exports due to decline in oil prices.

er-6-15-7

Saudi output, Fed Atlanta, NY Fed GDP forecast, Credit card company sell off

Saudi output hasn’t materially changed. The previous strategy was to set the price low enough for output to increase. So seems the new oil minister has changed course is now setting price as high as he thinks he can set it without triggering development of higher priced oil.
er-6-14-1a
Let me suggest this GDP ‘forecast’ is about as high as it gets before substantially falling back, as it did last quarter. This is because it is an account of what’s happened in April and May based on actual reports, and is not meant to take into account the reversion of a volatile series over the following months. Nor would it, for example, assume that an inventory increase one month would result in a decrease the next. Or that the downward revisions in employment, for example, raises the likelihood of downward revisions in other series:
er-6-14-2a
Yes, the private sector is ‘pro cyclical’. As things deteriorated, beginning, in this case with the collapse of oil capex at the end of 2014, it all started going down hill, as no other spending stepped up to the plate to replace the maybe $15 billion/month of lost capex spending, which also means $15 billion less income than otherwise. The lost sales and income then feeds on itself, in a downward spiral that slowly accelerates until some source of deficit spending emerges. That historically comes either the nice way- a pro active fiscal adjustment such as a tax cut or spending increase, or the ugly way as unemployment compensation increases and tax receipts fall off. And by making unemployment benefits harder to get this time around, that channel has been materially reduced:

“There Is A General Softening In The Consumer’s Ability To Pay” – Why Credit Card Companies Are Crashing

By Tyler Durden

June 14 (Zero Hedge) — Card issuers are warning that credit trends have deteriorated after years of historically low write-off rates. Capital One CEO Richard Fairbank said at a conference this month that soured loans are rising, while JPMorgan Chase & Co.’s Jamie Dimon said that credit is “going to get worse.” Revolving debt held by U.S. consumers increased to $951.5 billion at the end of April, a 5.5 percent increase from a year earlier, according to the Federal Reserve.

Cited by Bloomberg, Daniel Werner, a Morningstar Inc. analyst in Chicago, said that “it sure seems like the market thinks its more of a tidal and secular shift. We’re not at a point where people should really be panicking.”

NFIB Small Business Optimism Index, Retail sales, Redbook retail sales, Business inventories

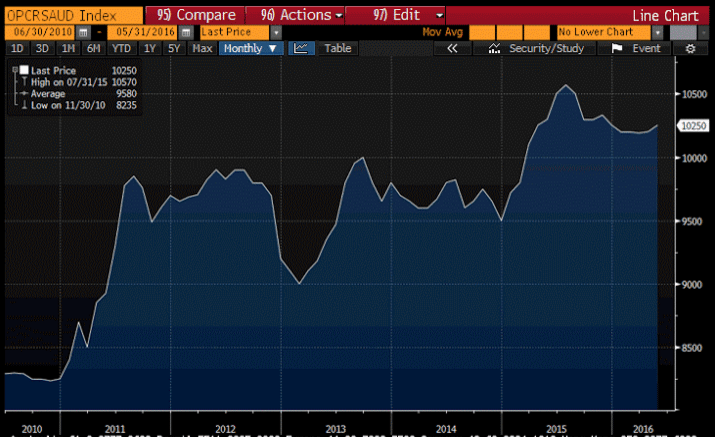
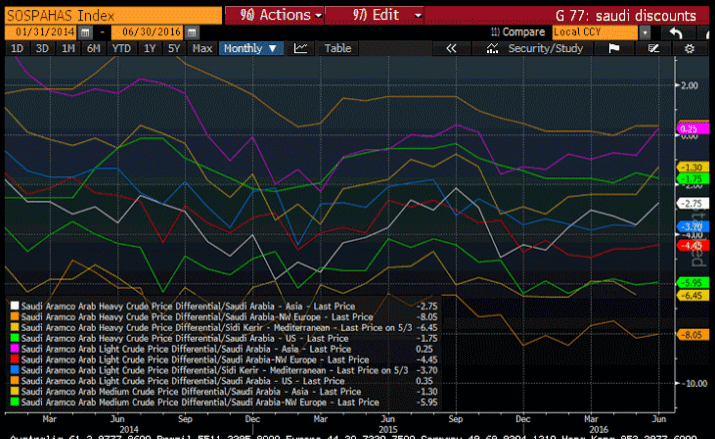
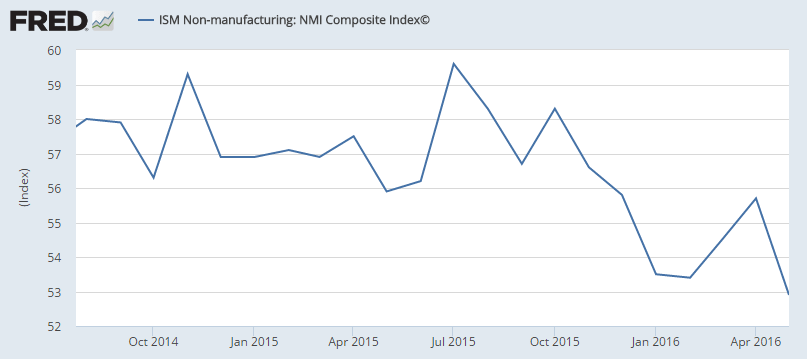
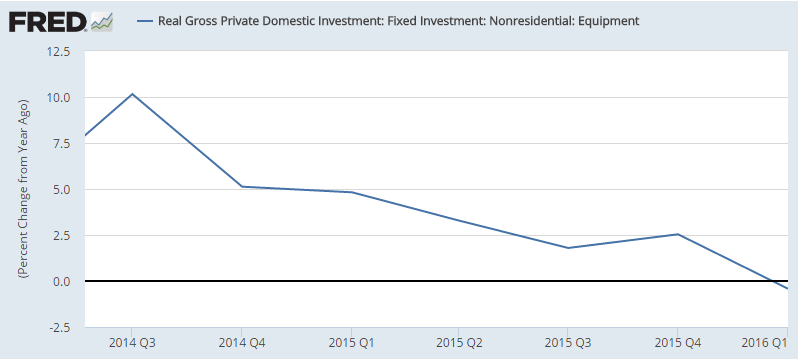
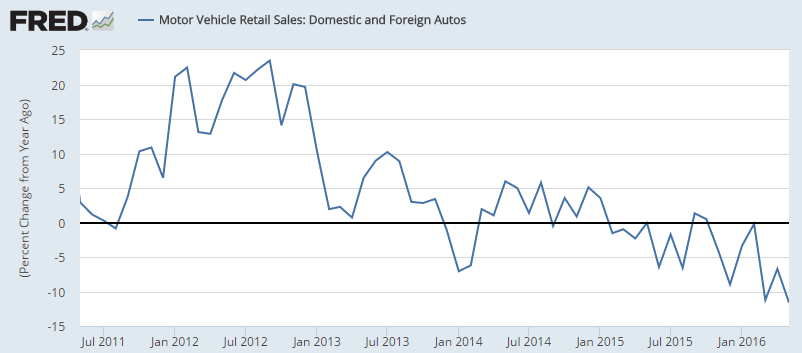
The charts of all the components look just as bad.
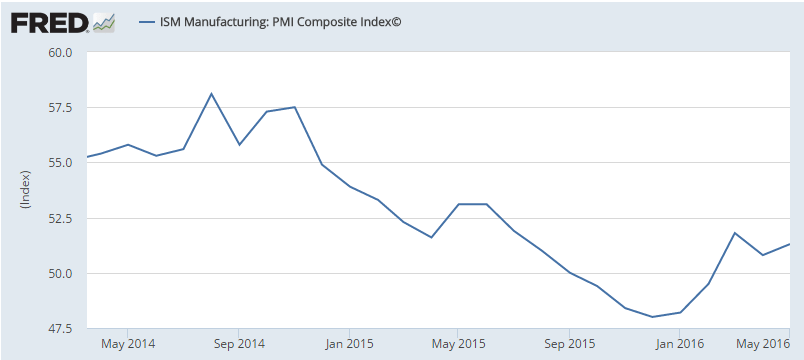
And note the collapse after oil capex collapsed:
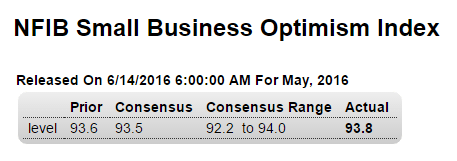
er-6-14-1
Highlights
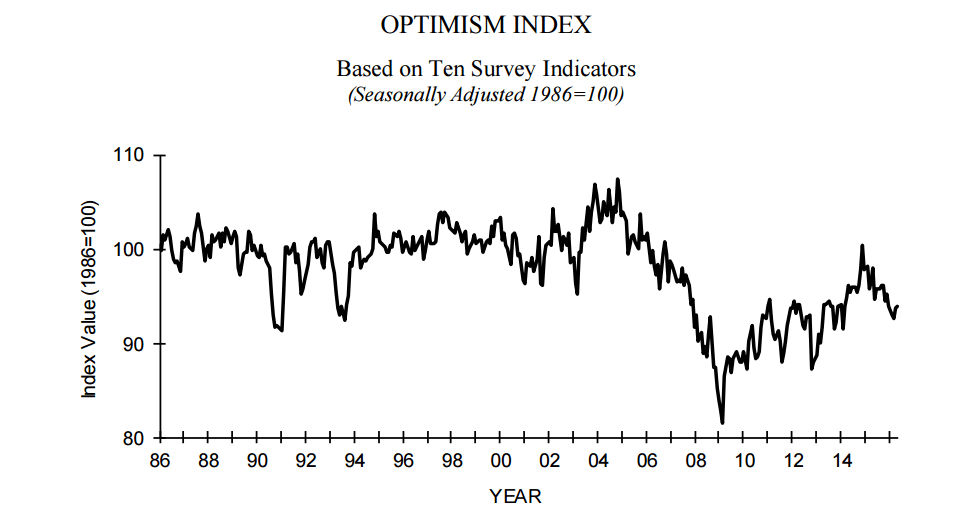
The small business optimism index rose 0.2 points in May to 93.8, slightly extending April’s 1 point bounce back from 2-year lows but remaining well below the 42-year average of 98. Four of the 10 components of the index showed gains in May, two were unchanged and four declined. Expectations that the economy will improve posted the largest gain, rising 5 points but remaining quite negative at minus 13. The two strongest components both declined, with plans to increase capital outlays falling 2 points to a still very solid 23, and job openings hard to fill was also down 2 points to 27, though business owners still find this as their fourth most important business problem. Plans to increase employment did rise 1 point, however, to 12. While earnings trends, the most pessimistic of the components, fell 1 point to minus 20, more business owners thought that now was a good time to expand, up by 1 point to 9.
er-6-14-2
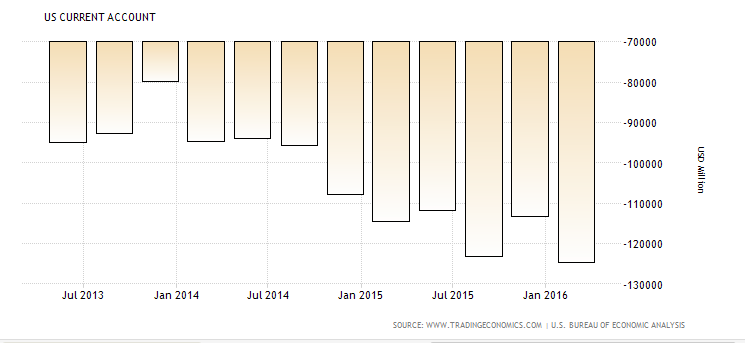
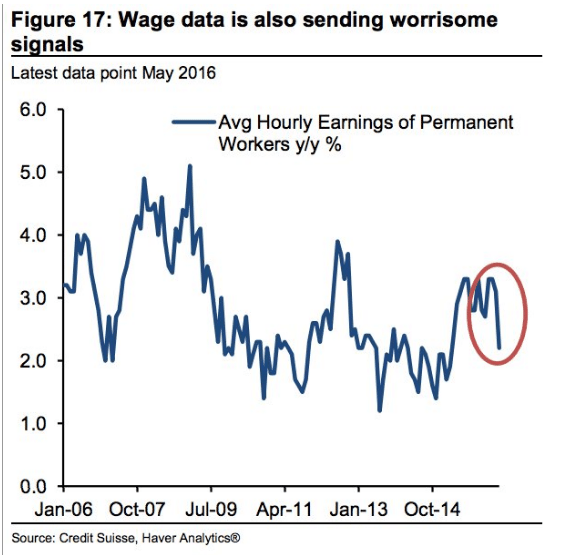
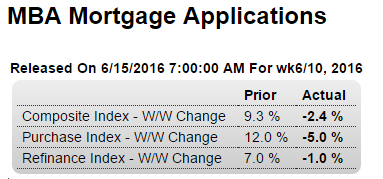
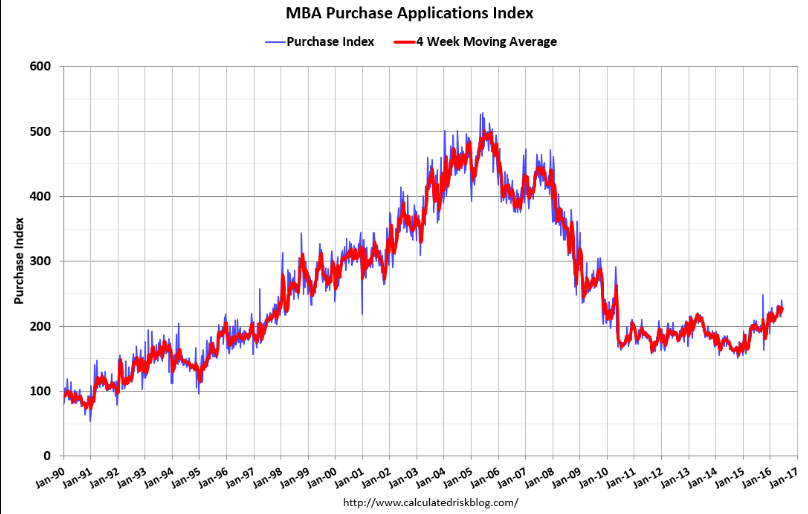
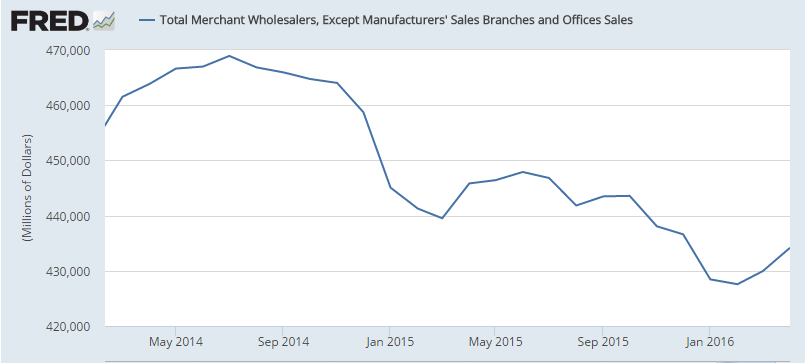
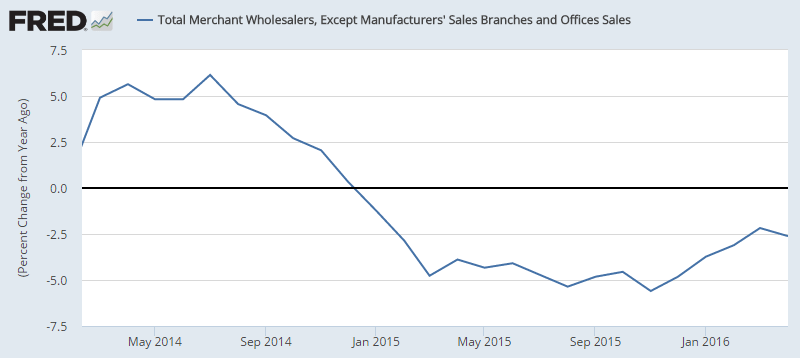
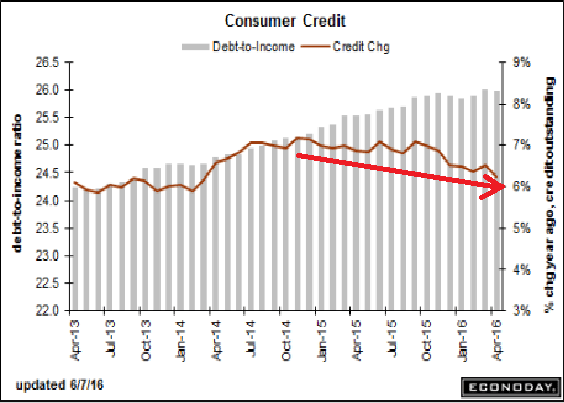
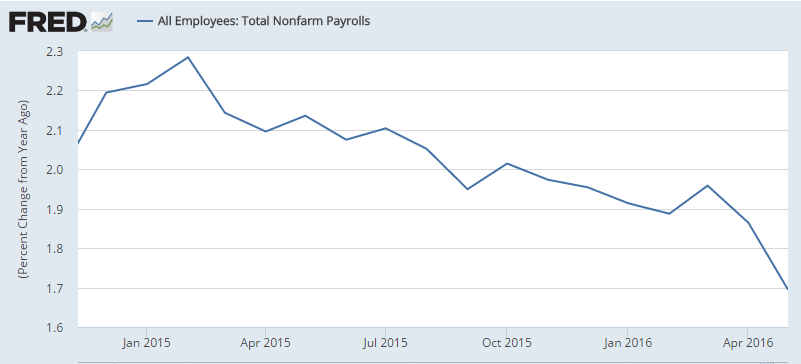
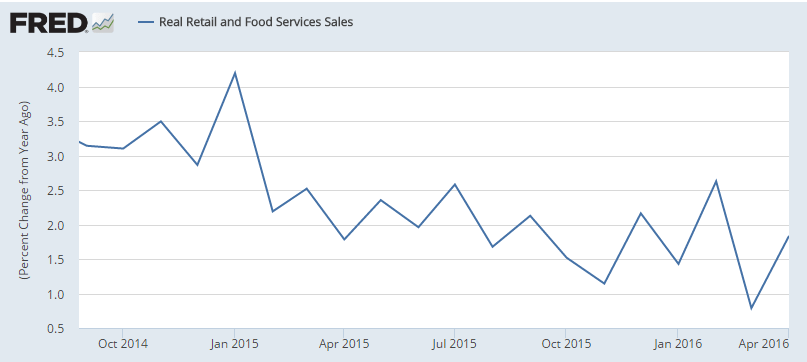
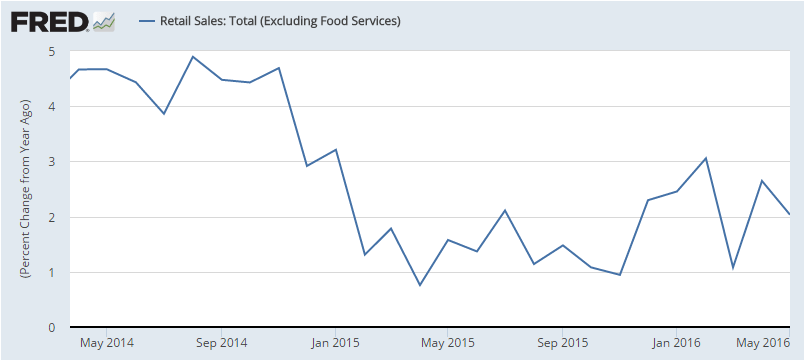
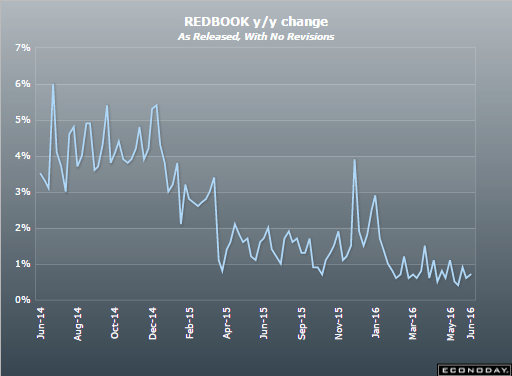
After the promising April release, May is coming back down as suspected, with a lot of help from higher gas prices, which likely will show up as reduced savings. And the year over year down trend continues, with growth at very low levels, after peaking when oil capex collapsed:
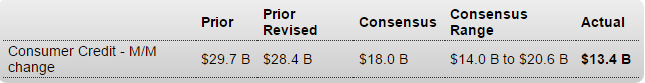
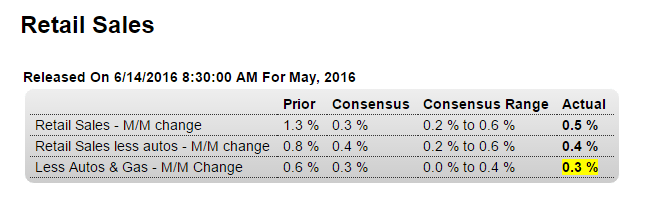
er-6-14-3Highlights
Consumer spending proved to be the biggest surprise of April and is at least a pleasant surprise in May. Retail sales rose a very solid and better-than-expected 0.5 percent with strength evident, though to a less degree than in April, through the balance of the report. Auto sales did give a boost to total sales but sales ex-auto, up 0.4 percent, were nearly as solid. Gasoline, reflecting higher prices, once again gave an outsized boost to sales though the gain for sales excluding autos and gas is respectable at plus 0.3 percent. The gain excluding gas alone also came in at 0.3 percent.

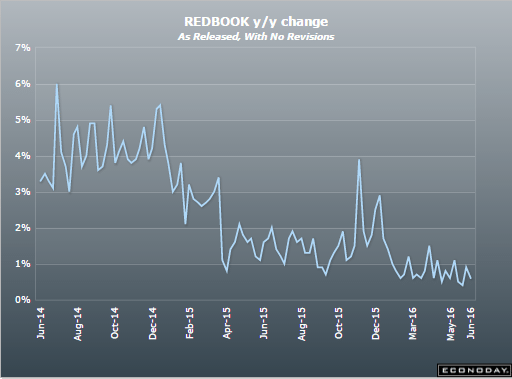
Year-on-year rates, however, moderated several tenths in May and are at very soft levels. Total year-on-year sales are up only 2.5 percent with ex-auto ex-gas at plus 4.1 percent and ex-gas alone at plus 3.7 percent.

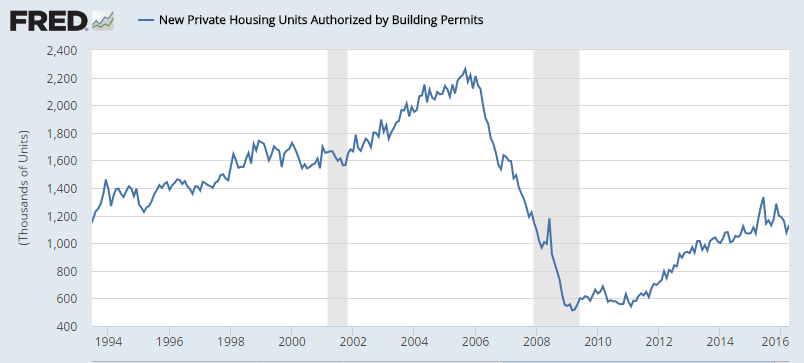
Building materials have been very weak, down a steep 1.8 percent for the third straight monthly decline and pointing to moderation in residential investment. General merchandise was also down in the month as were sales at department stores.

The strength in the report is centered once again in nonstore retailers where sales, reflecting big gains for ecommerce, rose 1.3 percent on top of the prior month’s 2.5 percent surge. Year-on-year, nonstore retailers lead the way with at 12.2 percent pace. Restaurants, a key discretionary category, continue to show strength with an 8 tenths gain on the month and a year-on-year rate of 6.5 percent.

Strength is definitely the theme of this report, one that ultimately reflects strength in the labor market and which is pointing squarely to another strong month for total consumer spending in May. The outlook for the second quarter just got an upgrade and will keep alive chances for a rate hike at the July FOMC.
er-6-14-4
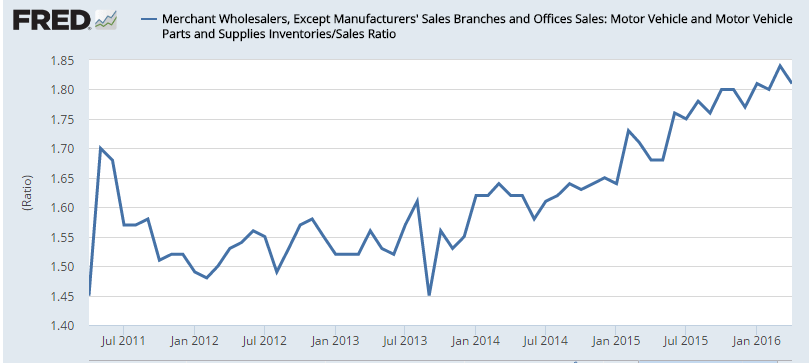
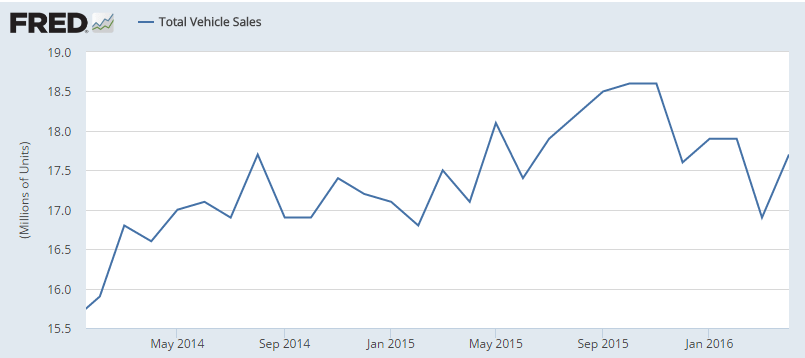
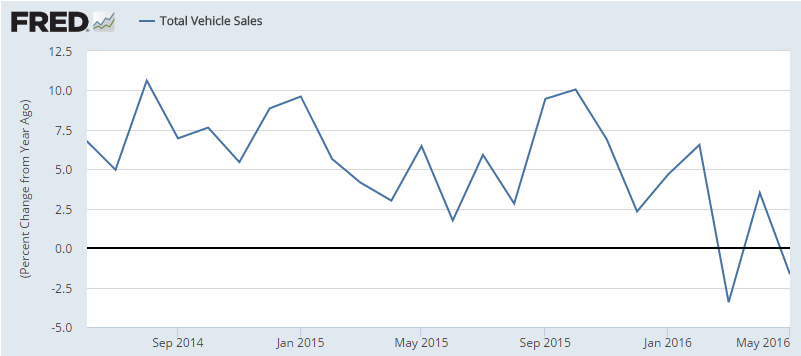
This came out last week:
er-6-14-5
er-6-14-6
er-6-14-7
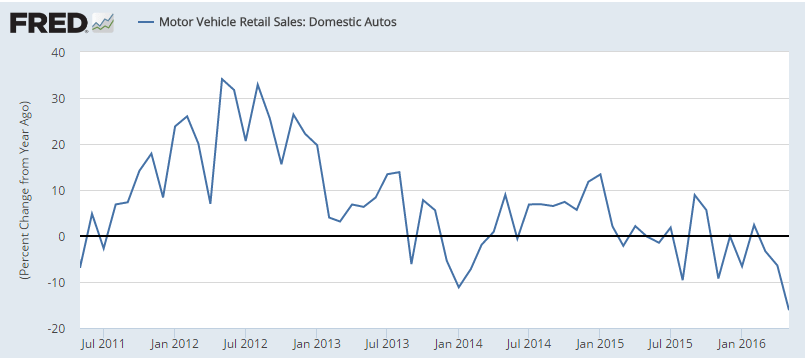
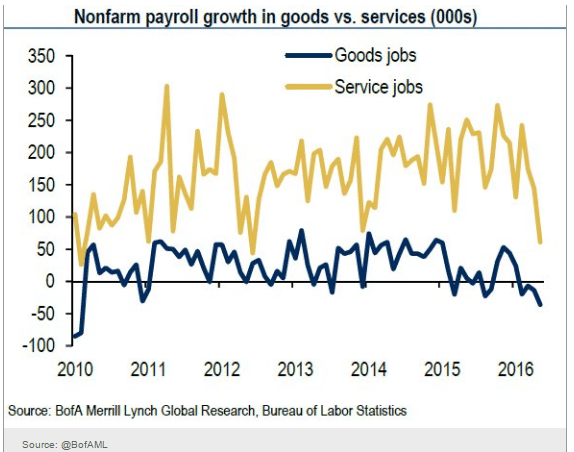
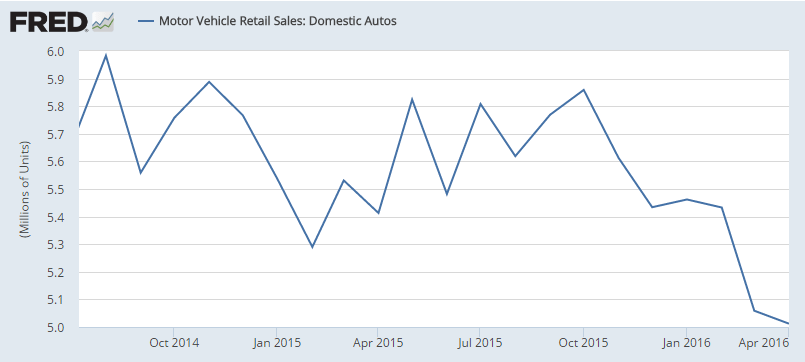
This was where the growth was coming from, and it’s been decelerating as total vehicle sales stagnated:
er-6-14-8
er-6-14-9
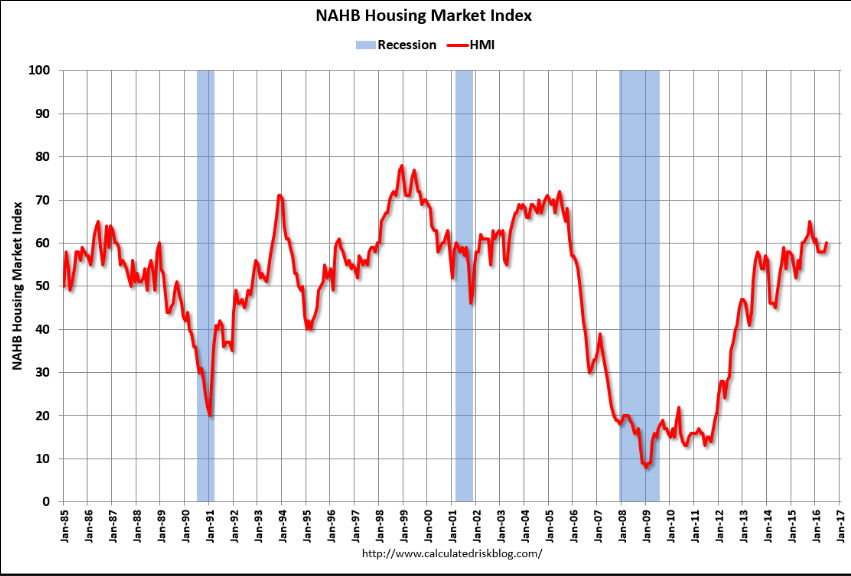
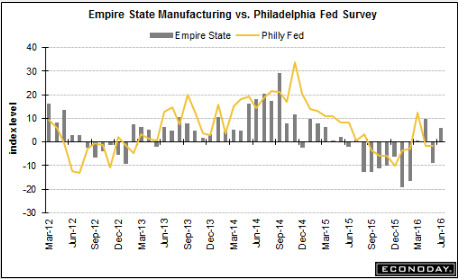
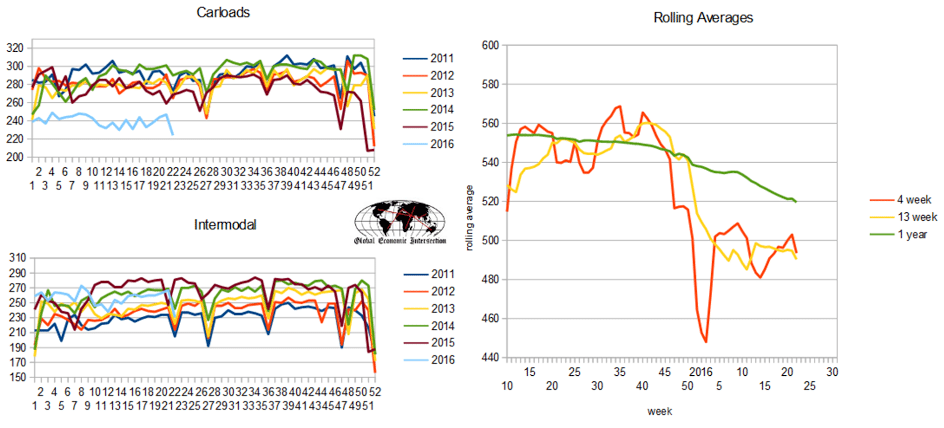
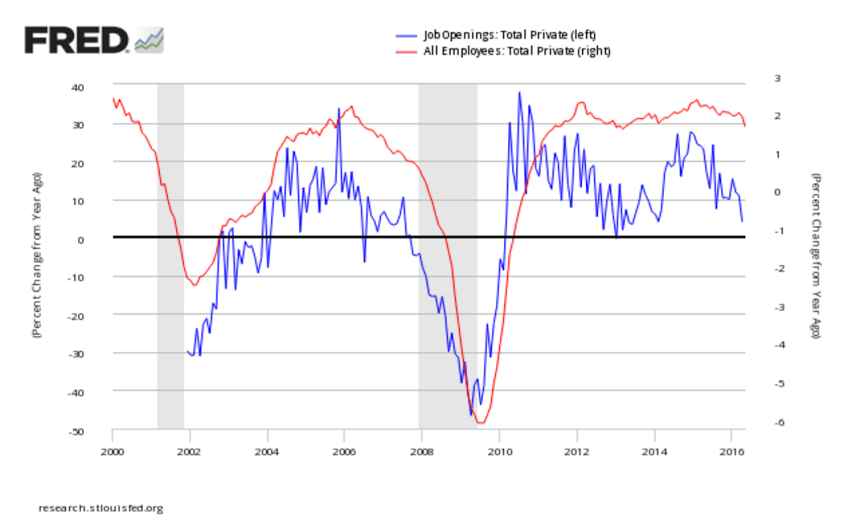
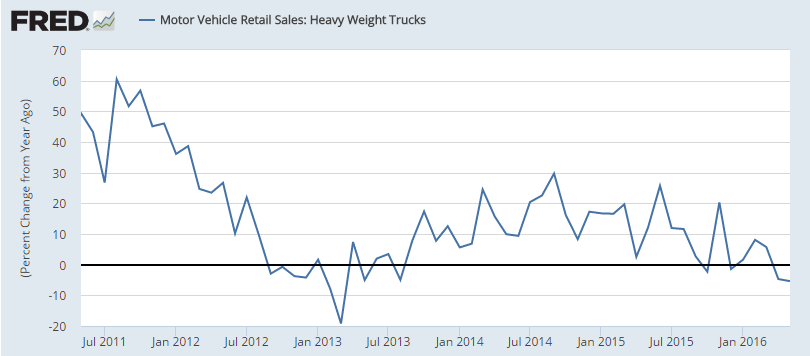
Still no sign of life here:
er-6-14-10
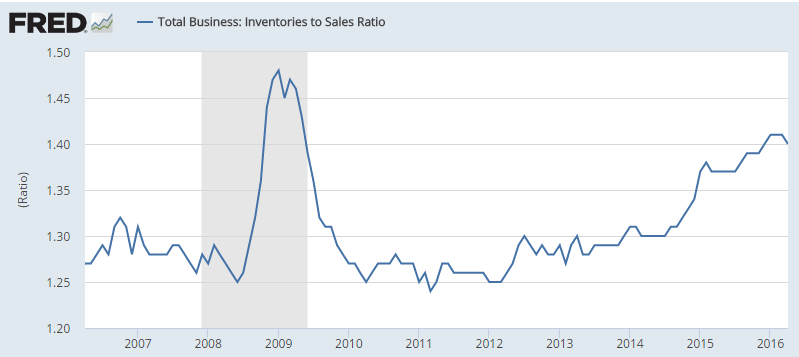
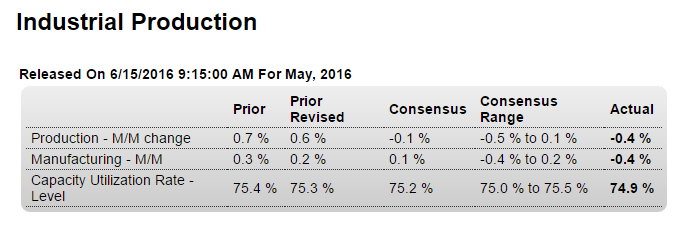
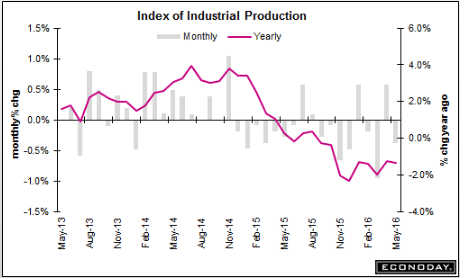
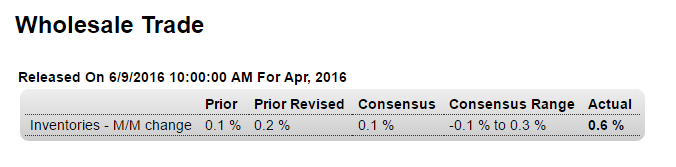
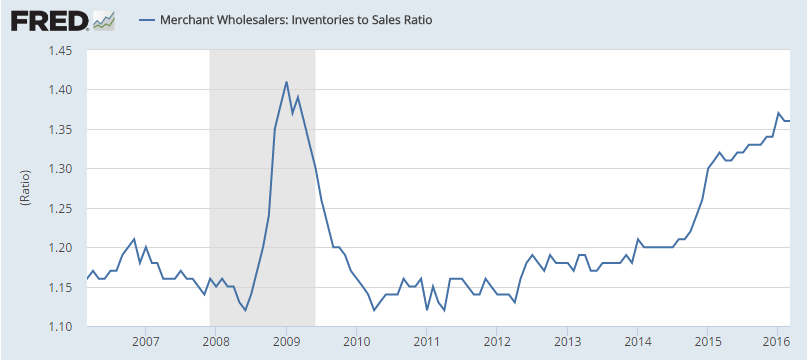
This is an April number, and inventories were still excessive, likely resulting in output cutbacks:
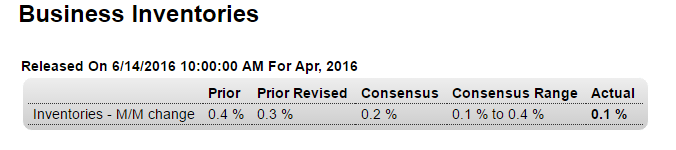
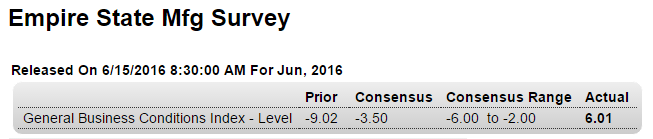
er-6-14-11
Highlights
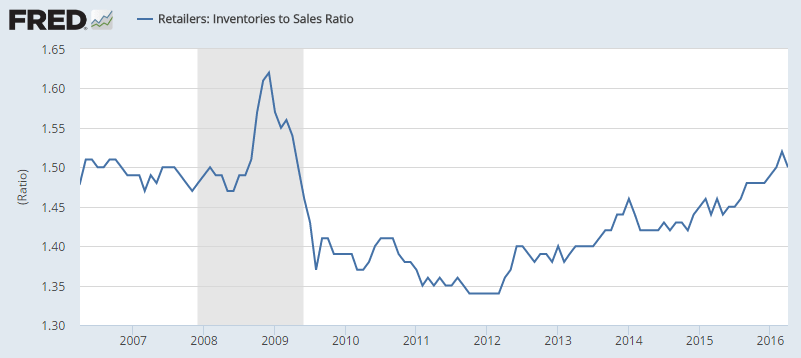
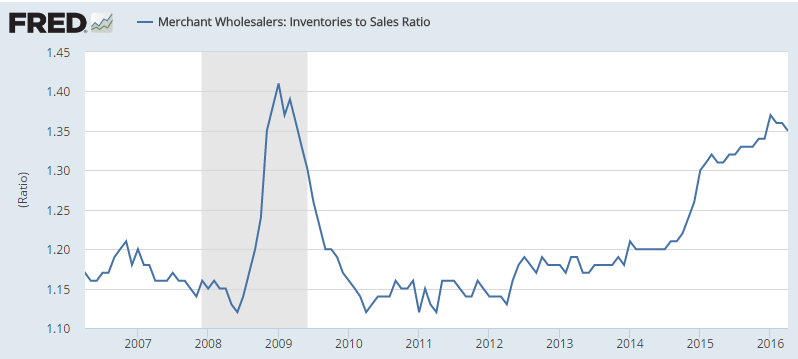
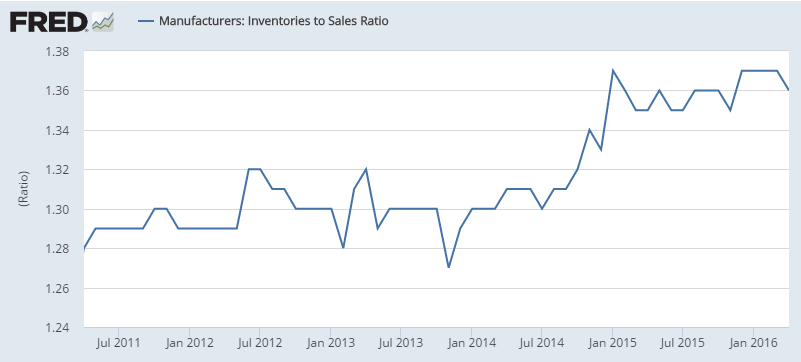
The strength of April now includes business inventories where strong sales limited the build to only 0.1 percent. Business sales jumped 0.9 percent to pull the inventory-to-sales ratio, which had been climbing, down to 1.40 from 1.41. Retail inventories slipped 0.1 percent in April and aren’t likely to build much at all in May given this morning’s strength in the retail sales report. Factory inventories also slipped 0.1 percent with the May outlook to turn on tomorrow’s industrial production report. The negative in April is in wholesale inventories which rose 0.6 percent. Inventory builds are only wanted when there’s strength in sales which, though starting the year off slowly, may now be picking up.
er-6-14-12
er-6-14-13
er-6-14-14
er-6-14-15

Rail traffic, Employment agency chart, Growth vs cost cutting chart

Rail Week Ending 04 June 2016: Rail Contraction Accelerates

By Steven Hansen

June 10 (Econintersect) — Week 22 of 2016 shows same week total rail traffic (from same week one year ago) contracted according to the Association of American Railroads (AAR) traffic data. The improvement seen last week evaporated, and was likely due to the a holiday falling into different weeks between years.

er-6-10-1

And this indicator:
er-6-10-2

Cost cutting likewise reduces income:
er-6-10-3

JOLTS, Unemployment claims, Wholesale inventories and Sales

The deceleration in jobs openings released yesterday leads the deceleration in employment. Downward job revisions also mean lower income estimates, so watch for personal income and savings to be revised down as well. And it all started decelerating after oil capex collapsed at the end of 2014.
er-6-9-3

Job Openings Hit Record High, But Hiring Fades In JOLTS Survey

By Ed Carson

June 8 (IBD) — Job openings matched a record high in April but hiring activity sank to the lowest since last August, the Labor Department said Wednesday in its Job Openings and Labor Turnover Summary report. The number of job openings rose by 118,000 to 5.788 million, equaling last July’s peak on records going back to 2001. Meanwhile, the actual number of hires slid by 198,000 to 5.092 million. Separations declined by 108,000 to 4.988 million. Layoffs fell to their lowest level since September 2014. The number of workers quitting their jobs dipped slightly.

Claims remain depressed, best I can tell due to states making them so hard to get. This means the economy is deprived of the federal spending, making things worse:
er-6-9-4
Inventories remain far too high even with the slightly lower 1.35% sales/inventory ratio. And the large sales increase was based on the April vs March car sales increase. So with the May vs April car sales flat, total sales growth looks to resume it’s prior slide, as per the chart. So while April may show some GDP strength due to inventory building, I expect it all to more than reverse by quarter end:
er-6-9-5
Highlights
Wholesales inventories rose a very sharp 0.6 percent in April in a result that will lift early estimates for second-quarter GDP. And the build (risking a double negative) is not unwanted as sales in the wholesale sector rose a very strong 1.0 percent. The mix actually points to a leaner level of inventories with the stock-to-sales ratio down to 1.35 from 1.36.

Sales of autos were especially strong in the wholesale sector during April, up 1.6 percent and making for a 0.4 percent decline in inventories in a draw that will, based on solid unit sales data for May, have to be replenished.
er-6-9-6
er-6-9-7
This doesn’t bode well either- inventories remain high given the pace of sales.
er-6-9-8
This hasn’t updated but it’s only down to 1.35:
er-6-9-9

Mtg purchase apps, Productivity, Unemployment survey, Article submitted

From the MBA:

The Refinance Index increased 7 percent from the previous week. The seasonally adjusted Purchase Index increased 12 percent from one week earlier. The unadjusted Purchase Index decreased 12 percent compared with the previous week and was 6 percent lower than the same week one year ago.

er-6-8-1
Highlights
Purchase applications for home mortgages rose strongly in the June 3 week and were up 12 percent from the prior week when seasonally adjusted to account for the Memorial Day holiday, while refinancing increased by 7 percent. Unadjusted, however, purchase applications decreased by 12 percent from the previous week. Mortgage activity continues to benefit from very low rates, with the average 30-year mortgage rate for conforming loans ($417,000 or less) down 2 basis points from the prior week at 3.83 percent.
er-6-8-2

Productivity is output per employee. So as output growth slows, productivity declines and unit labor costs increase until employment growth is reduced.

So looks to me like the slowing of output growth and declining productivity lead to the employment declines.

And it’s a continuing process:

Weak Productivity, Rising Wages Putting Pressure on U.S. Companies

By Josh Mitchell

June 7 (WSJ) — Labor productivity fell at a 0.6% annual rate in the first quarter. Productivity grew an average 2.2% since World War II but has expanded just 0.5% over the last five years. Hourly compensation, encompassing everything from salaries to retirement benefits and health care costs, surged at a 3.9% annual rate in the first quarter. It rose 3.7% over the past year. In the first quarter, labor costs per unit of output rose 4.5% at a yearly rate and 3% from a year earlier. Fed Chairwoman Janet Yellen said on Monday she was “cautiously optimistic” that productivity would return to faster growth.

Seems there might be a lot more slack than most have been estimating:

US unemployed have quit looking for jobs at a ‘frightening’ level: Survey

By Jeff Cox

June 8 (CNBC) — Nearly half of unemployed Americans have quit looking for work, and the numbers are even worse for the long-term jobless, according to a poll released Wednesday that paints a grim picture of the labor market.

Some 59 percent of those who have been out of work for two years or more say they have stopped looking, the Harris Poll of unemployed Americans showed. Overall, 43 percent of the jobless said they have given up, according to the poll released in conjunction with Express Employment Professionals, a job placement service.

“This is a tale of two economies,” Express CEO Bob Funk said in a statement. “It’s frightening to see this many people who could work say they have given up.”

The results come just a few days after a government report showed thatthe unemployment rate fell to 4.7 percent in May, but the drop came primarily because of a sharp decline in the labor force participation rate. The number of people of all ages whom the government considers “not in the labor force” swelled by 664,000 to a record 94.7 million Americans, according to Labor Department data.

Recent paper I co authored, Maximizing Price Stability in a Monetary Economy

Saudi pricing, Consumer credit, Redbook retail sales, Fed discussion

er-6-7-1

Lower than expected as last month’s higher print reverses.

Remember all the hoopla over last month’s number? And how the consumer was finally spending?

I suspect you’ll hear nothing about how that’s not the case after all, and note how the chart shows it’s been decelerating since the collapse of oil capex:

Consumer Credit

Released On 6/7/2016 3:00:00 PM For Apr, 2016
er-6-7-2

Highlights
April was a strong month for retail sales but it wasn’t an especially strong one for consumer credit which rose $13.4 billion vs the prior month’s outsized gain of $28.4 billion (revised). Revolving credit, which jumped $10.4 billion in the month before, rose $1.6 billion, which like the headline, is on the soft side of trend. Nonrevolving credit rose $11.8 billion reflecting the month’s strength in vehicle sales as well as once again increases in student borrowing. Instead of borrowing, consumers dipped into their savings to fund their April spending spree as the savings rate, in data included in last week’s personal income & outlays report, fell a very sharp 5 tenths to 5.4 percent. Data on May spending got underway last week with unit vehicle sales which held steady at April’s respectable rate and point to another gain for this report’s non-revolving credit component. May’s retail sales, which are on next week’s calendar, may get more of a boost from revolving credit than from another drawdown in the savings rate.

er-6-7-3

So what else has been decelerating?

This measure of retail sales:
er-6-7-4
Payroll growth:
er-6-7-5
er-6-7-6
The service sector:
er-6-7-7
Manufacturing:
er-6-7-8
Investment:
er-6-7-9
Car sales:
er-6-7-10
er-6-7-11
Housing (nothing is built without a prior permit):
er-6-7-12
Retail sales:
er-6-7-13
This measure of wage growth just turned down from already low levels:
er-6-7-14

So what’s behind a looming Fed rate increase?

Higher rates are designed to first remove accommodation of interest sensitive sectors, the largest being investment, including housing, and cars, yet they are all decelerating, as are the employment index.

And measures of ‘inflation’ aren’t showing signs of excess demand either:

er-6-7-15

er-6-7-15