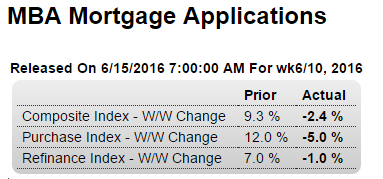
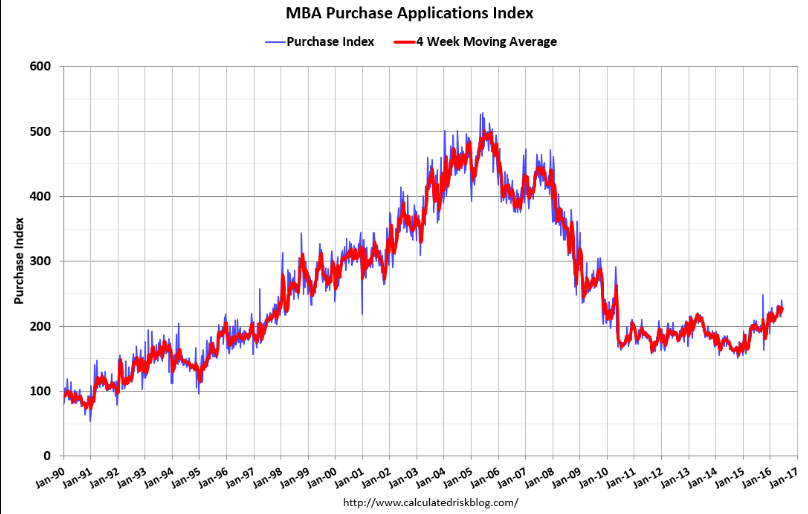
Purchase applications backed off but have been moving higher for several months, though still very depressed:
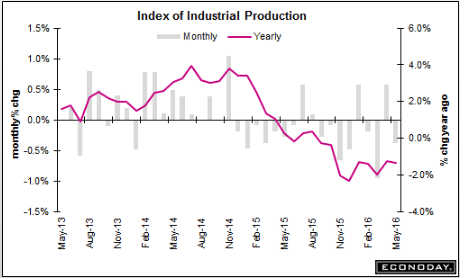
A nice move up but as per the chart it’s hovering around 0:
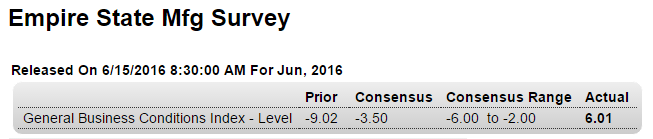
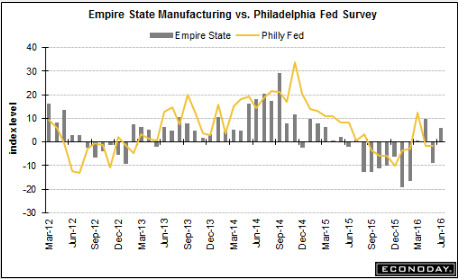
Worse than expected, and continues at recession levels, and note the decline in autos:
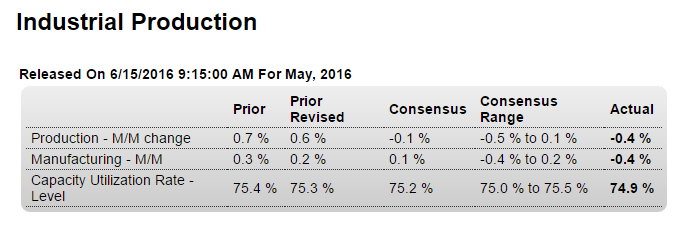
Highlights
A steep drop in vehicle production pulled industrial production lower in May, down 0.4 percent. Vehicle production had been leading this report but fell 4.2 percent in the month excluding which the headline loss would have been 2 tenths less severe at 0.2 percent. Utility output is always volatile and fell 1.0 percent, which isn’t helpful, but mining for once is, up 0.2 percent for the first gain since August last year.
The manufacturing component, hit especially by vehicles, is the big disappointment, down 0.4 percent in the month. Declines sweep sub-components including consumer goods, business equipment and construction supplies. Year-on-year, manufacturing volumes are unchanged in what is reminder of how soft the factory is.
There’s also downward revisions to April including manufacturing where the gain is 1 tenth more modest at 0.2 percent. The weakness of the factory sector, and its exposure to foreign markets and declining business investment, is contrasting very sharply right now with strength in the consumer sector.
Note that the traditional non-NAICS numbers for industrial production may differ marginally from the NAICS basis figures.
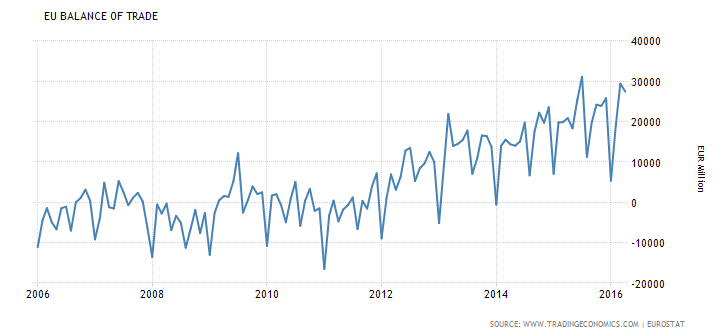
This is what continues to put upward pressure on the euro, offsetting the portfolio shifting due to fears of Brexit, negative rates, and QE, in contrast to the negative US trade gap:
Euro Area Balance of Trade
The Eurozone trade surplus widened 31.5 percent year-on-year to €27.5 billion in April of 2016. It is the highest trade surplus for an April month on record as imports fell at a faster pace than exports due to decline in oil prices.