
Link:
Tag Archives: Valance
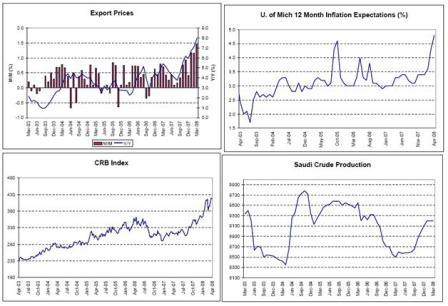
A few of the recent charts of interest
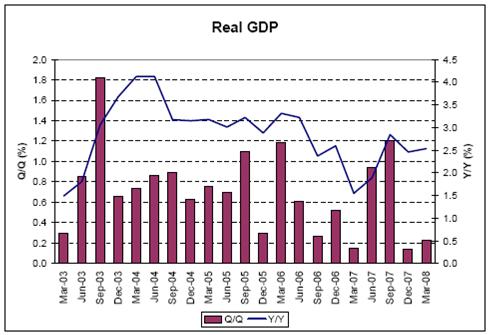
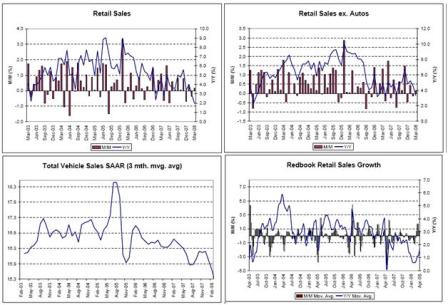
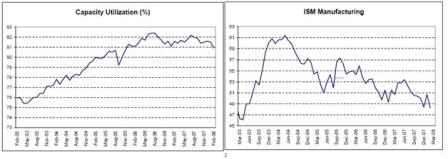
No sign of recession here.
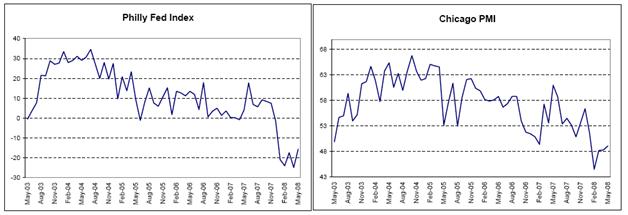
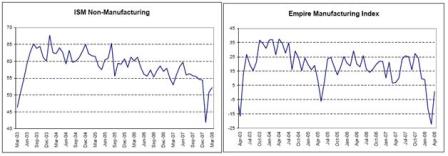
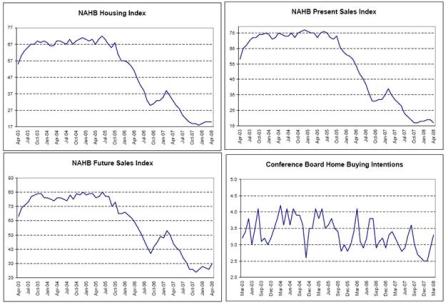
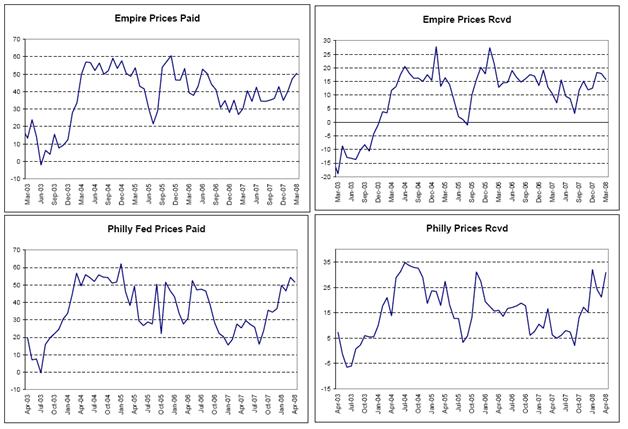
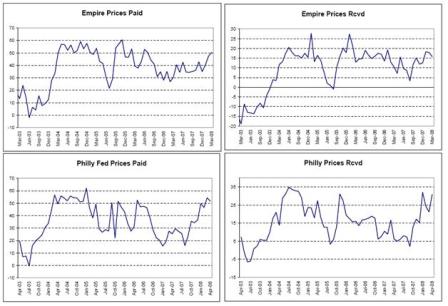
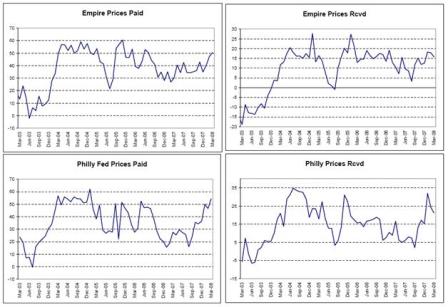
Several May surveys are showing signs of turning around some.
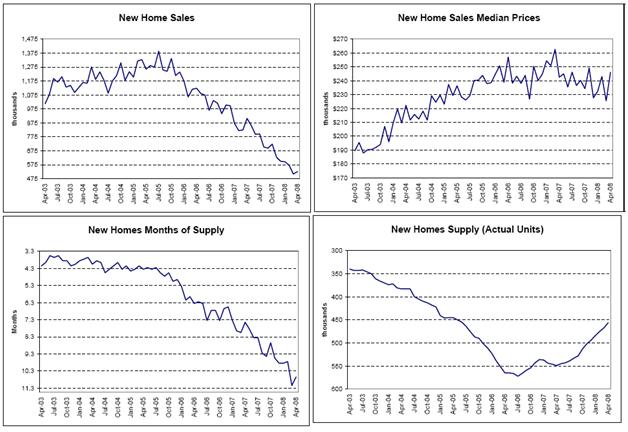
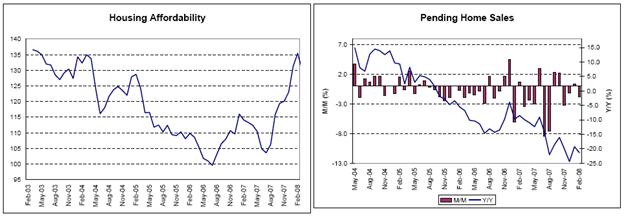
This was all ‘better than expected’ with prices blipping up and actual inventories continuing lower.
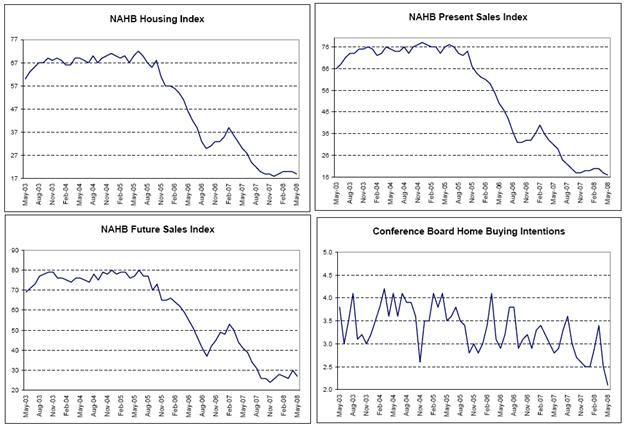
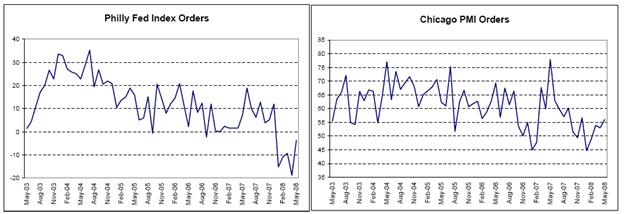
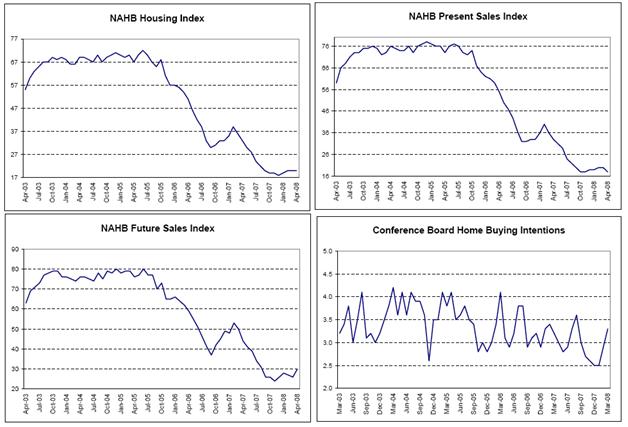
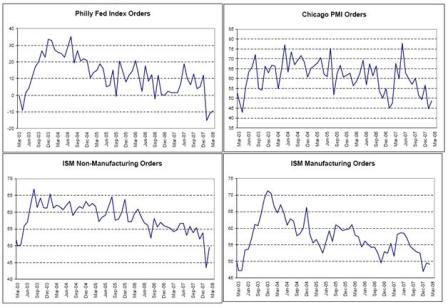
Still down but could be bottoming as well.
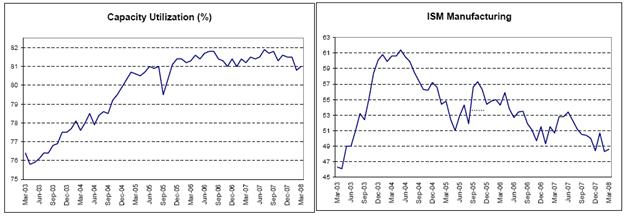
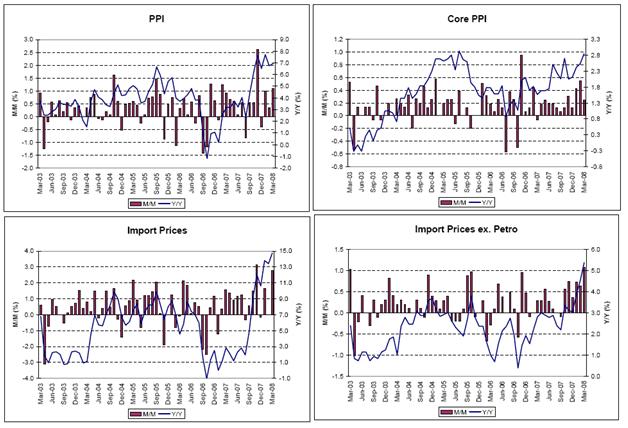
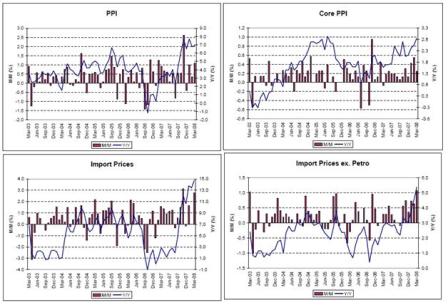
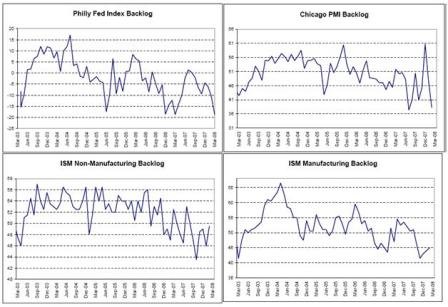
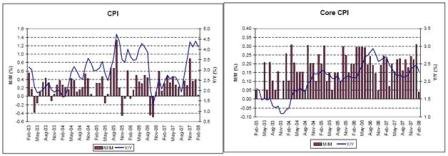
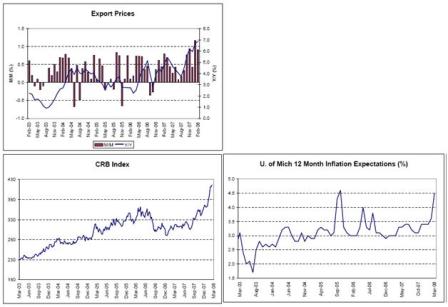
Still moving higher.
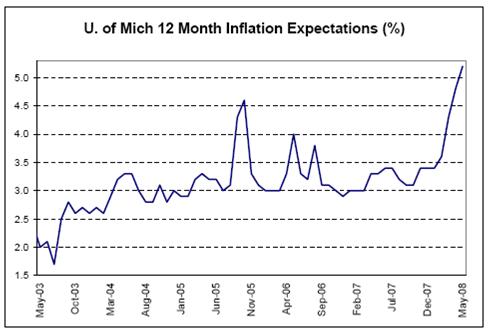
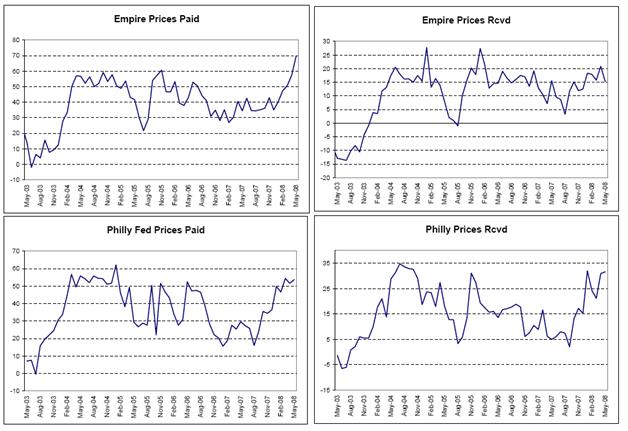
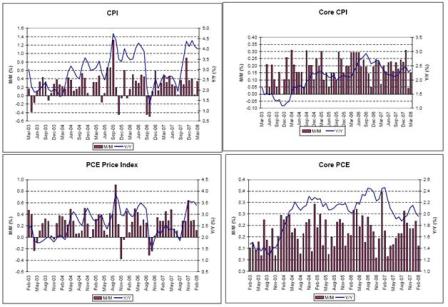
May price data has the Fed’s undivided attention.
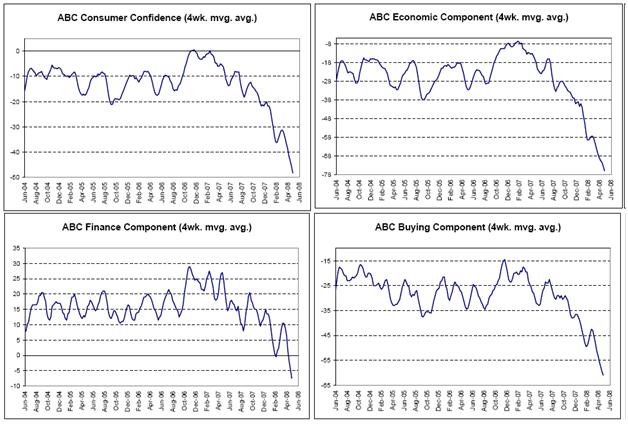
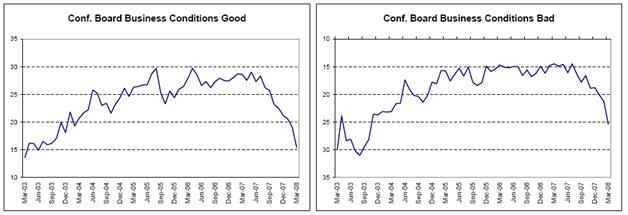
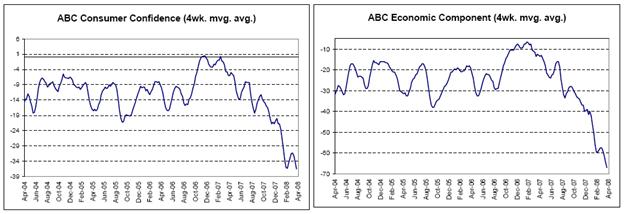
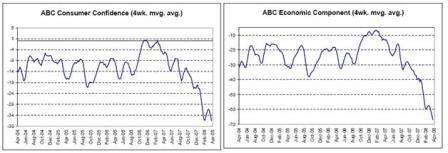
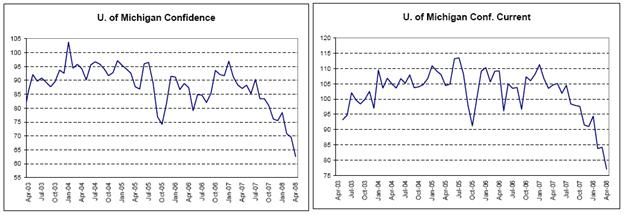
Confidence falls to new lows probably due to rising inflation expectations.
[top]
2008-04-25 Valance Chart Review
Twin themes remain:
- Weakening demand continues from Q2 2006
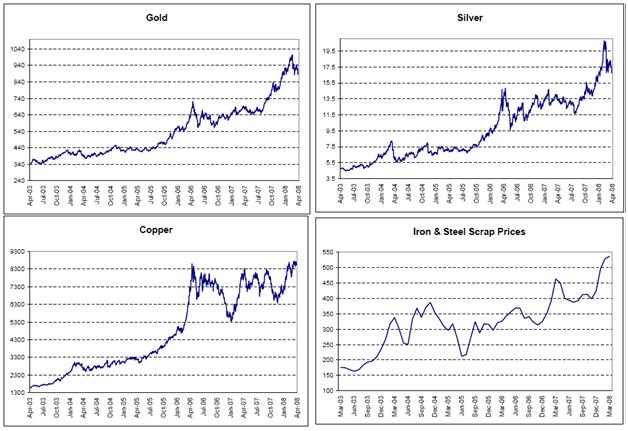
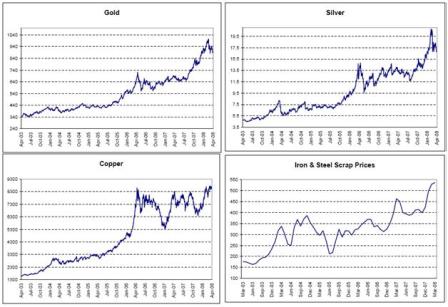
- Price indexes continue higher as Saudis continue to hike prices and let quantity adjust
Markets are pricing in the end of Fed Funds cuts due to diminished systemic deflationary risk and escalating inflation readings.
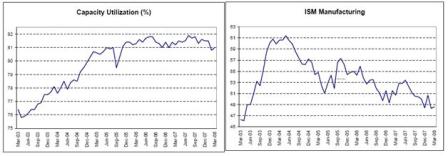
Down, but not out.
Most surveys are still trending down but not in collapse.
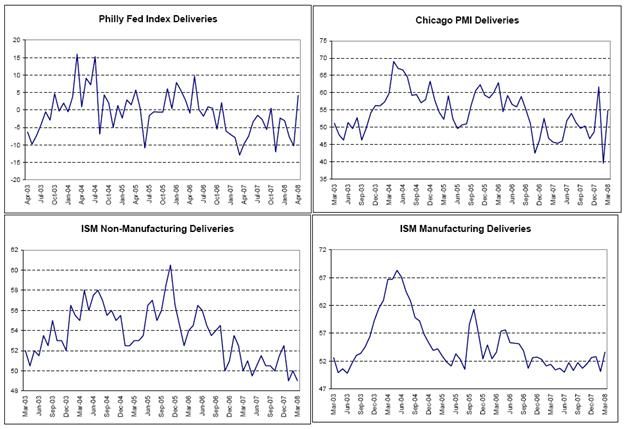
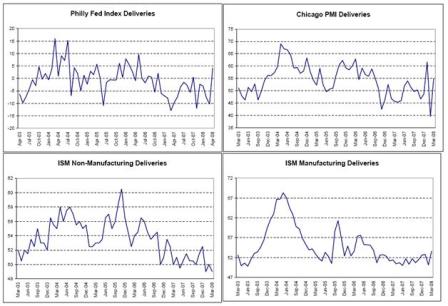
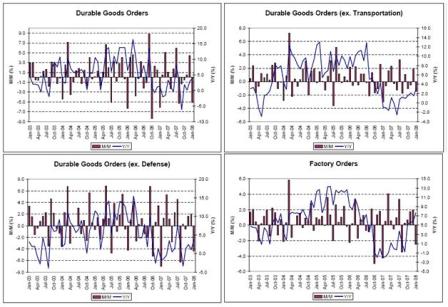
Actual deliveries still on the low side but exceeding expectations.
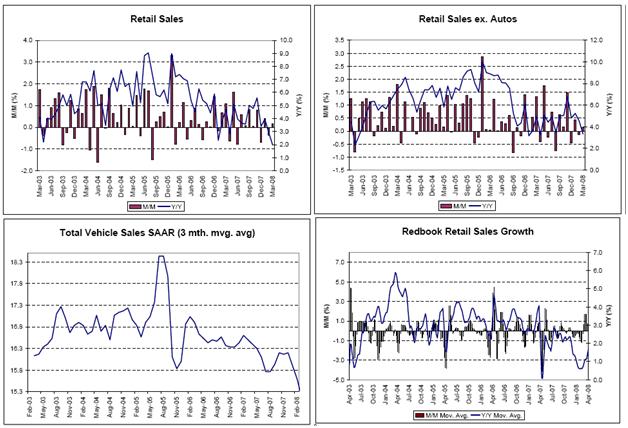
Weak but could be worse. Looking more and more like an export economy.
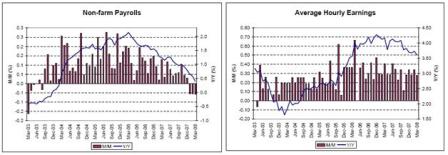
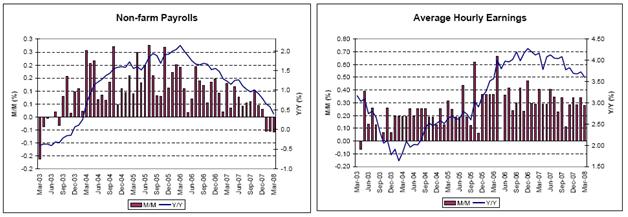
A weak first quarter for payrolls but above previous recession levels.
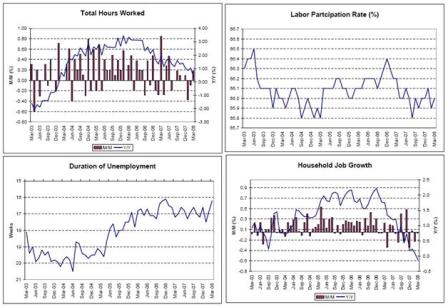
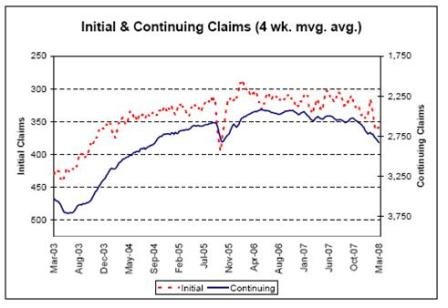
Weakness, but not all that bad yet, and jobless claims fell again last week.
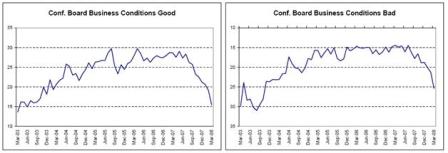
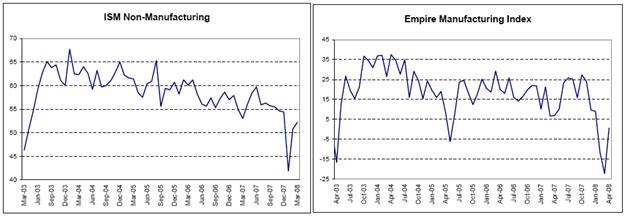
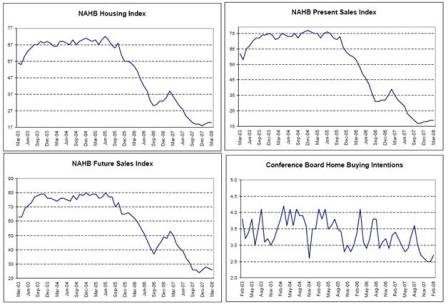
These kinds of surveys still looking very negative.
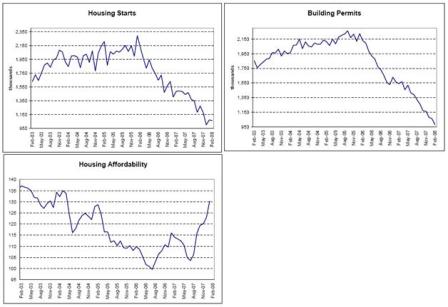
Housing may have stopped subtracting from GDP as of Q2.
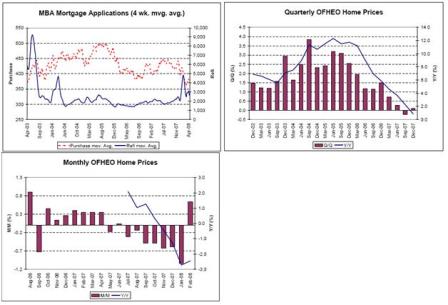
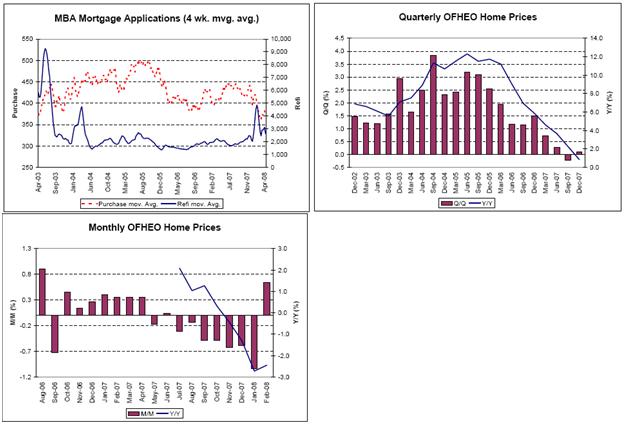
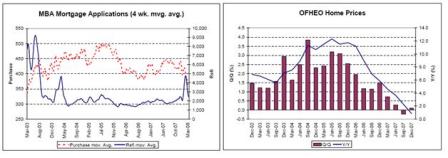
Applications may be turning up after a slow Q1. Some signs home prices are stabilizing as well.
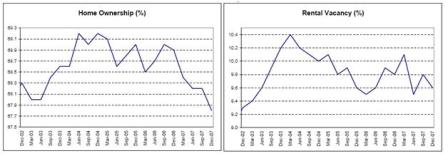
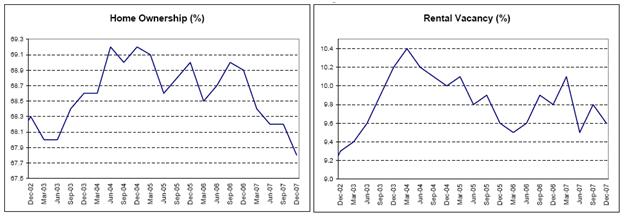
Low rental vacancies might support rent increases and the OER calculation in CPI.
Low home ownership due to negative sentiment means pent up buying demand.
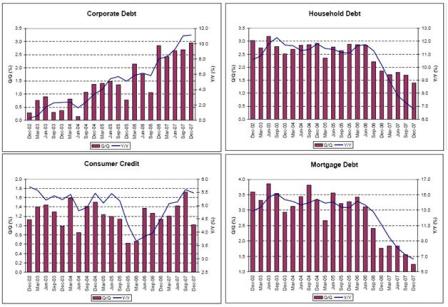
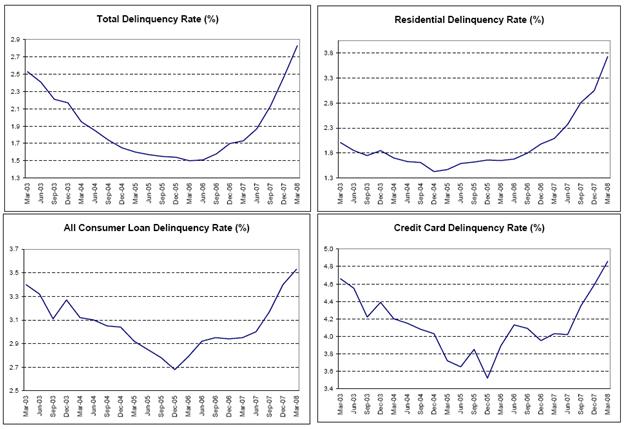
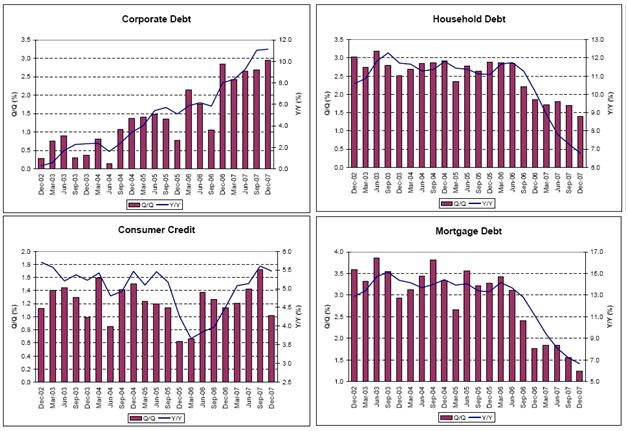
Households are recharging their debt batteries?
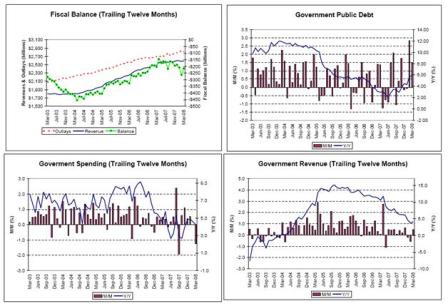
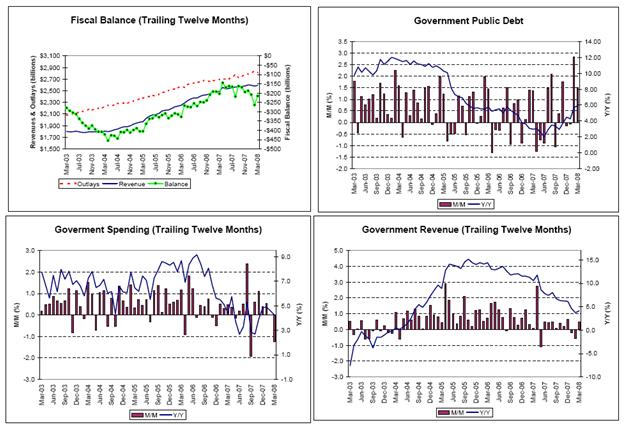
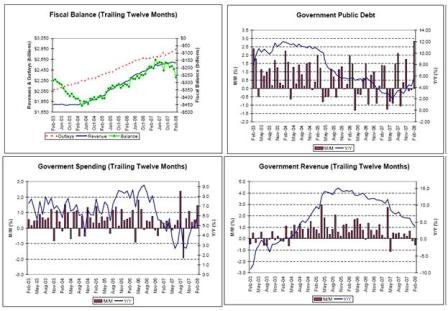
Net Federal spending on the rise this year, with fiscal package kicking in next week.
March government spending was down due to a timing issue – expect a strong increase in the June report.
Revenues muddling through at better than recession levels.
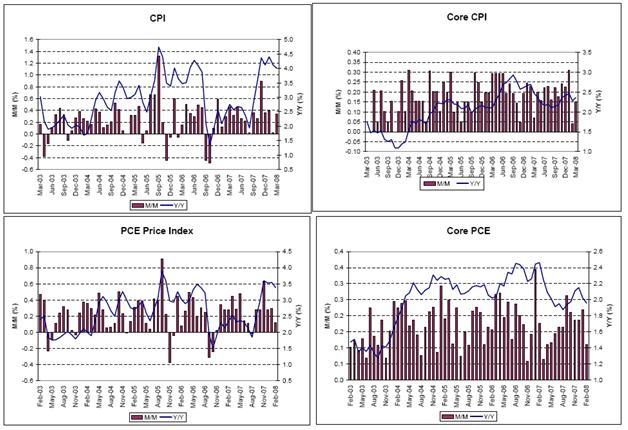
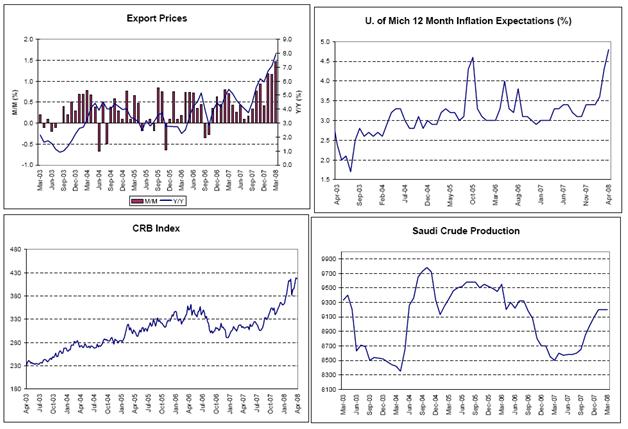
Inflation is ripping, and we will see next week if the Fed finally considers it the greater risk.
Many in the mainstream have thought it the greater risk all along with only the threat of catastrophic systemic deflationary risk due to ‘market functioning’ possibly the greater risk.
With the fear of catastrophic systemic risk fading and the Fed Funds rate below most inflation measures, markets have priced in a higher chance of the Fed not cutting the Fed Funds rate.
Saudi production remains firm at current prices; so, I expect more hikes.
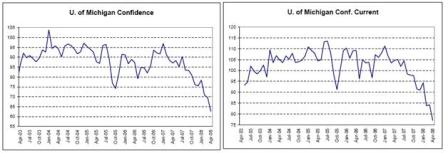
Confidence remains very low, as the realities of an export economy and reduced real terms of trade hurt the lower income groups disproportionately.
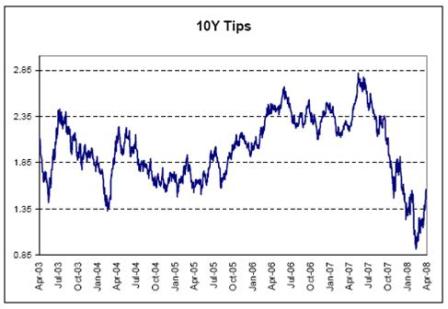
Tips are starting to discount higher real rates from the Fed.
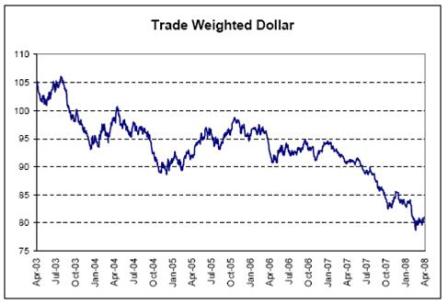
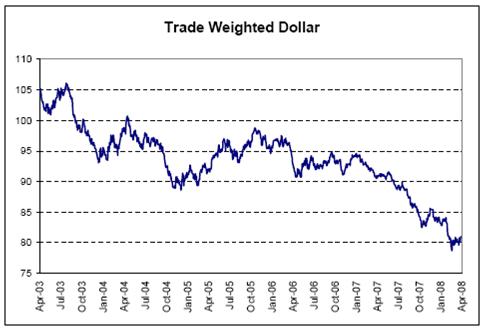
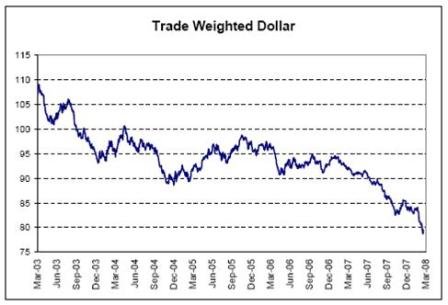
The dollar continues under pressure.
Without the support of the CBs and Monetary authorities, it may continue lower until the US trade gap narrows substantially.
2008-03-21: Valance Chart Review
Twin themes continue: weakness and higher prices.
A substantial pickup in net government spending beginning late Q2 and continued strong exports should keep GDP in positive territory.
Saudis/Russians continue as swing producers and should continue to hike prices.
Pension funds are also continuing to increase allocations to passive commodities and non-US equities.
All the above charts together indicate a continued slowing of demand that took a blip down for the worse right around year end. There are some signs of a small bounce back, but the general downward bias remains.Rent levels for Q1 suggest real GDP growth is near zero, after growth of 0.6% in Q4.
Also, survey results have been known to reflect current psychology rather than actual results.
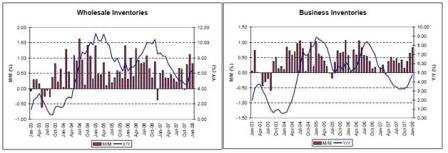
Business inventories have been kept reasonably low (not typical of past recessions).
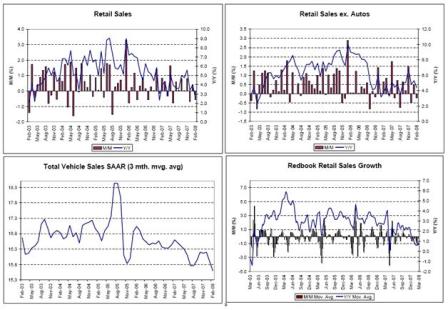
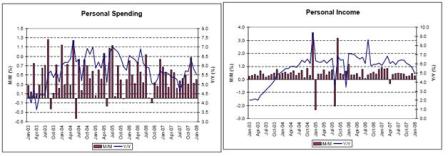
Retail sales have been decelerating over the last several months, though still up year over year.Personal income is a bit softer, though still growing and probably not softening as much as aggregate demand has softened and still sufficient to support nominal spending and nominal GDP growth.
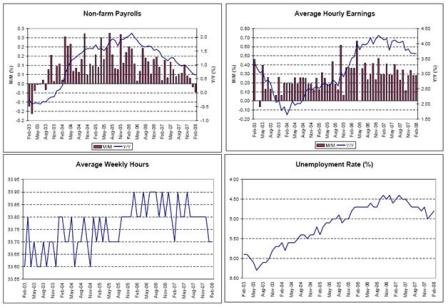
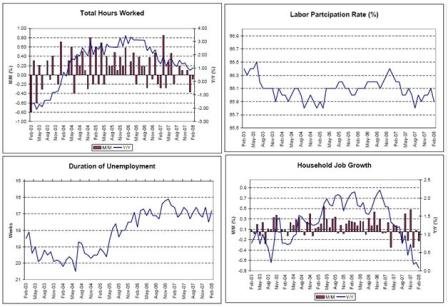
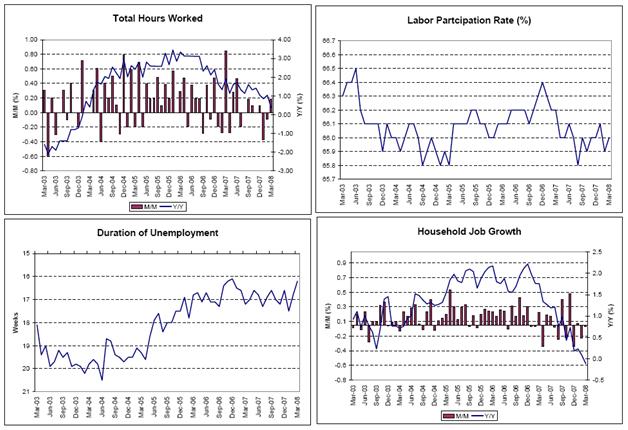
The labor data taken together tells the same story of a gradual decrease in demand since the middle of 2006, but not yet at previous recession levels.Also, the Fed expects the labor force participation rate to drift lower over time due to demographics.
This means employment growth is population limited, which limits non-inflationary GDP growth to something near productivity growth.
Also, the Fed considers 4.75% the non inflationary full employment level.
The current 4.8% unemployment rate is therefore very close to what the Fed considers to be full-employment.
These look reasonably good, especially considering manufacturing has been in decline for a long time.Exports have been picking up the slack in demand from weak housing and weak consumer spending.
Housing has been the largest drag on GDP, subtracting about 1% for the last several quarters.Should it bottom at these historically very low levels it will stop subtracting from demand and begin to make a positive contribution.
I expect net government spending to contribute perhaps an additional 2% to GDP vs 2007. The fiscal package will add about 1%, and it looks like 2007 spending may have been moved forward to 2008 as forecast increases in the deficit project additional net spending of 1%.
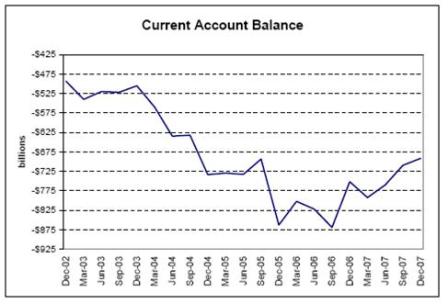
Exports have picked up much of the slack from housing and consumer spending, and look to be further accelerating as non-residents continue to desire to reduce their accumulation of USD financial assets.
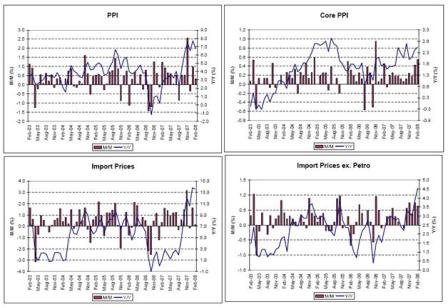
All this is sending prices up to rates not seen since the great inflation of the 1970’s, especially when taking into consideration the changes to measurement of the CPI and other indexes.
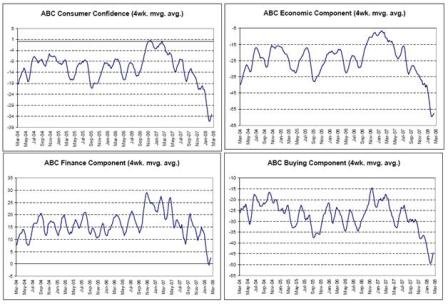
Confidence remains at the lows with a small blip up coinciding with slightly less bearish reporting from CNBC.
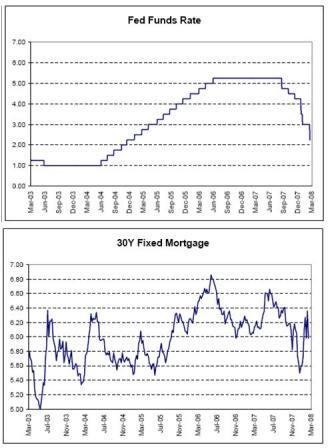
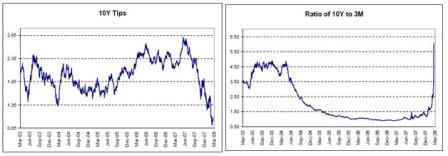
Even as the Fed cuts the Fed Funds rate, mortgage rates remain unchanged, and the yield curve steepens, as markets anticipate higher rates from the Fed down the road when they expect the Fed to turn to fighting inflation.The lower tips rates indicate markets expect the Fed to keep relatively low real rates for quite a while, even when fighting inflation.