- Leading Indicators (Released 10:00 EST)
- Leading Indicators ALLX (Released 10:00 EST)
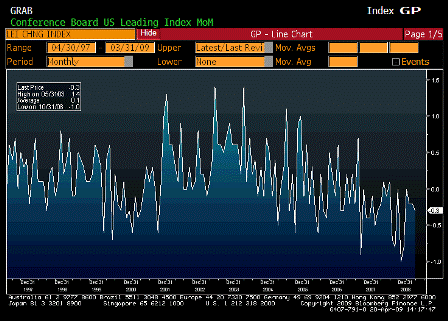
Leading Indicators (Mar)
| Survey | -0.2% |
| Actual | -0.3% |
| Prior | -0.4% |
| Revised | -0.2% |
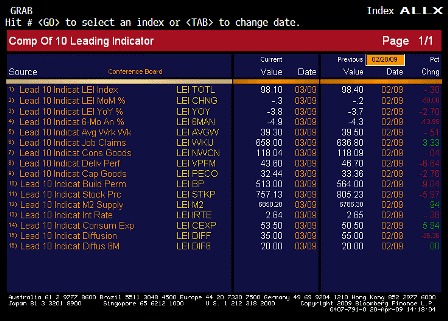
Leading Indicators ALLX (Mar)
[top]


| Survey | -0.2% |
| Actual | -0.3% |
| Prior | -0.4% |
| Revised | -0.2% |

[top]
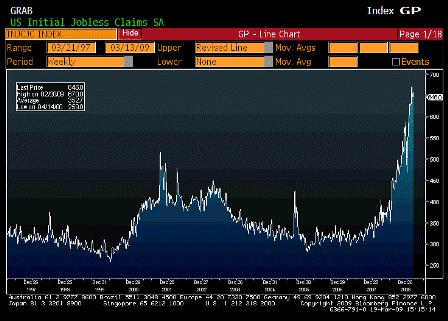
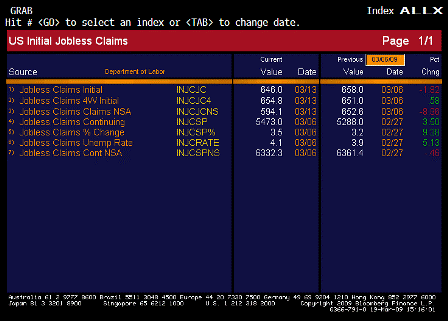
| Survey | 655K |
| Actual | 646K |
| Prior | 654K |
| Revised | 658K |
Karim writes:
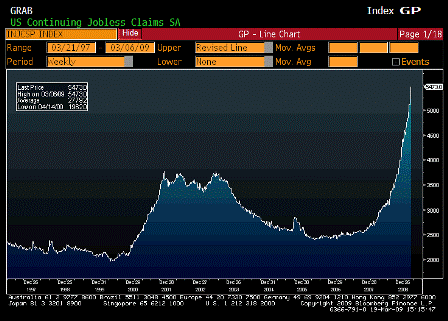
| Survey | 5323K |
| Actual | 5473K |
| Prior | 5317K |
| Revised | 5288K |
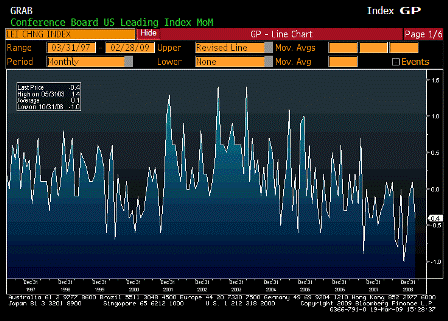
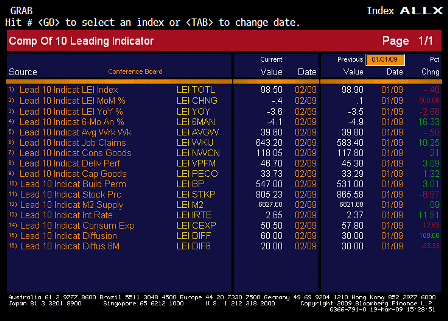
| Survey | -0.6% |
| Actual | -0.4% |
| Prior | 0.4% |
| Revised | 0.1% |
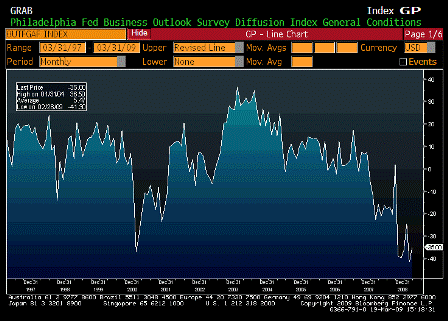
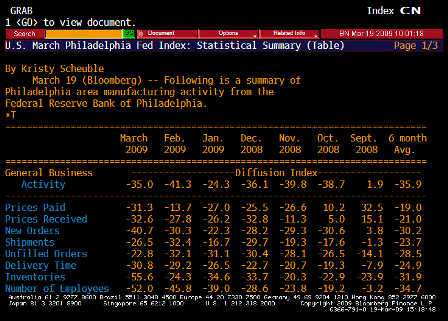
| Survey | -39.0 |
| Actual | -35.0 |
| Prior | -41.3 |
| Revised | n/a |
Karim writes:
[top]
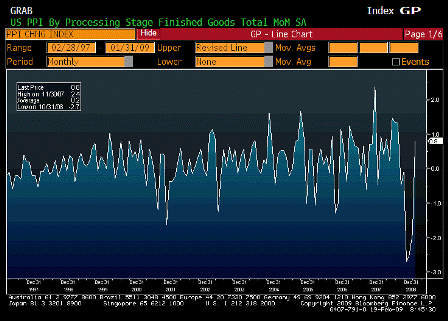
| Survey | 0.3% |
| Actual | 0.8% |
| Prior | -1.9% |
| Revised | n/a |
Karim writes:
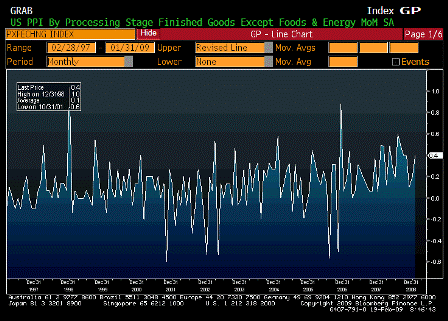
| Survey | 0.1% |
| Actual | 0.4% |
| Prior | 0.2% |
| Revised | n/a |
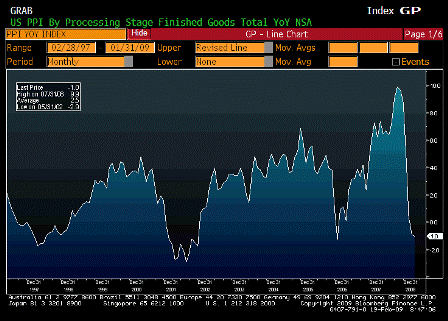
| Survey | -2.4% |
| Actual | -1.0% |
| Prior | -0.9% |
| Revised | n/a |
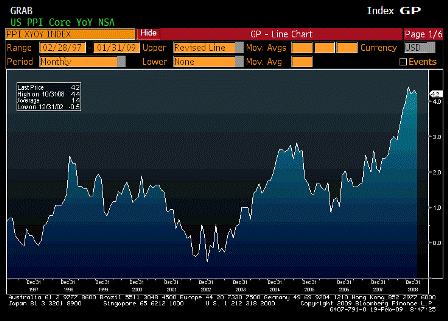
| Survey | 3.8% |
| Actual | 4.2% |
| Prior | 4.3% |
| Revised | n/a |
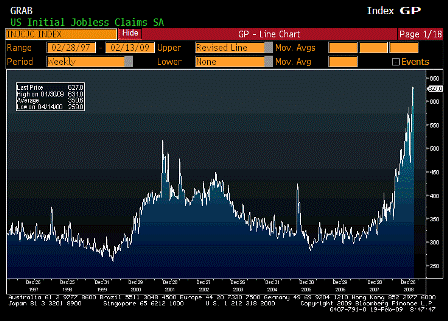
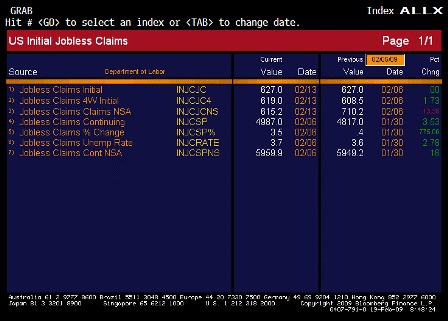
| Survey | 620K |
| Actual | 627K |
| Prior | 623K |
| Revised | 627K |
Karim writes:
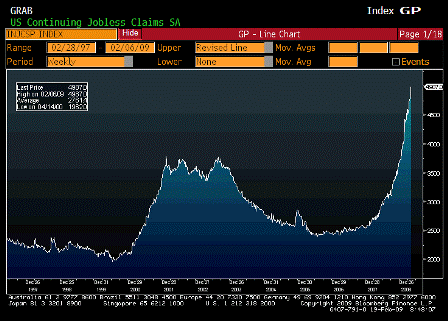
| Survey | 4830K |
| Actual | 4987K |
| Prior | 4810K |
| Revised | 4817K |
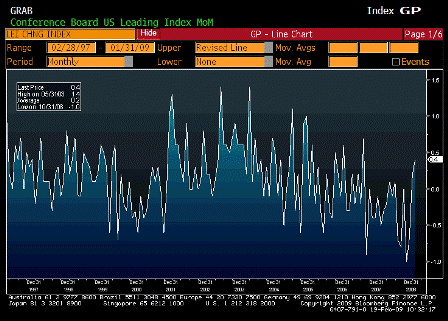
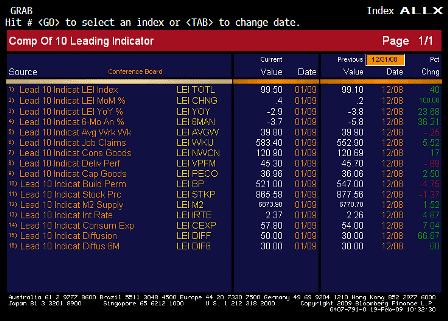
| Survey | 0.1% |
| Actual | 0.4% |
| Prior | 0.3% |
| Revised | 0.2% |
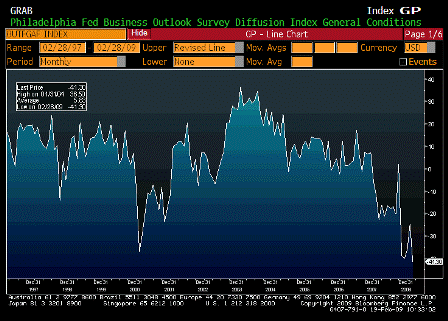
| Survey | -25.0 |
| Actual | -41.3 |
| Prior | -24.3 |
| Revised | n/a |
Karim writes:
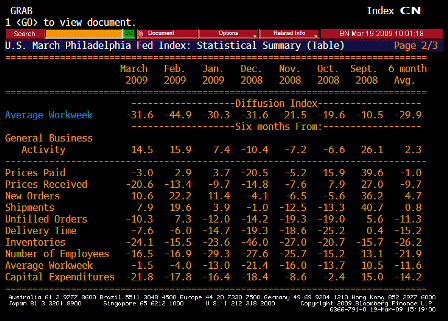
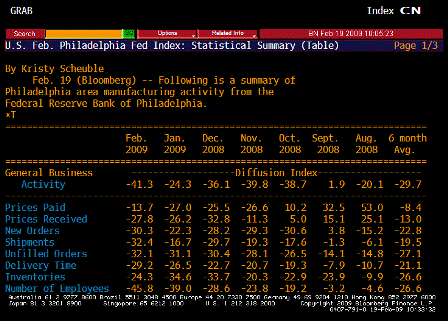
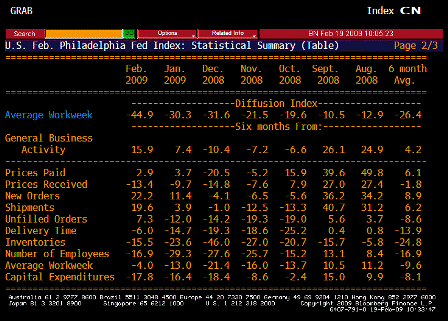
| Feb 2009 | Jan 2009 | Dec 2008 | Nov 2008 | Oct 2008 | Sept 2008 | Aug 2008 | 6 month avg | |
| General Business Activity | -41.3 | -24.3 | -36.1 | -39.8 | -38.7 | 1.9 | -20.1 | -29.7 |
| Prices Paid | -13.7 | -27.0 | -25.5 | -26.6 | 10.2 | 32.5 | 53.0 | -8.4 |
| Prices Received | -27.8 | -26.2 | -32.8 | -11.3 | 5.0 | 15.1 | 25.1 | -13.0 |
| New Orders | -30.3 | -22.3 | -28.2 | -29.3 | -30.6 | 3.8 | -15.2 | -22.8 |
| Shipments | -32.4 | -16.7 | -29.7 | -19.3 | -17.6 | -1.3 | -6.1 | -19.5 |
| # of Employees | -45.8 | -39.0 | -28.6 | -23.8 | -19.2 | -3.2 | -4.6 | -26.6 |
[top]
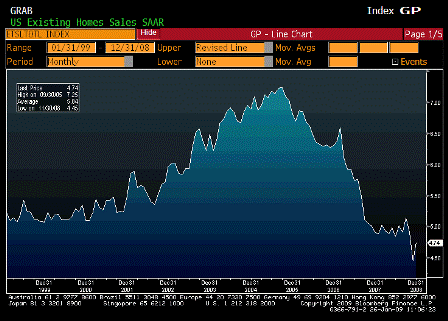
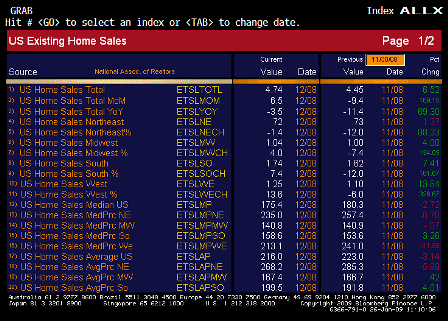
| Survey | 4.40M |
| Actual | 4.74M |
| Prior | 4.49M |
| Revised | 4.45M |
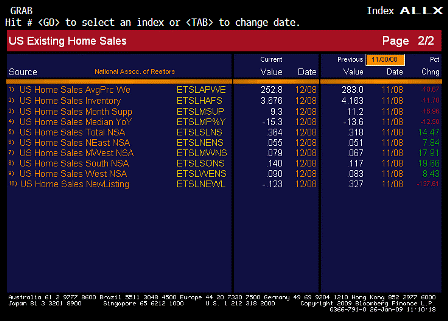
Existing home inventories now being worked off rapidly as foreclosure sales move through the pipeline.
Inventories in general are all very low in absolute terms.
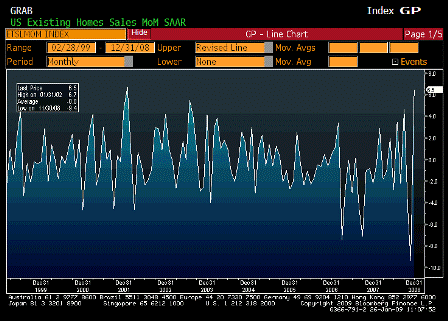
| Survey | -2.0% |
| Actual | 6.5% |
| Prior | -8.6% |
| Revised | 9.4% |
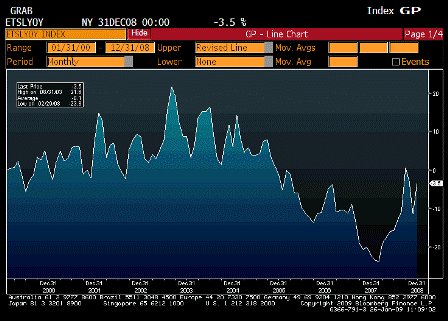
| Survey | n/a |
| Actual | -3.5% |
| Prior | -11.4% |
| Revised | n/a |
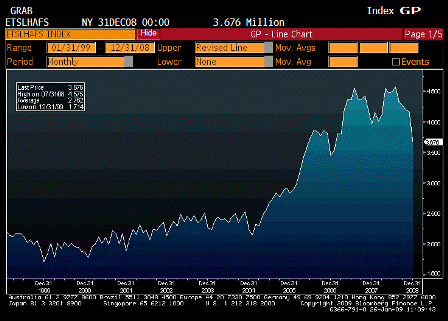
| Survey | n/a |
| Actual | 3.676 |
| Prior | 4.163 |
| Revised | n/a |
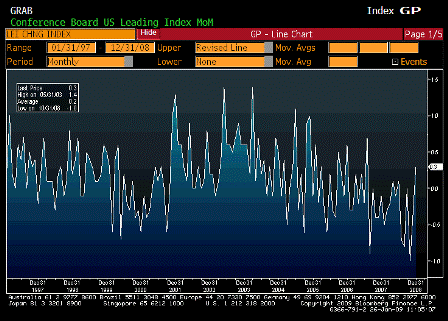
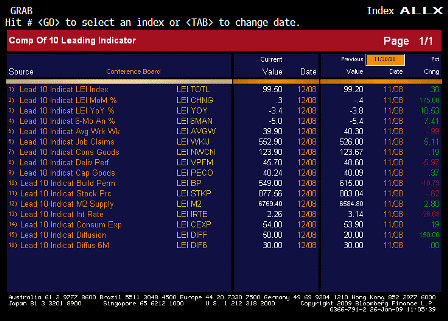
| Survey | -0.2% |
| Actual | 0.3% |
| Prior | -0.4% |
| Revised | n/a |
[top]
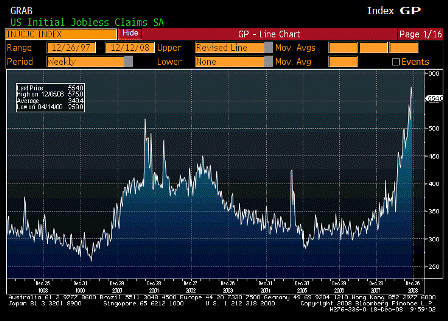
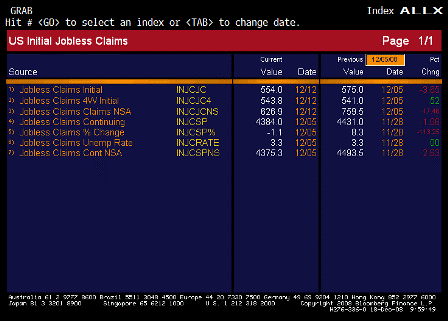
| Survey | 558K |
| Actual | 554K |
| Prior | 573K |
| Revised | 575K |
Down a bit but 4 week average still moving up.
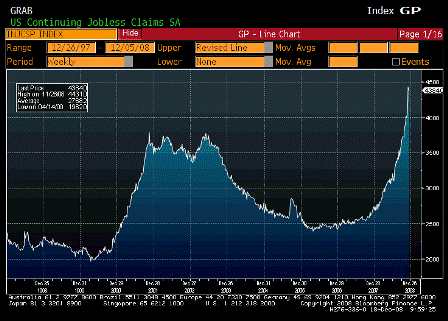
| Survey | 4375K |
| Actual | 4384K |
| Prior | 4429K |
| Revised | 4431K |
Down a touch, but still going parabolic.
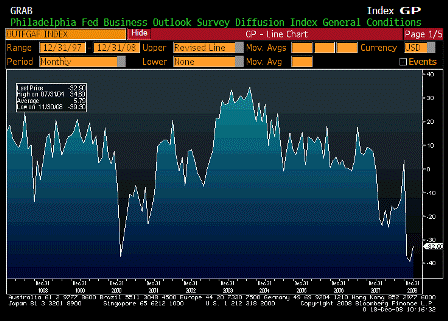
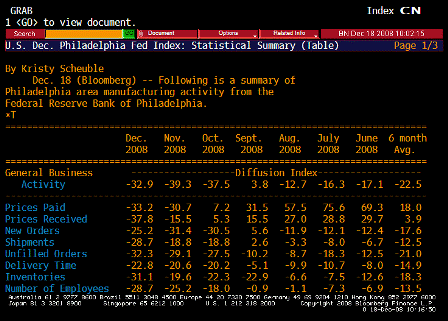
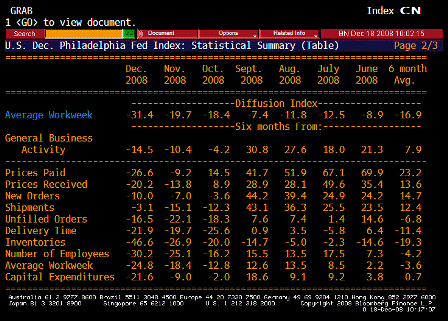
| Survey | -40.5 |
| Actual | -32.9 |
| Prior | -39.3 |
| Revised | n/a |
Better than expected, up a touch, but still at very low levels.
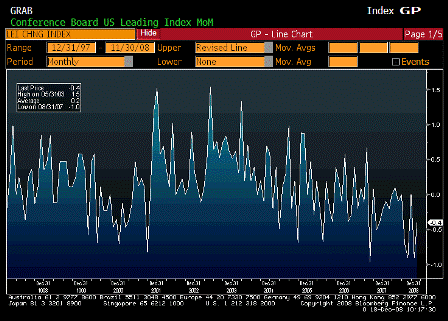
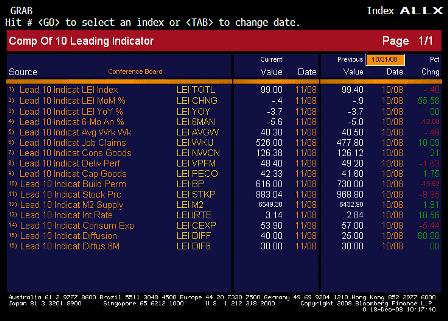
| Survey | -0.4% |
| Actual | -0.4% |
| Prior | -0.8% |
| Revised | -0.9% |
Still looking soft.
[top]
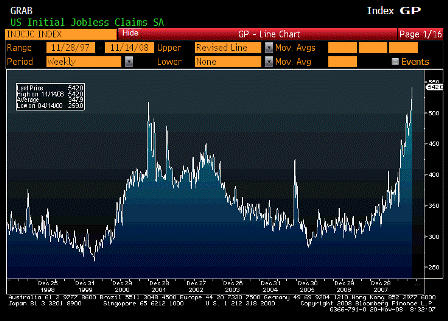
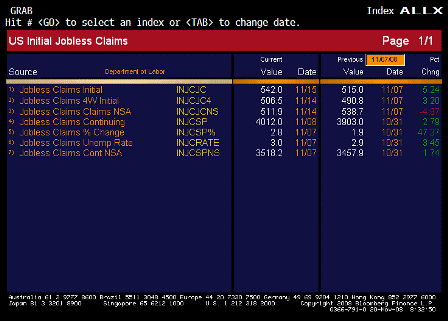
| Survey | 505K |
| Actual | 542K |
| Prior | 516K |
| Revised | 515K |
Bad!
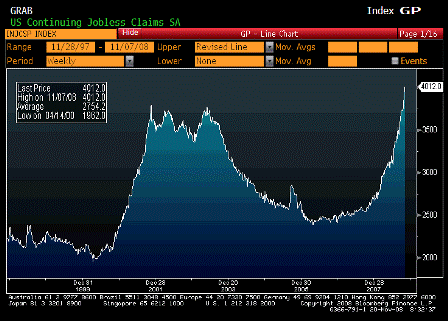
| Survey | 3900K |
| Actual | 4012K |
| Prior | 3897K |
| Revised | 3903K |
Bad!
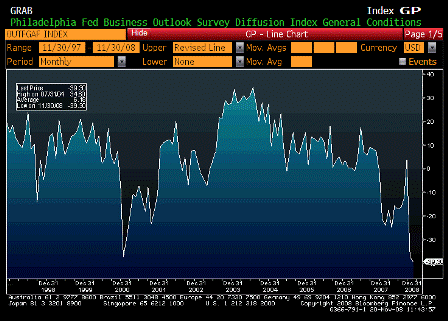
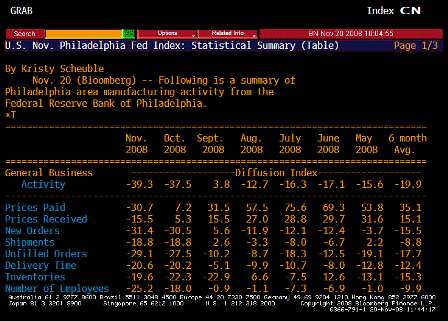
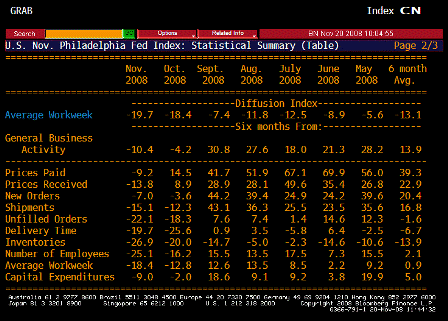
| Survey | -35.0 |
| Actual | -39.3 |
| Prior | -37.5 |
| Revised | n/a |
Deep into recession levels.
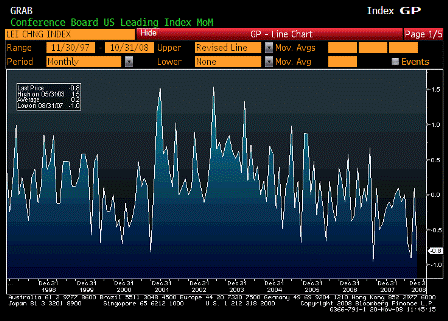
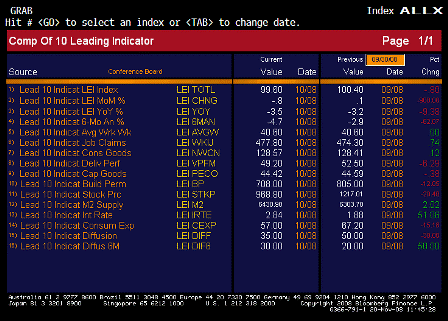
| Survey | -0.6% |
| Actual | -0.8% |
| Prior | 0.3% |
| Revised | 0.1% |
Keeps heading lower.
[top]
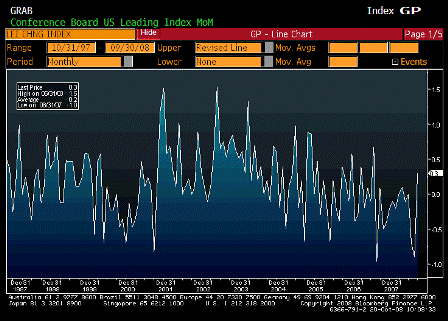
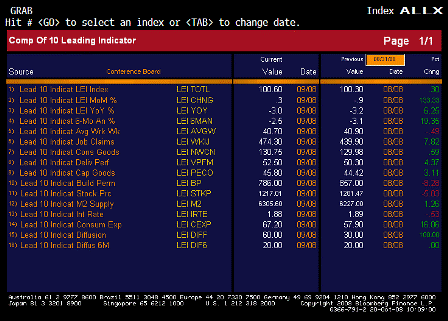
| Survey | -0.1% |
| Actual | 0.3% |
| Prior | -0.5% |
| Revised | -0.9% |
M2 up, yield curve positive, and consumer expectations cause the uptic.
Whatever…
[top]
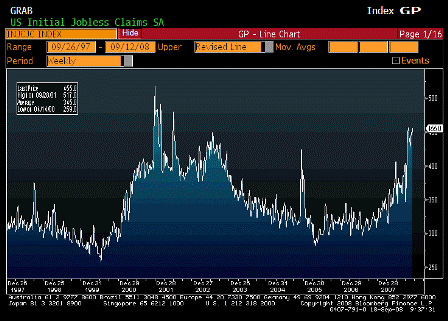
| Survey | 440K |
| Actual | 445K |
| Prior | 445K |
| Revised | n/a |
Staying at the top of the new range since the extended benefit package went into force. And might be a touch high due to the hurricane.
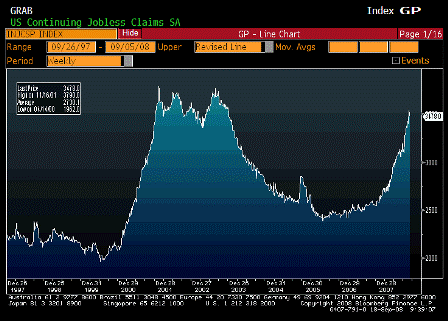
| Survey | 3525K |
| Actual | 3478K |
| Prior | 3525K |
| Revised | 3533K |
Down a bit and better than expected but still on the high side.
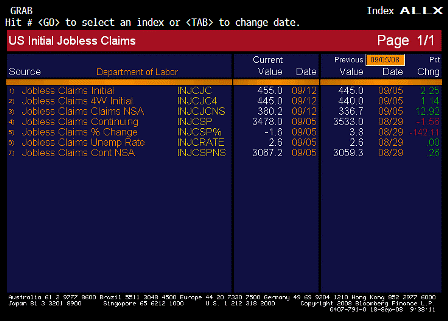
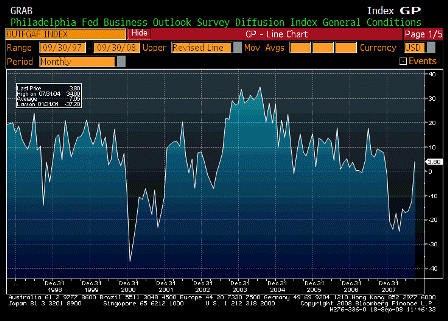
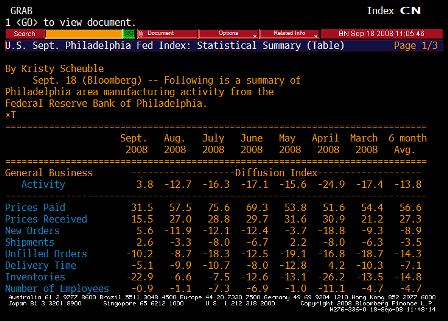
| Survey | -10.0 |
| Actual | 3.8 |
| Prior | -12.7 |
| Revised | n/a |
Back to positive territory with an upside surprise.
| Survey | -0.2% |
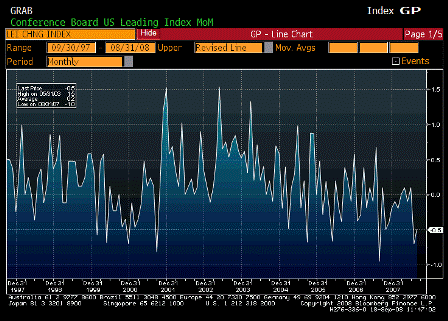
| Actual | -0.5% |
| Prior | -0.7% |
| Revised | n/a |
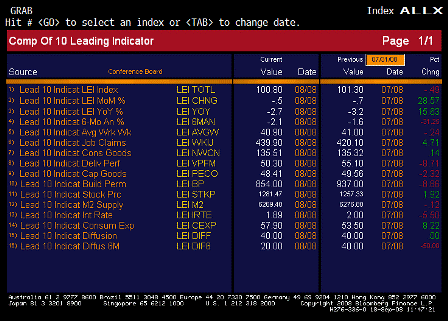
Leading indicators down more than expected. This is largely a financial conditions indicator.
<
Karim writes:
[top]
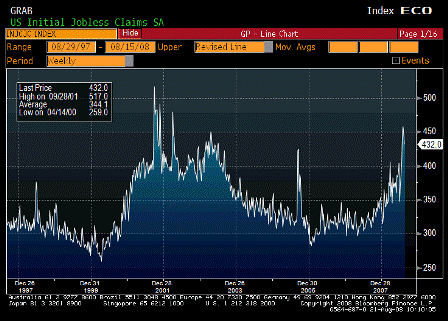
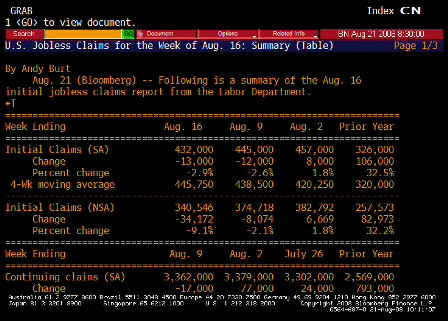
| Survey | 440K |
| Actual | 432K |
| Prior | 450K |
| Revised | 445K |
Still high, even though lower than expected and last week revised down some. It will take a while before the effect of the new extended benefit program is altering the numbers.
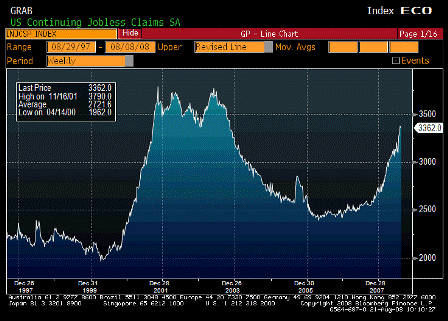
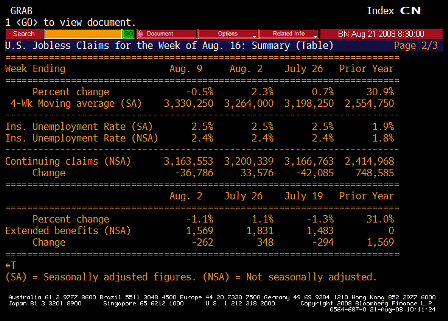
| Survey | 3405K |
| Actual | 3362K |
| Prior | 3417K |
| Revised | 3379K |
Also lower than expected and last week revised down, But still high and not showing any meaningful signs of a top.
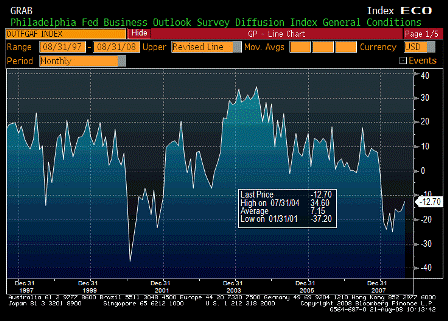
| Survey | -12.6 |
| Actual | -12.7 |
| Prior | -16.3 |
| Revised | n/a |
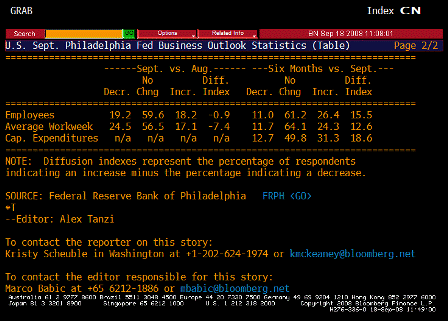
Still negative, but the rate of contraction seems to be declining.
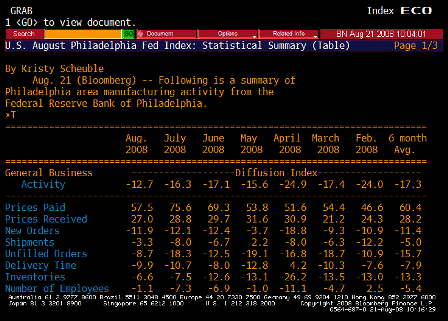
Prices paid down some, but still way high.
Employment improved to near flat.
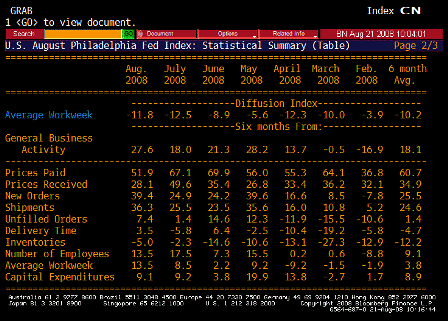
Workweek creeping up some.
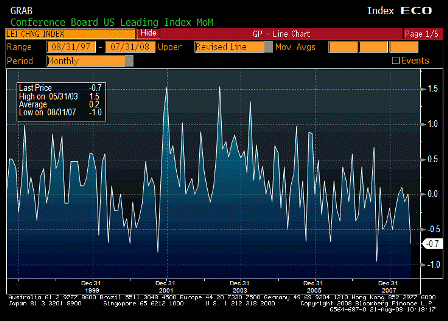
| Survey | -0.2% |
| Actual | -0.7% |
| Prior | -0.1% |
| Revised | 0.0% |
Worse than expected. This is a domestic demand indicator that has been trending down for quite a while.
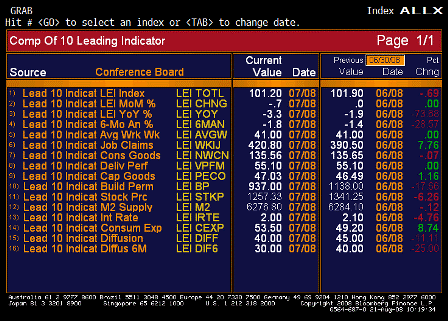
A lot of the specifics seem questionable regarding relevance.
[top]
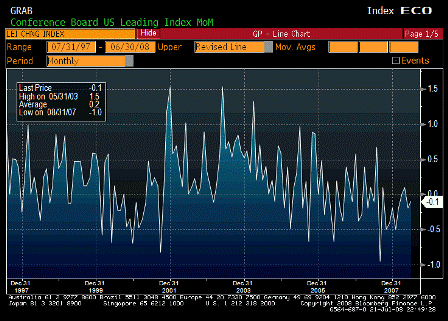
| Survey | -0.1% |
| Actual | -0.1% |
| Prior | 0.1% |
| Revised | -0.2% |
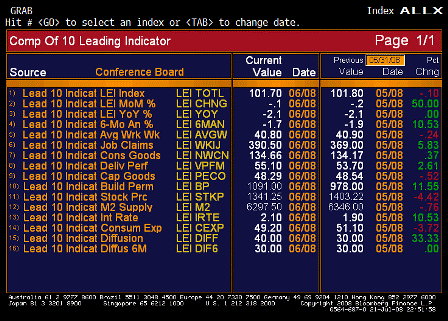
Last month revised down. In line with weak, muddle through growth. The stock market is a big influence on this series.
[top]