2009-01-29 USER


[Skip to the end]


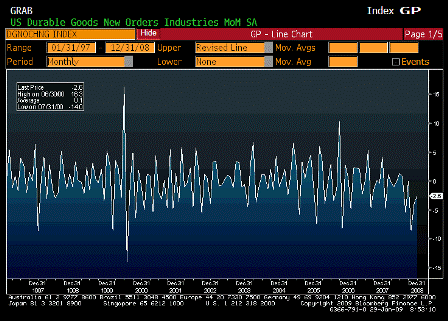
Durable Goods Orders (Dec)

Survey -2.0%
Actual -2.6%
Prior -1.0%
Revised -3.7%

 
Karim writes:

The drumbeat continues:

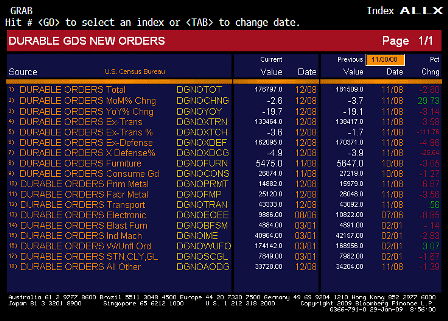
  • Durable good orders down 2.6% in December
  • Ex-aircraft and defense, down 2.8% (and down 32.5% at an annualized rate in Q4)
  • Consensus for Q4 GDP tomorrow is -5.5%; today’s durables data adds downside risk to that estimate and the claims/confidence data indicate that Q1 may well be as weak as Q4.
[top][end]

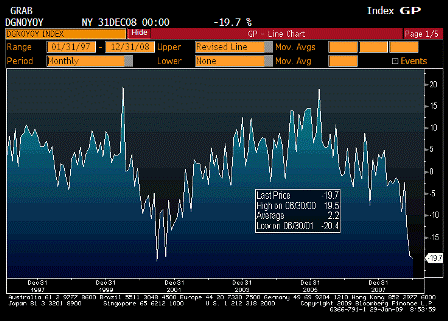
Durable Goods Orders YoY (Dec)

Survey n/a
Actual -19.7%
Prior -19.1%
Revised n/a

[top][end]

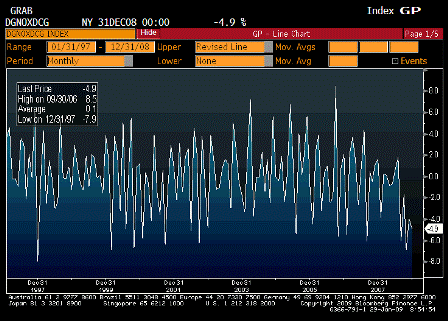
Durables Ex Defense MoM (Dec)

Survey n/a
Actual -4.9%
Prior -3.9%
Revised n/a

[top][end]

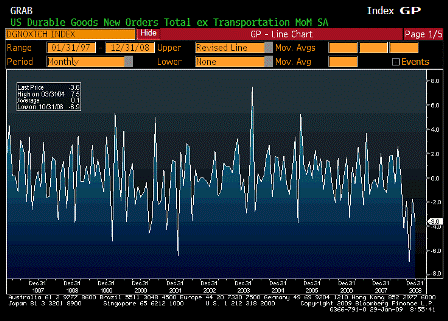
Durables Ex Transportation MoM (Dec)

Survey -2.7%
Actual -3.6%
Prior 1.2%
Revised -1.7%

[top][end]

Durable Goods ALLX (Dec)

[top][end]


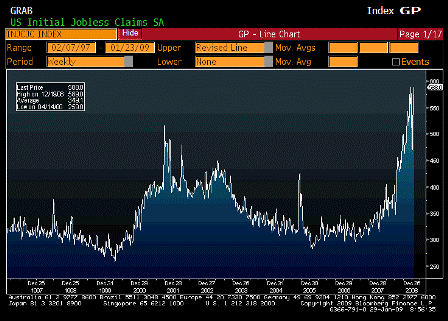
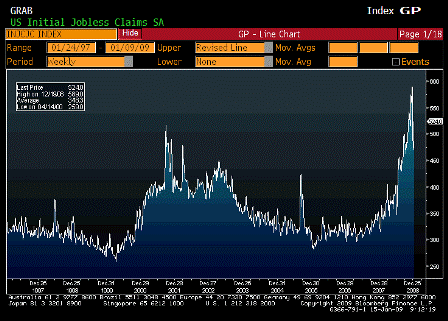
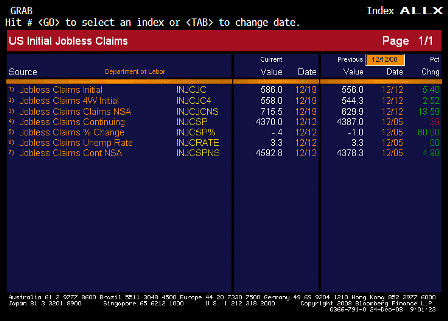
Initial Jobless Claims (Jan 24)

Survey 575K
Actual 588K
Prior 589K
Revised 585K

 
Karim writes:

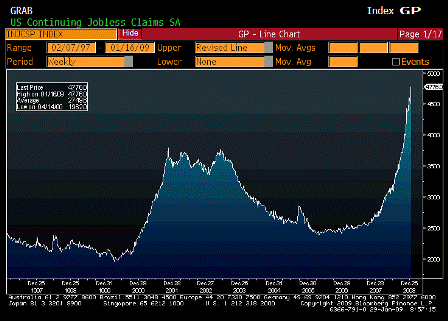
  • Initial claims rise 3k to 588k (4wk avg up to 542k from 518k)
[top][end]

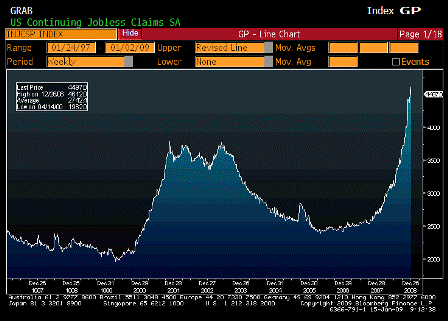
Continuing Claims (Jan 17)

Survey 4620K
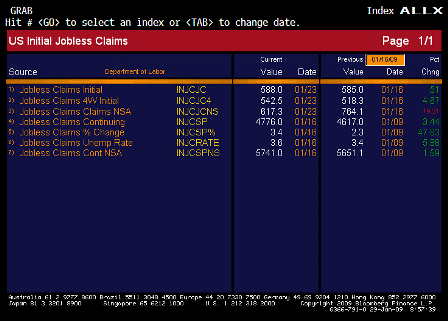
Actual 4776K
Prior 4607K
Revised 4617K

 
Karim writes:

  • Continuing claims rise 159k to 4776k, all-time high in the 41yrs of the claims series
  • Despite the decline in energy prices and publicity surrounding stimulus plan, both ABC and Conference Board surveys made new lows in the past week- reflecting that the labor market is now the key driver of sentiment
[top][end]

Jobless Claims ALLX (Jan 24)

[top][end]


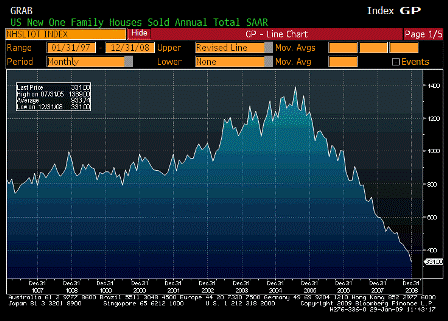
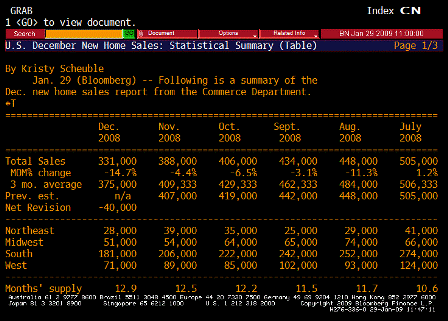
New Home Sales (Dec)

Survey 397K
Actual 331K
Prior 407K
Revised 388K

[top][end]

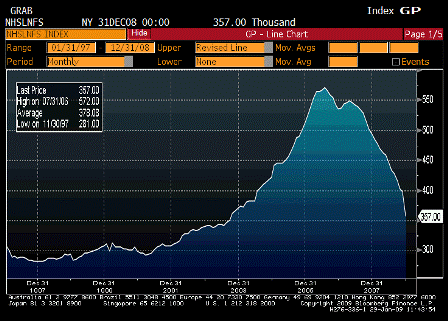
New Home Sales Total for Sale (Dec)

Survey n/a
Actual 357.00
Prior 397.00
Revised n/a

 
This continues to fall rapidly as new construction rates falls way below sales.

In fact, the lack of new home inventory is probably restricting sales.
[top][end]

New Home Sales MoM (Dec)

Survey -2.5%
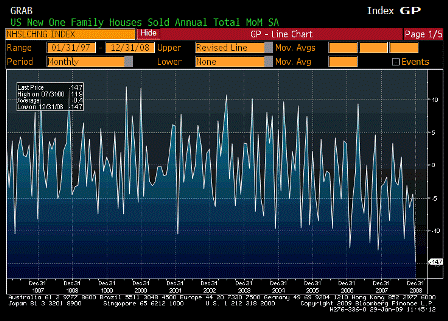
Actual -14.7%
Prior -2.9%
Revised -4.4%

[top][end]

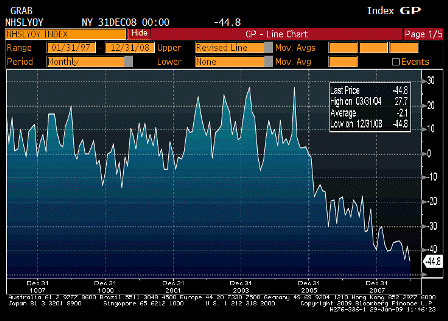
New Home Sales YoY (Dec)

Survey n/a
Actual -44.8%
Prior -38.3%
Revised n/a

[top][end]

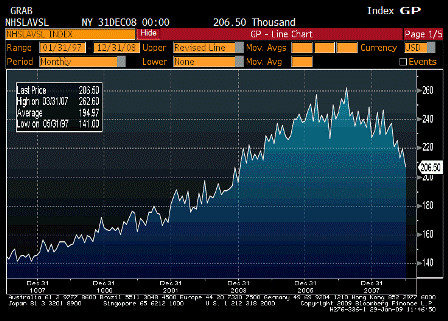
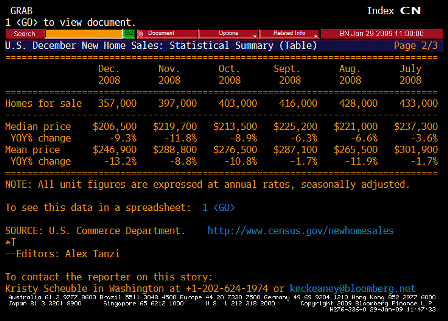
New Home Sales Median Price (Dec)

Survey n/a
Actual 206.50
Prior 219.70
Revised n/a

[top][end]

New Home Sales TABLE 1 (Dec)

[top][end]

New Home Sales TABLE 2 (Dec)


[top]
2009-01-15 USER


[Skip to the end]


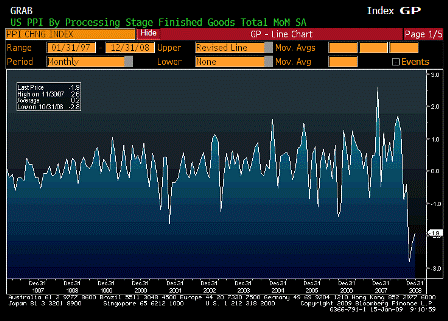
Producer Price Index MoM (Dec)

Survey -2.0%
Actual -1.9%
Prior -2.2%
Revised n/a

[top][end]

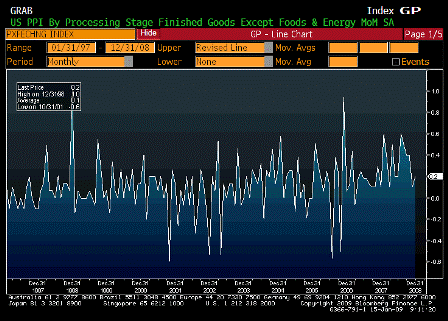
PPI Ex Food and Energy MoM (Dec)

Survey 0.1%
Actual 0.2%
Prior 0.1%
Revised n/a

[top][end]

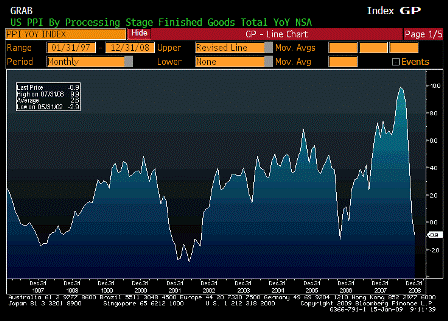
Producer Price Index YoY (Dec)

Survey -1.1%
Actual -0.9%
Prior -0.4%
Revised n/a

[top][end]

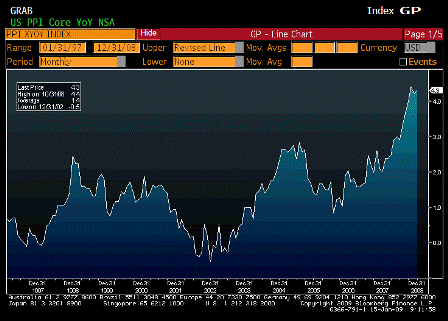
PPI Ex Food and Energy YoY (Dec)

Survey 4.1%
Actual 4.3%
Prior 4.2%
Revised n/a

 
Karim writes:

  • PPI -1.9% m/m and now -0.9% y/y; core +0.2%; consumer goods category -2.6% m/m
  • Pipeline pressures continue to plunge: core intermediate goods -3% m/m and core crude -2.2%
  • Lots of Asian indicators suggesting price pressures will continue to plummet, especially in manufacturing
  • Japan machine tool orders – 72% y/y
  • Taiwan exports -42% y/y
  • Korean GDP -16% annualized in Q4!

[top][end]


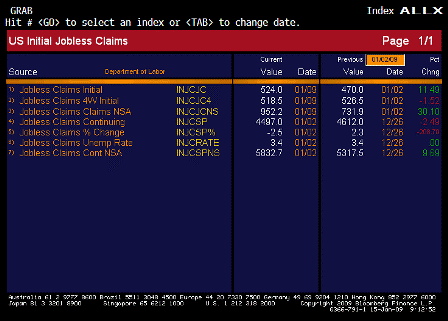
Initial Jobless Claims (Jan 10)

Survey 503K
Actual 524K
Prior 467K
Revised 470K

[top][end]

Continuing Claims (Jan 3)

Survey 4620K
Actual 4497K
Prior 4611K
Revised 4612K

[top][end]

Jobless Claims ALLX (Jan 10)

 
Karim writes:

  • Initial claims up 54k to 524k as number reverts back to pre-holiday levels
  • Continuing claims drop 115k to 4497k; as duration of unemployment lengthens, this number may become more volatile as individuals exhaust their claims (unless benefits are extended, which might happen)

[top][end]


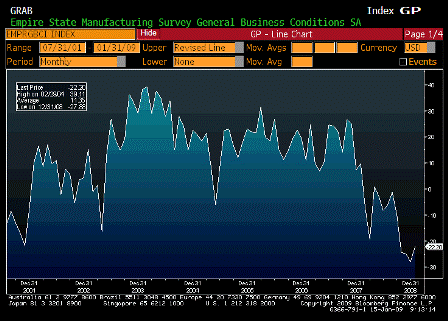
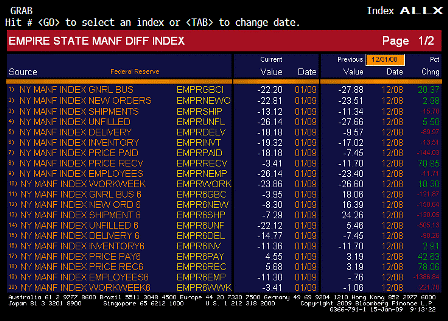
Empire State Manufacturing Survey (Jan)

Survey -25.00
Actual -22.20
Prior -25.76
Revised -27.88

[top][end]

Empire State Manufacturing Survey ALLX 1 (Jan)

[top][end]

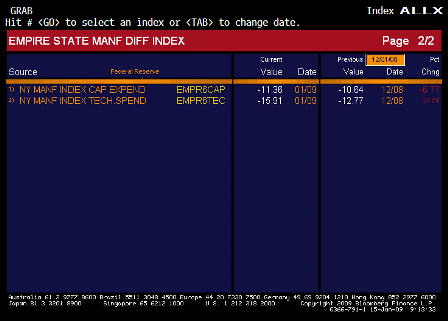
Empire State Manufacturing Survey ALLX 2 (Jan)

[top][end]


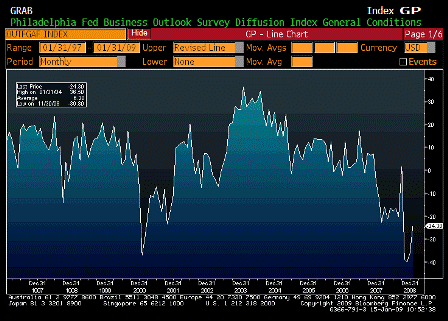
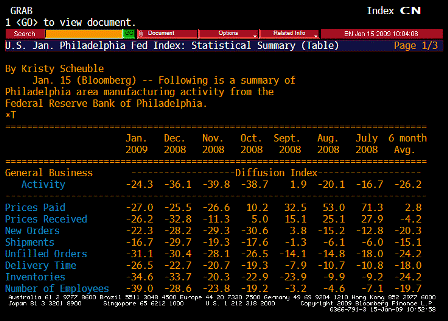
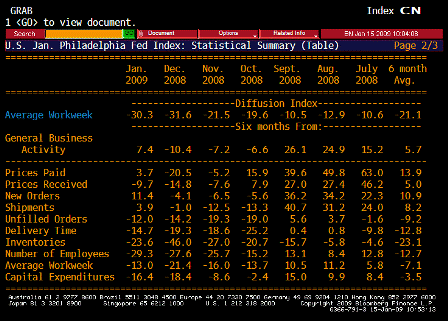
Philadelphia Fed (Jan)

Survey -35.0
Actual -24.3
Prior -32.9
Revised -36.1

 
Karim writes:

  • Philly Fed improves from -36.1 to -24.3, but remains well into contraction territory
  • Employment component falls from -28.6 to -39.1

[top][end]

Philadelphia Fed TABLE 1 (Jan)

[top][end]

Philadelphia Fed TABLE 2 (Jan)


[top]
2008-12-31 USER


[Skip to the end]


Karim writes:

  • The conference board survey of labor conditions (jobs plentiful less jobs hard to get) has been a good leading indicator of payrolls and worsened in December from -28.4 to -35.8.
  • The ABC survey also worsened last week despite the further decline in gas prices, suggesting the labor market continues to deteriorate.

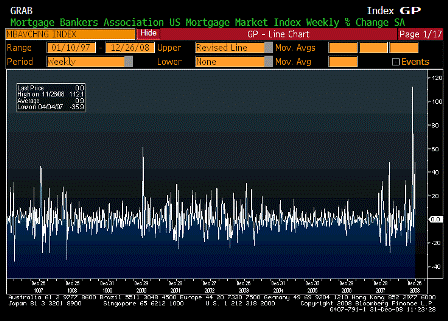
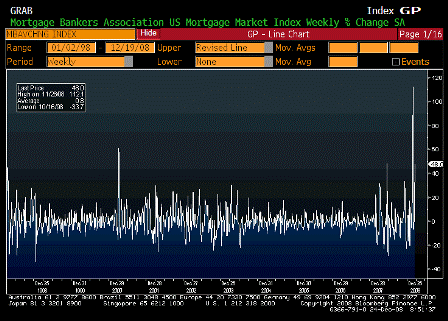
MBA Mortgage Applications (Dec 26)

Survey n/a
Actual 0.0%
Prior 48.0%
Revised n/a

[top][end]

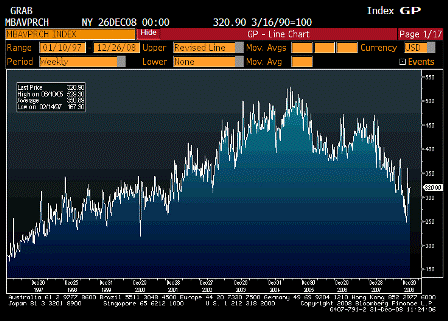
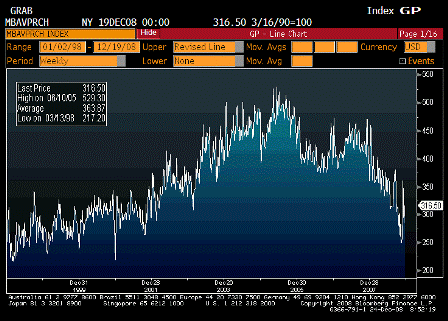
MBA Purchasing Applications (Dec 26)

Survey n/a
Actual 320.90
Prior 316.50
Revised n/a

[top][end]

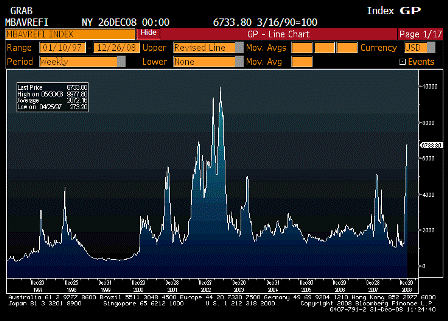
MBA Refinancing Applications (Dec 26)

Survey n/a
Actual 6733.80
Prior 6758.60
Revised n/a

[top][end]

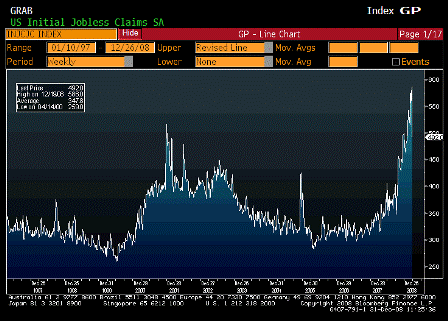
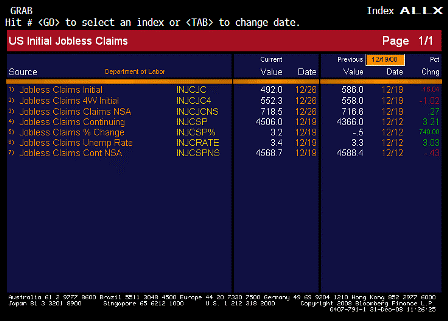
Initial Jobless Claims (Dec 27)

Survey 575K
Actual 492K
Prior 586K
Revised n/a

 
Karim writes:

  • Initial claims fall 94k to 492k but Labor Dept states data probably skewed by holidays and auto shutdowns

[top][end]

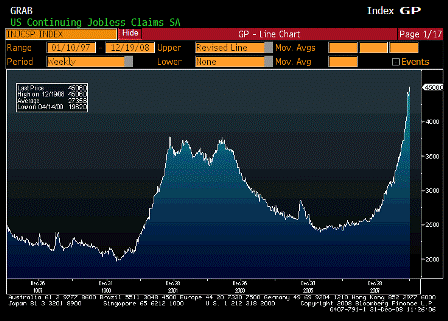
Continuing Claims (Dec 20)

Survey 4400K
Actual 4506K
Prior 4370K
Revised 4366K

 
Karim writes:

  • Continuing claims, reported with a 1 week lag to initial claims, rose 140k to a new cycle high of 4506k.

[top][end]

Jobless Claims ALLX (Dec 27)

 
Karim writes:

  • Would expect payroll decline for December to be larger than last month’s 533k drop (market expects slight improvement to -475k).

[top][end]

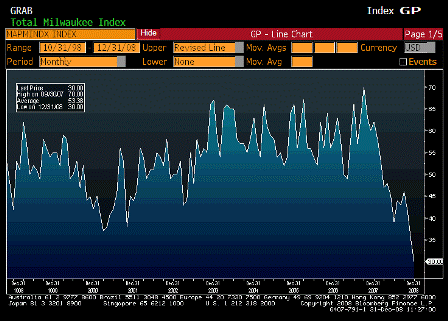
NAPM Milwaukee (Dec)

Survey n/a
Actual 30
Prior 35
Revised n/a


[top]
2008-12-24 USER


[Skip to the end]


MBA Mortgage Applications (Dec 20)

Survey n/a
Actual 48.0%
Prior 2.9%
Revised n/a

[top][end]

MBA Purchasing Applications (Dec 20)

Survey n/a
Actual 316.50
Prior 286.10
Revised n/a

 
Picking up with lower rates.

[top][end]

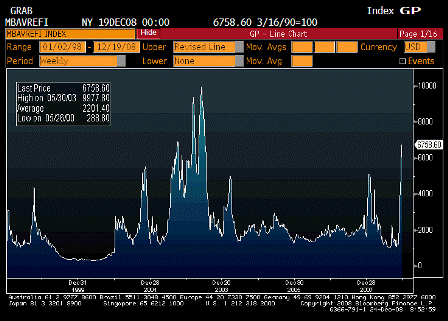
MBA Refinancing Applications (Dec 20)

Survey n/a
Actual 6758.60
Prior 4156.00
Revised n/a

 
Spiking with lower rates.

[top][end]

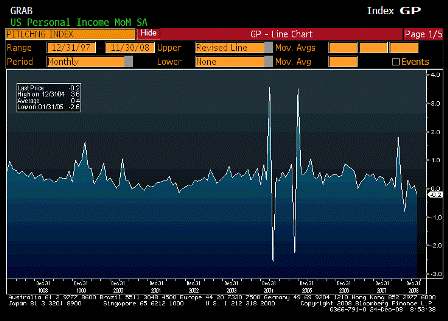
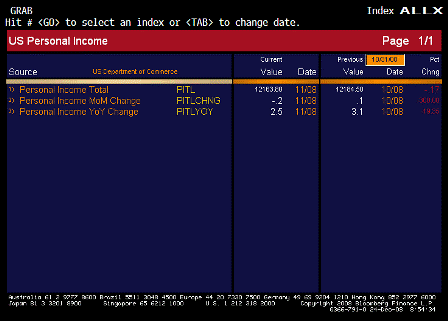
Personal Income MoM (Nov)

Survey 0.0%
Actual -0.2%
Prior 0.3%
Revised 0.1%

 
Lower than expected. Lower interest income continues to bite.

[top][end]

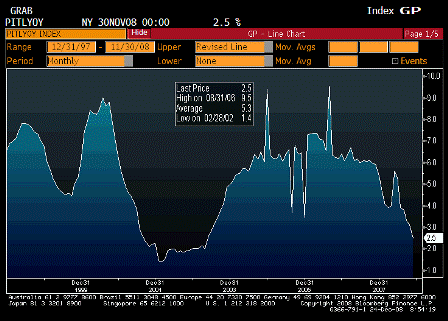
Personal Income YoY (Nov)

Survey n/a
Actual 2.5%
Prior 3.1%
Revised n/a

 
Still up but lower interest income biting.

[top][end]

Personal Income ALLX (Nov)

[top][end]

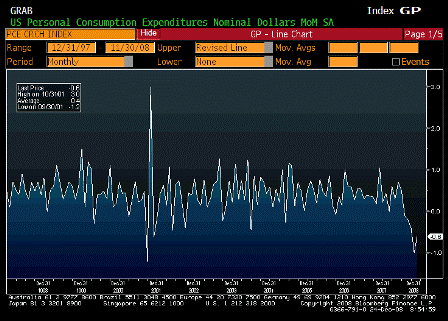
Personal Spending (Nov)

Survey -0.7%
Actual -0.6%
Prior -1.0%
Revised n/a

 
Not good, but lower fuel prices helping other sales.

[top][end]

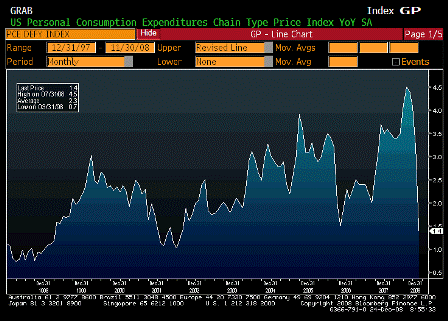
PCE Deflator YoY (Nov)

Survey 1.5%
Actual 1.4%
Prior 3.2%
Revised n/a

 
Way down with the big drop in fuel costs.

[top][end]

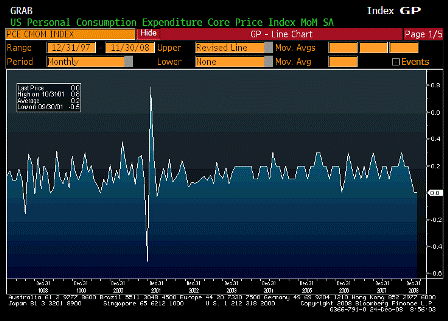
PCE Core MoM (Nov)

Survey 0.0%
Actual 0.0%
Prior 0.0%
Revised n/a

[top][end]

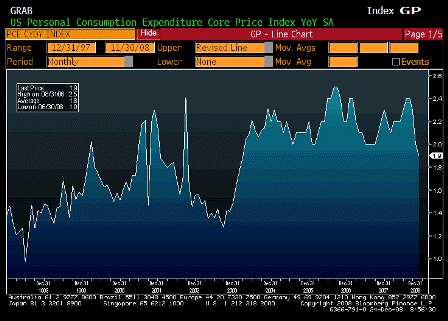
PCE Core YoY (Nov)

Survey 2.0%
Actual 1.9%
Prior 2.1%
Revised 2.0%

 
Back in the Fed’s comfort zone.

[top][end]

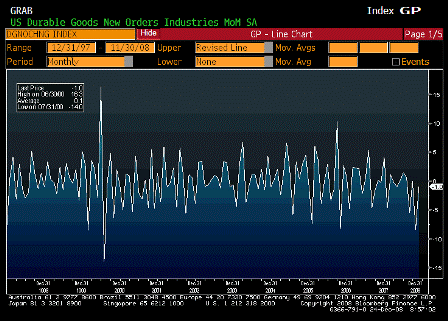
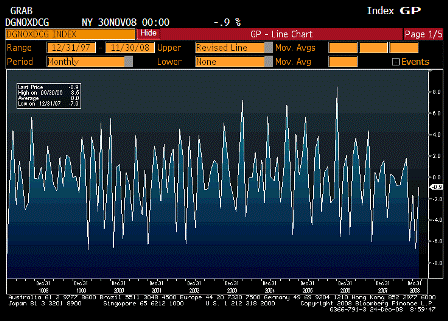
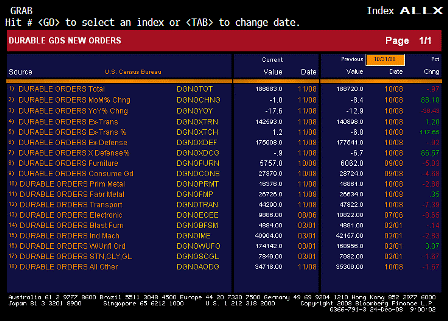
Durable Goods Orders (Nov)

Survey -3.0%
Actual -1.0%
Prior -6.2%
Revised -8.4%

 
A little better than expected but still in decline.

[top][end]

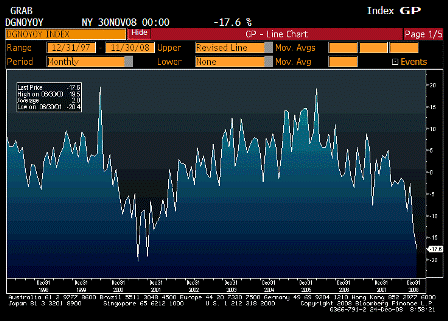
Durable Goods Orders YoY (Nov)

Survey n/a
Actual -17.6%
Prior -12.9%
Revised n/a

 
Big drop.

[top][end]

Durables Ex Defense MoM (Nov)

Survey n/a
Actual -0.9%
Prior -6.7%
Revised n/a

[top][end]

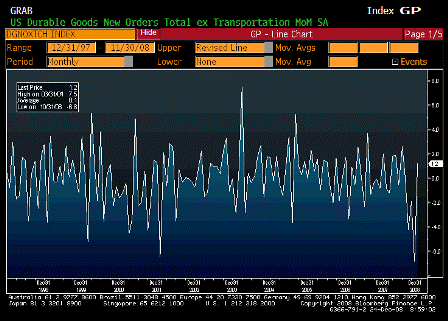
Durables Ex Transportation MoM (Nov)

Survey -3.0%
Actual 1.2%
Prior -4.4%
Revised -6.8%

 
Bit of a blip up but nothing serious as prior revised lower.

[top][end]

Durable Goods ALLX (Nov)

[top][end]

Initial Jobless Claims (Dec 20)

Survey 558K
Actual 586K
Prior 554K
Revised 556K

 
May get a lot worse after the holidays.

[top][end]

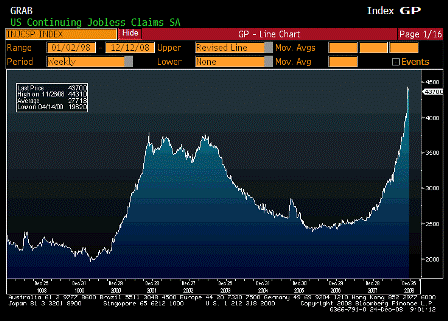
Continuing Claims (Dec 13)

Survey 4410K
Actual 4370K
Prior 4384K
Revised 4387K

 
Likely to move up after the holidays.

[top][end]

Jobless Claims ALLX (Dec 20)


[top]
2008-11-20 USER


[Skip to the end]


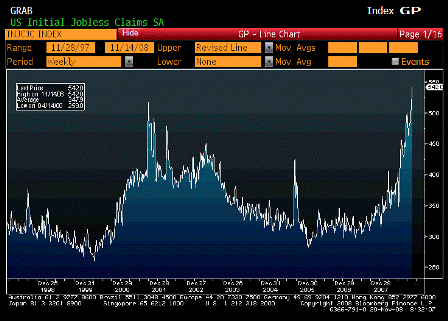
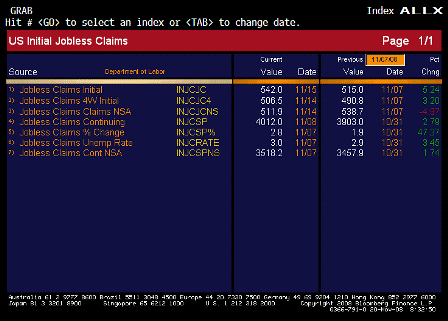
Initial Jobless Claims (Nov 15)

Survey 505K
Actual 542K
Prior 516K
Revised 515K

 
Bad!

[top][end]

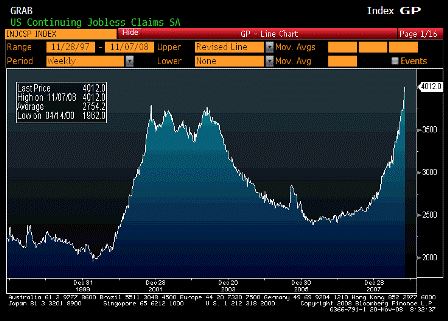
Continuing Claims (Nov 8)

Survey 3900K
Actual 4012K
Prior 3897K
Revised 3903K

 
Bad!

[top][end]

Jobless Claims ALLX (Nov 15)

[top][end]


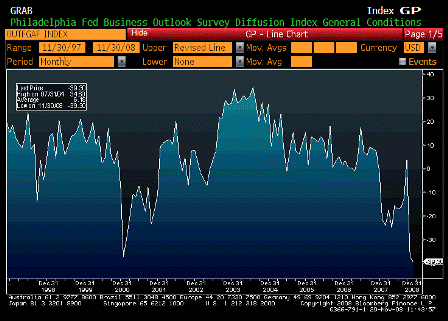
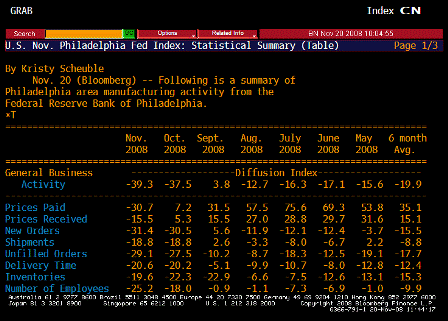
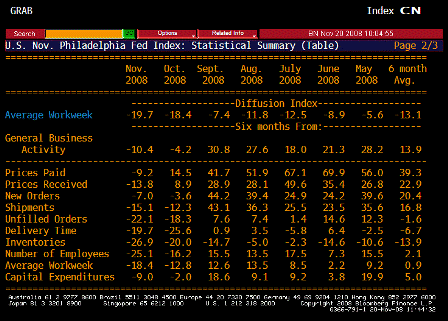
Philadelphia Fed (Nov)

Survey -35.0
Actual -39.3
Prior -37.5
Revised n/a

 
Deep into recession levels.

[top][end]

Philadelphia Fed TABLE 1 (Nov)

[top][end]

Philadelphia Fed TABLE 2 (Nov)

[top][end]


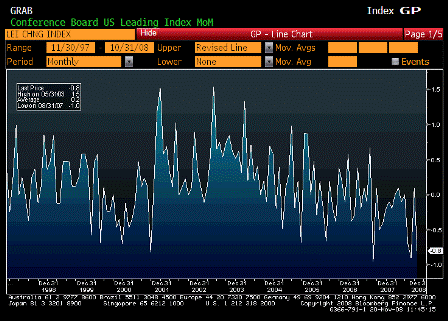
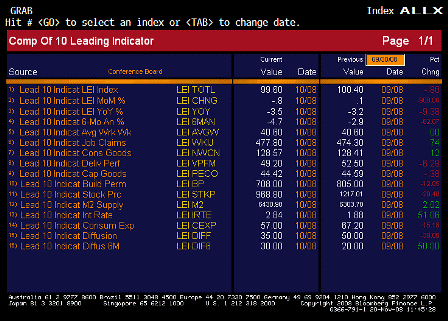
Leading Indicators (Oct)

Survey -0.6%
Actual -0.8%
Prior 0.3%
Revised 0.1%

 
Keeps heading lower.

[top][end]

Leading Indicators ALLX (Oct)


[top]
2008-11-13 USER


[Skip to the end]


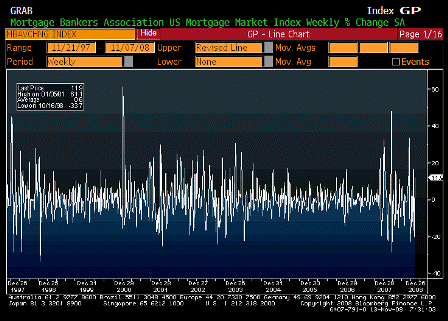
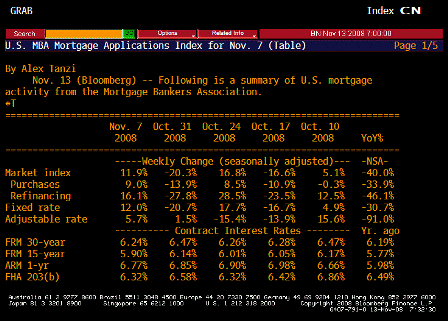
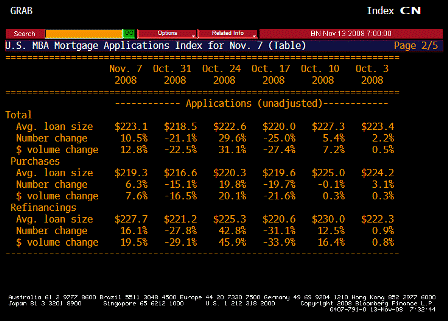
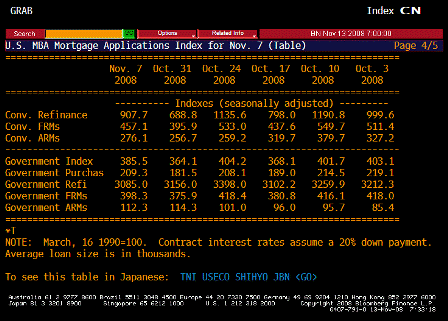
MBA Mortgage Applications (Nov 7)

Survey n/a
Actual 11.9%
Prior -20.3%
Revised n/a

[top][end]

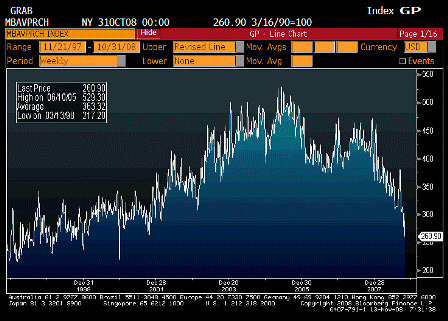
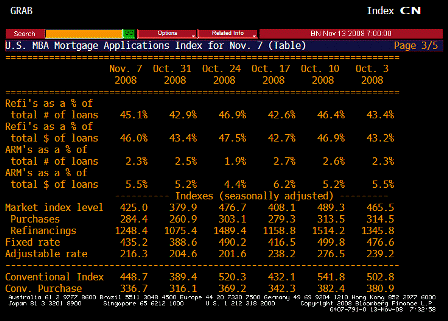
MBA Purchasing Applications (Nov 7)

Survey n/a
Actual 260.90
Prior 303.10
Revised n/a

 
Up some, but still very low.

[top][end]

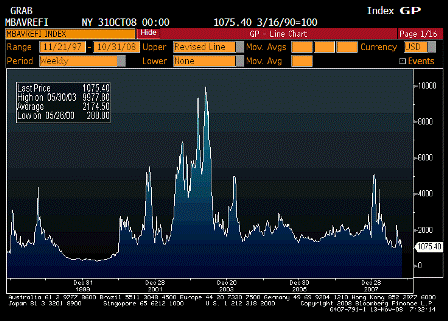
MBA Refinancing Applications (Nov 7)

Survey n/a
Actual 1075.40
Prior 1489.40
Revised n/a

[top][end]

MBA TABLE 1 (Nov 7)

[top][end]

MBA TABLE 2 (Nov 7)

[top][end]

MBA TABLE 3 (Nov 7)

[top][end]

MBA TABLE 4 (Nov 7)

[top][end]

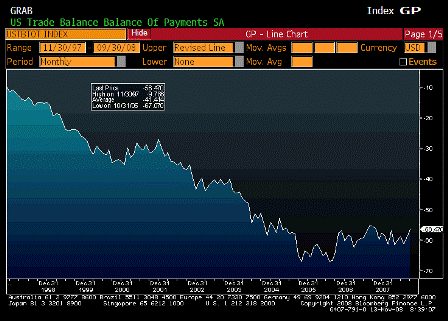
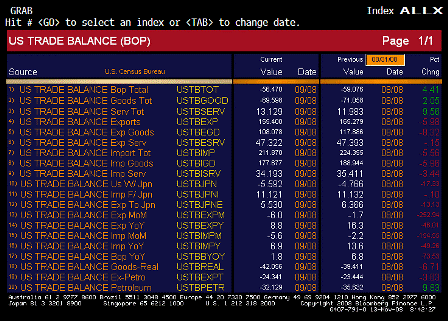
Trade Balance (Sep)

Survey -$57.0B
Actual -$56.5B
Prior -$59.1B
Revised n/a

 
Slowly falling as crude prices came down.

Karim writes:

  • Trade deficit improves from -59.1bn to -56.5 bn,
  • BUT, real trade balance actually worsened by about 3bn due to underlying price moves (so negative impact on real GDP)
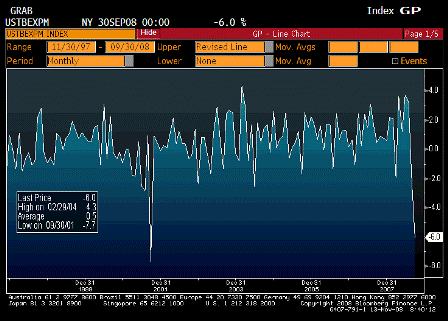
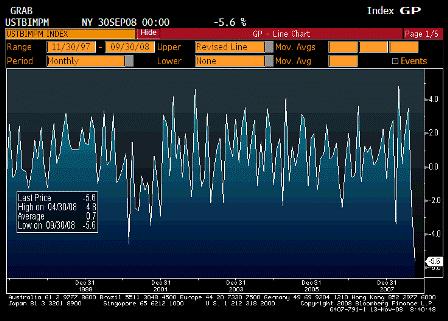
  • Also, exports down 6% m/m and imports down 5.6% m/m

[top][end]

Exports MoM (Sep 8)

Survey n/a
Actual -6.0%
Prior -1.7%
Revised n/a

 
Exports and imports (below) down as world economy slows.

[top][end]

Imports MoM (Sep 8)

Survey n/a
Actual -5.6%
Prior -2.2%
Revised n/a

[top][end]

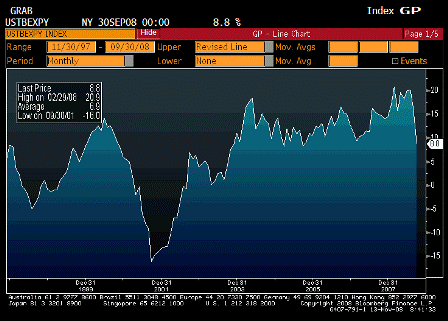
Exports YoY (Sep 8)

Survey n/a
Actual 8.8%
Prior 16.3%
Revised n/a

 
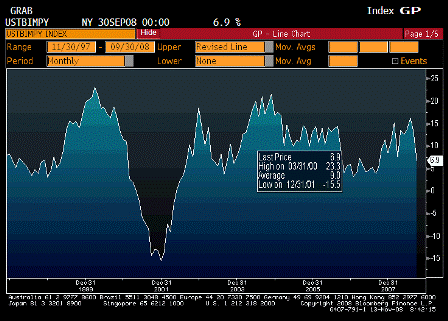
Exports and imports (below) still up year over year but probably not for long.

[top][end]

Imports YoY (Sep 8)

Survey n/a
Actual 6.9%
Prior 13.6%
Revised n/a

[top][end]

Trade Balance ALLX (Sep)

[top][end]

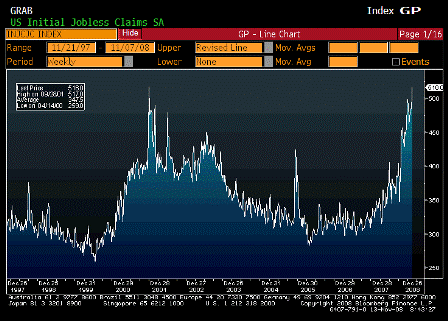
Initial Jobless Claims (Nov 8)

Survey 480K
Actual 516K
Prior 481K
Revised 484K

 
In to recession territory as expected.

Karim writes:

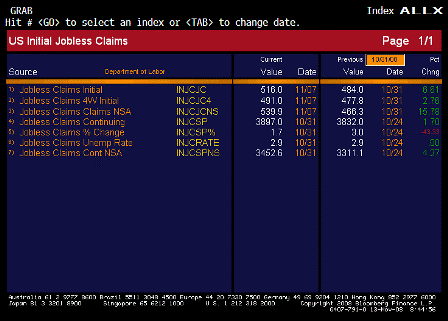
These are truly awful numbers

  • Initial claims rise from 484k (revised up from 480k) to new cycle high of 516k
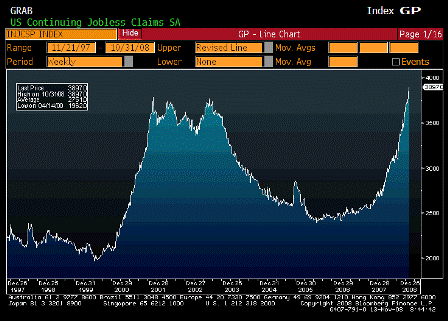
  • Continuing claims rise from 3832k (revised down from 3843k) to new cycle high of 3897k
  • These reflect step-up in layoffs and continued lack of hiring

[top][end]

Continuing Claims (Nov 1)

Survey 3825K
Actual 3897K
Prior 3843K
Revised 3832K

 
Moving into recession levels as expected.

[top][end]

Jobless Claims ALLX (Nov 8)


[top]
2008-10-30 USER


[Skip to the end]


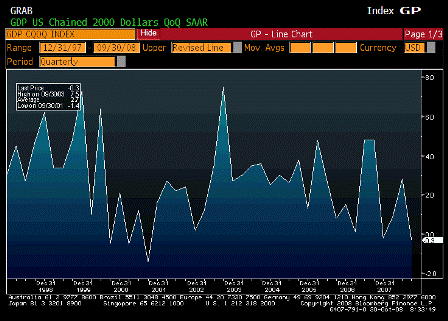
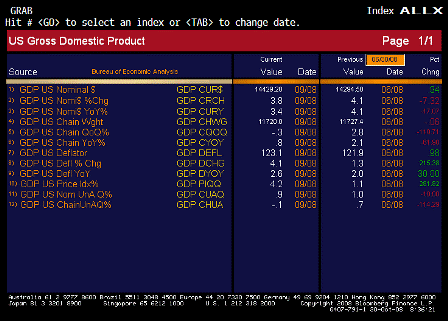
GDP QoQ Annualized (3Q A)

Survey -0.5%
Actual -0.3%
Prior 2.8%
Revised n/a

 
A bit better than exected, and longer term the chart shows gradual declining rates of growth of GDP.

Karim writes:

  • GDP weak across the board
  • Economy contracts at 0.3% annualized rate in Q3
  • Sector changes (all annualized)
  • Personal consumption -3.1%
  • Non residential investment -1%
  • Residential investment (housing) -19.1%
  • Exports 5.9% (from 12.3%)
  • Government 5.8%

Government spending to keep the numbers from being a lot worse.

[top][end]

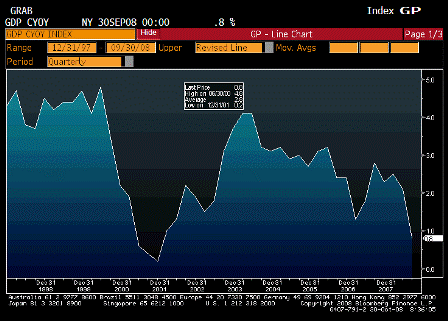
GDP YoY Annualized Real (3Q A)

Survey n/a
Actual 0.8%
Prior 2.1%
Revised n/a

 
Same, been trending down for quite a while.

[top][end]

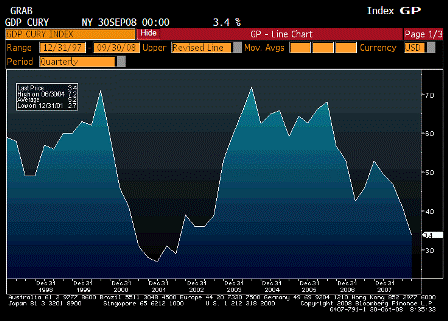
GDP YoY Annualized Nominal (3Q A)

Survey n/a
Actual 3.4%
Prior 4.1%
Revised n/a

 
Nominal is sagging as well, indicating weakening nominal demand.

[top][end]

GDP Price Index (3Q A)

Survey 4.0%
Actual 4.2%
Prior 1.1%
Revised n/a

 
Higher than expected, but of no concern to a ‘forward looking’ Fed.

[top][end]

GDP ALLX (3Q A)

[top][end]

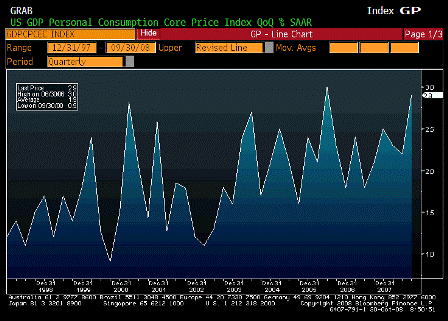
Core PCE QoQ (3Q A)

Survey 2.5%
Actual 2.9%
Prior 2.2%
Revised n/a

 
Core continues to march higher, and unless crude prices stay at the lows this can continue for several quarters.

[top][end]


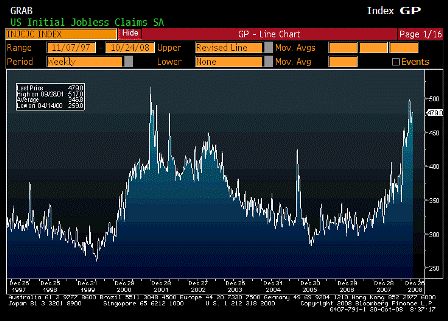
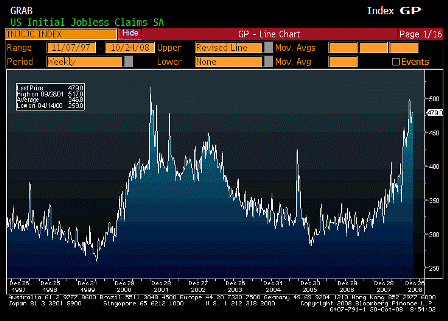
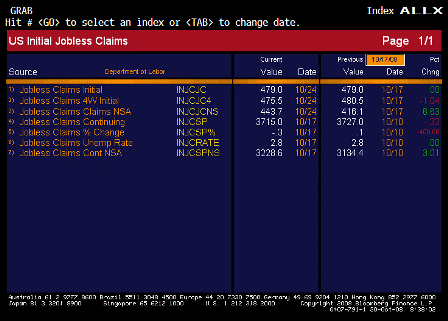
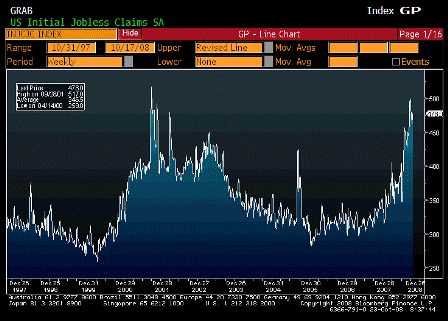
Initial Jobless Claims (Oct 25)

Survey 475K
Actual 479K
Prior 478K
Revised 479K

 
Still looks to be moving up.

Karim writes:

  • Initial unchanged at 479k but no hurricane effects so underlying trend weaker by about 12-15k
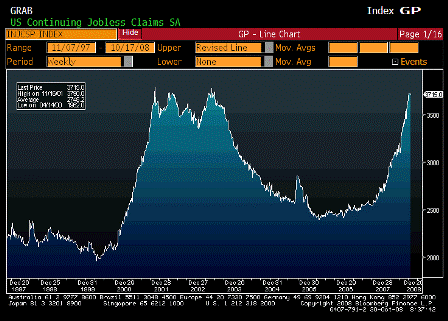
  • Continuing claims drop 12k from upwardly revised 3727k to 3715k
  • Looks like -250 to -300k on next payrolls.

[top][end]

Continuing Claims (Oct 18)

Survey 3735K
Actual 3715K
Prior 3720K
Revised 3727K

 
Near previous peaks, remains high.

[top][end]

Jobless Claims ALLX (Oct 25)


[top]
2008-10-23 USER


[Skip to the end]
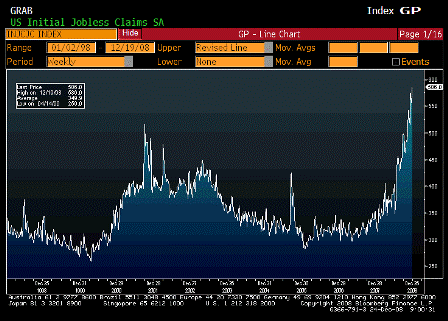

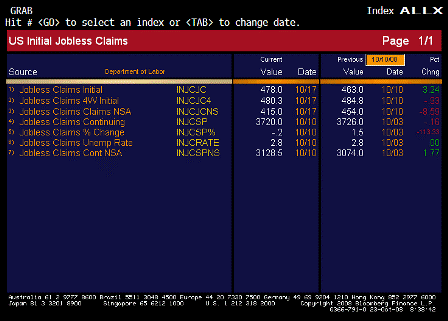
Initial Jobless Claims (Oct 18)

Survey 468K
Actual 478K
Prior 461K
Revised 463K

 
Hurricane added 12,000. Based on other economic stats and surveys this could get a lot worse.

[top][end]

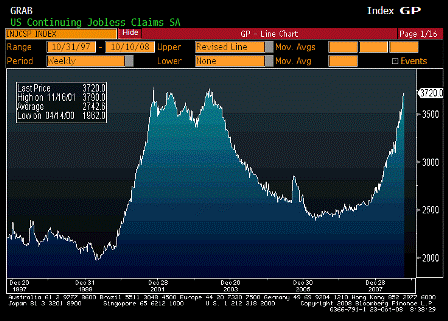
Continuing Claims (Oct 11)

Survey 3715K
Actual 3720K
Prior 3711K
Revised 3726K

 
A slight pullback. This is getting into recession levels.

[top][end]

Jobless Claims ALLX (Oct 18)

[top][end]


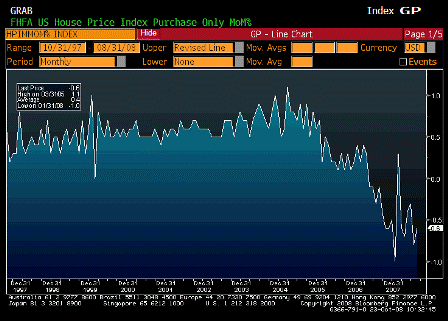
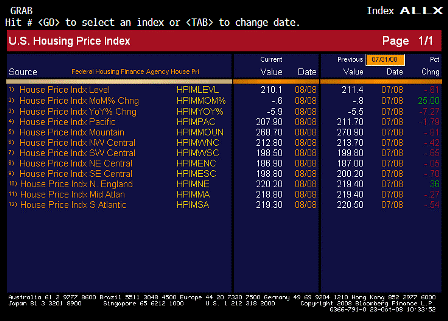
House Price Index MoM (Aug)

Survey -0.5%
Actual -0.6%
Prior -0.6%
Revised -0.8%

 
A little worse than expected and rates of decline may have leveled off.

[top][end]

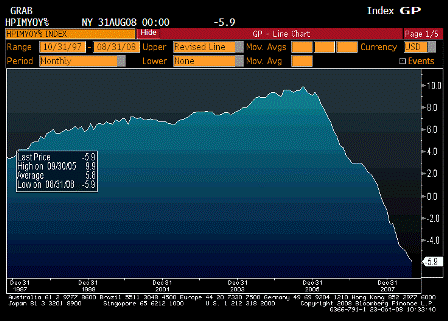
House Price Index YoY (Aug)

Survey n/a
Actual -5.9%
Prior -5.5%
Revised n/a

 
Still falling but at perhaps moderating rates.

[top][end]

House Price Index ALLX (Aug)


[top]

2008-10-09 USER


[Skip to the end]


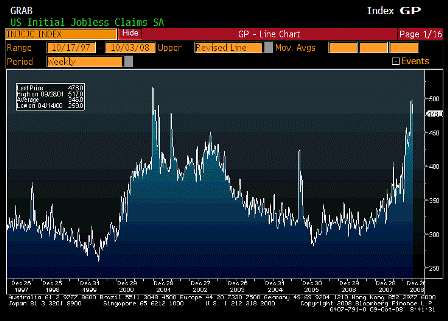
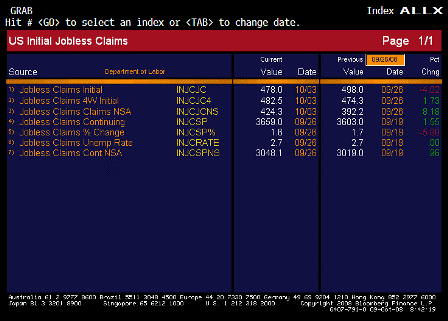
Initial Jobless Claims (Oct 4)

Survey 475K
Actual 478K
Prior 497K
Revised 498K

 
Still around 450,000 adjusted for storms.

Need another week or so to normalize.

[top][end]

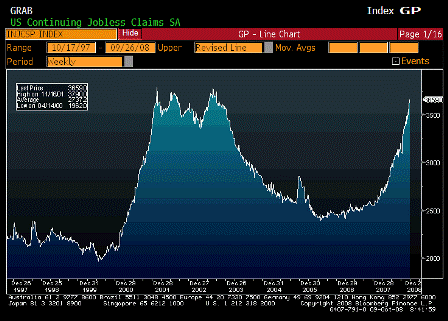
Continuing Jobless Claims (Sep 27)

Survey 3608K
Actual 3659K
Prior 3591K
Revised 3603K

 
Still rising.

No one seems to know how much the extended benefits added.

[top][end]

Jobless Claims ALLX (Oct 4)

[top][end]


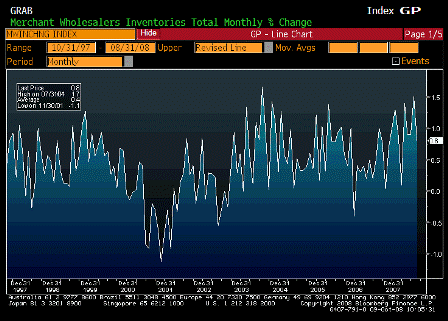
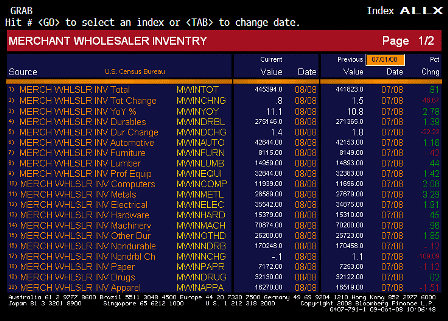
Wholesale Inventories MoM (Aug)

Survey 0.4%
Actual 0.8%
Prior 1.4%
Revised 1.5%

[top][end]

Wholesale Inventories YoY (Aug)

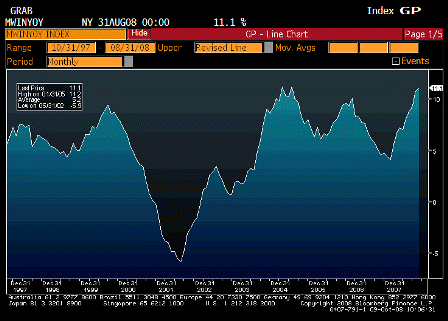
Survey n/a
Actual 11.1%
Prior 10.8%
Revised n/a

[top][end]

Wholesale Inventories ALLX 1 (Aug)

[top][end]

Wholesale Inventories ALLX 2 (Aug)


[top]
2008-10-02 USER


[Skip to the end]

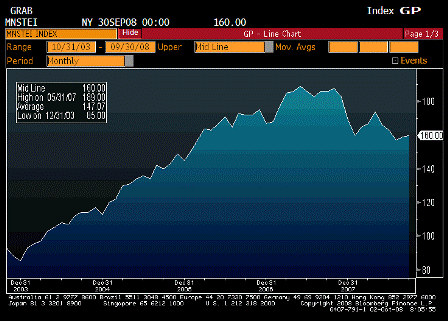
Monster Employment Index (Sep 8)

Survey n/a
Actual 160.00
Prior 159.00
Revised n/a

 
Counter trend move higher?

[top][end]

Monster Employment Index MoM (Sep 8)

Survey n/a
Actual 0.6%
Prior 1.3%
Revised n/a

 
Slightly positive.

[top][end]


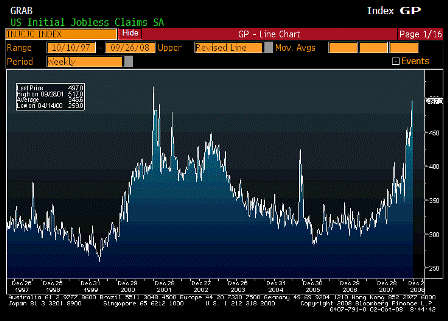
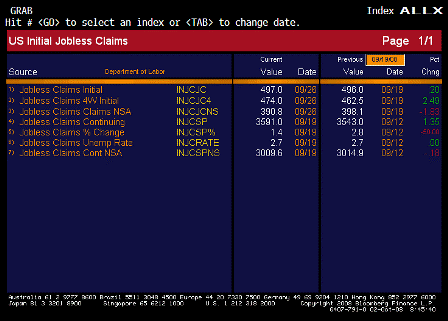
Initial Jobless Claims (Sep 27)

Survey 475K
Actual 497K
Prior 493K
Revised 496K

 
Still high, but subtract maybe 50,000 for hurricanes and maybe the Boeing strike as well.

[top][end]

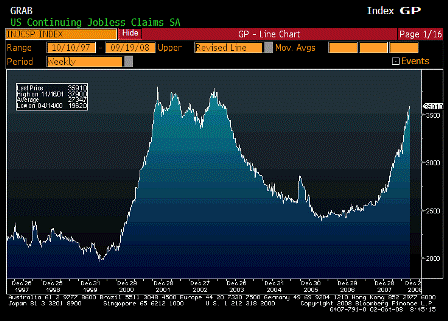
Continuing Jobless Claims (Sep 20)

Survey 3550K
Actual 3591K
Prior 3542K
Revised 3543K

 
This was leveling off until the extended benefits package took effect, and has resumed its climb since.

[top][end]

Jobless Claims ALLX (Sep 27)

[top][end]


RPX Composite 28dy YoY (Jul)

Survey n/a
Actual -17.76%
Prior -17.15%
Revised n/a

[top][end]

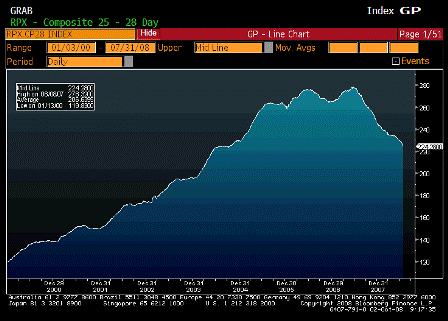
RPX Composite 28dy Index (Jul)

Survey n/a
Actual 224.28
Prior 230.00
Revised n/a

[top][end]


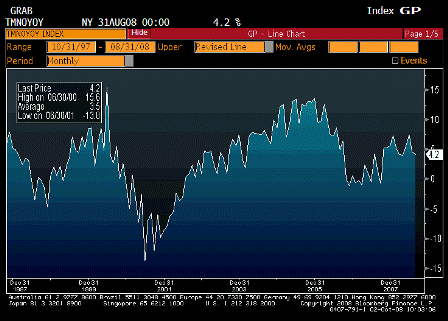
Factory Orders YoY (Aug)

Survey n/a
Actual 4.2%
Prior 4.7%
Revised n/a

 
Still trending up year over year, but combined with other recent data doesn’t look good.

[top][end]

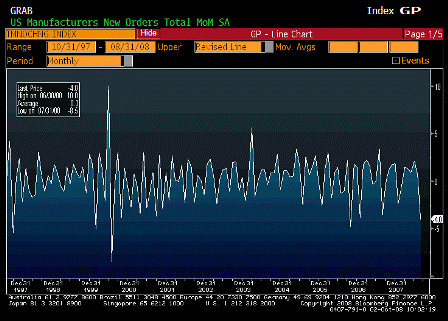
Factory Orders MoM (Aug)

Survey -3.0%
Actual -4.0%
Prior 1.3%
Revised 0.7%

[top][end]

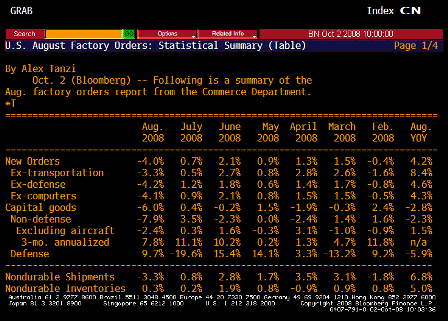
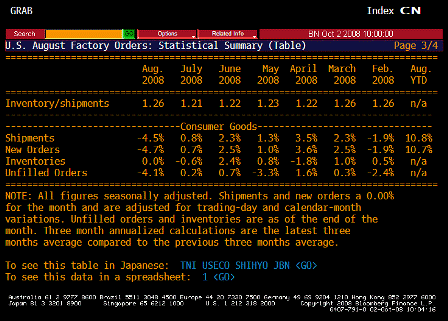
Factory Orders TABLE (Aug)

 
Defense keeping this from being a lot worse.

[top][end]

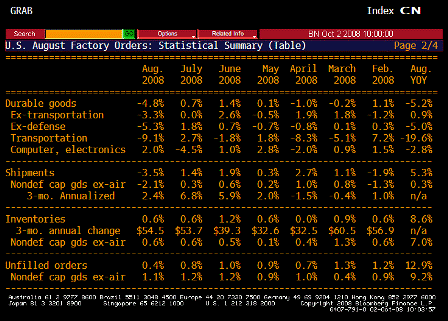
Factory Orders TABLE 2 (Aug)

[top][end]

Factory Orders TABLE 3 (Aug)

 
Shipments down, unfilled orders up.


Karim writes:

  • Initial claims rise 1k to 497k, with 40-50k still accounted for by hurricanes (4wk avg 474k).
  • Continuing claims, not effected by hurricanes, rise another 48k to new cycle high of 3542k (4wk avg 3528k).
  • Continuing claims more highly correlated to duration of unemployment and wage demands.
  • Consensus NFP tomorrow is -105k; based on claims, Conf Board and ISM surveys, risks seem more in -150k area.


[top]