Comments on Non-Mfg ISM

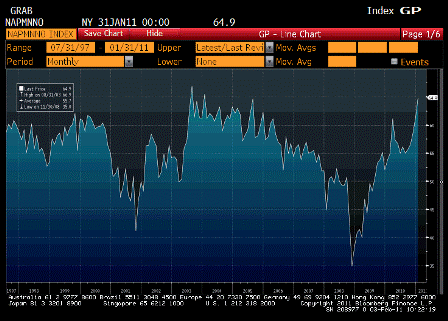
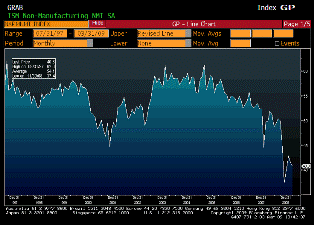
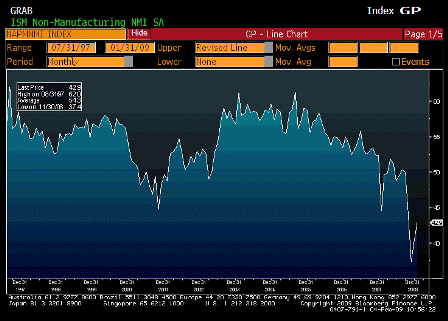
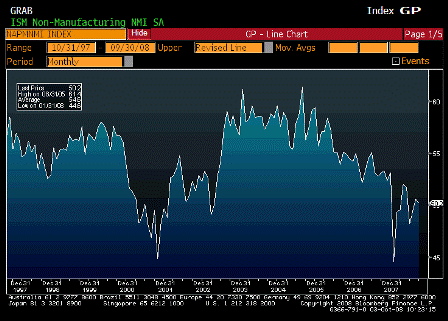
Looks from the chart we’re getting close to the post Bush tax cut, coming out of that recession highs, so we’re on track for our 3-5% read gdp growth guestimates.

And the high productivity reported today reinforces our thoughts on unemployment coming down only slowly as well.

Last time around the expansion phase of what became the sub prime crisis was a substantial contributor to private sector credit growth. Without that kind of contribution from somewhere else, this recovery could be more modest than the last.

For exports to be sustained, the govt would have to keep the dollar down with fx purchases and reserve building, which in my humble opinion isn’t going to happen. That means the adjustment takes place via a climbing US dollar that continues until it dampens exports. Much like what the euro zone has experienced for the last decade or so.


Karim writes:

Multi-year highs for overall index, new orders (3rd highest on record-chart attached), and employment.
Anecdotes also very positive.

  • “New initiatives creating increase in spending.” (Finance & Insurance)
  • “Indications are that business is picking up and that 2011 could see positive growth across many industries. We are seeing an increase in orders at the beginning of the year.” (Professional, Scientific & Technical Services)
  • “Starting to see higher prices in many areas. Low inventory levels are leading to longer delivery time frames.” (Public Administration)
  • “Business uncertainty seems to be subsiding.” (Management of Companies & Support Services)
  • “Business activity is picking up. The challenges in the textile market (cotton/polyester) are significantly impacting price along with the inability to secure pricing for a period longer than two months.” (Accommodation & Food Services)
  • “2011 looking better than 2010.” (Information)


Jan Dec
Composite 59.4 57.1
Business activity 64.6 62.9
Prices Paid 72.1 69.5
New Orders 64.9 61.4
Backlog of Orders 50.5 48.5
Supplier Deliveries 53.5 51.5
Inventory Change 49.0 52.5
Inventory Sentiment 60.0 61.5
Employment 54.5 52.6
Export orders 53.5 56.0
Imports 53.5 51.0

2009-04-03 USER


[Skip to the end]


Change in Nonfarm Payrolls (Mar)

Survey -660K
Actual -663K
Prior -651K
Revised n/a

 
Karim writes:

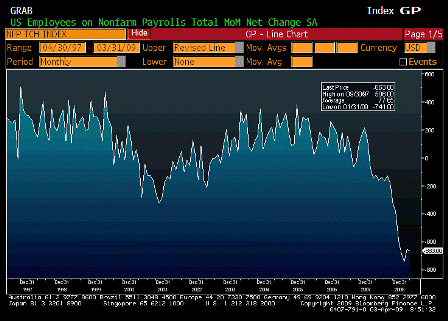
  • A 663k drop in payrolls and -86k in net revisions is bad enough
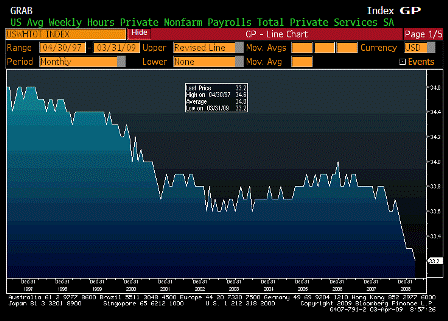
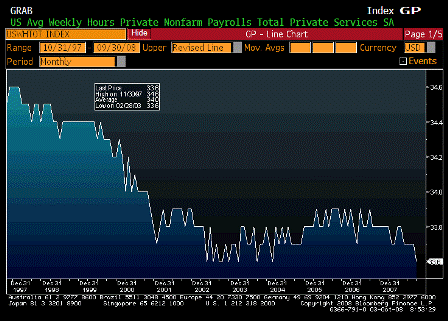
  • The worst of it is the ongoing collapse in hours-the index of aggregate hours down another 1% last month
  • On a work force of 130mm, a 1% drop in hours has the same impact on labor income as a 1.3mm fall in payrolls if total hours were unch
  • The annualized drop in hours in Q1 was -8.7%-assuming 2-3% productivity growth; likely leaves real GDP in -5.5% to -6.5% area
  • Total unemployed, plus marginally attached workers, plus part-time for economic reasons up from 14.8% to 15.4% (16% to 16.2% unadjusted)
  • Only positive was diffusion index up from 21.4 to 22
  • But looking at industry breakdown, hard to find where that improvement came from
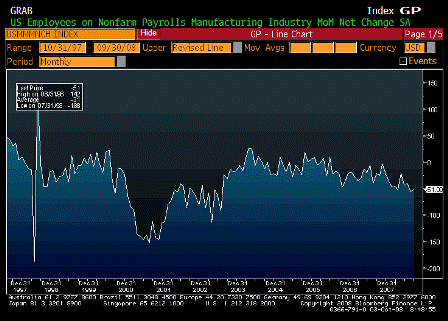
    • Manufacturing -161k
    • Construction -126k
    • Retail -48k
    • Finance -43k
    • Temp -72k
    • Govt -5k
    • Education +8k

[top][end]

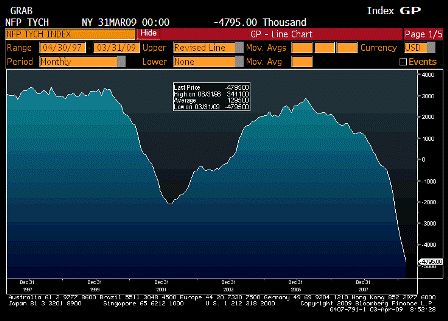
Change in Nonfarm Payrolls YoY (Mar)

Survey n/a
Actual -4795.00
Prior -4254.00
Revised n/a

[top][end]

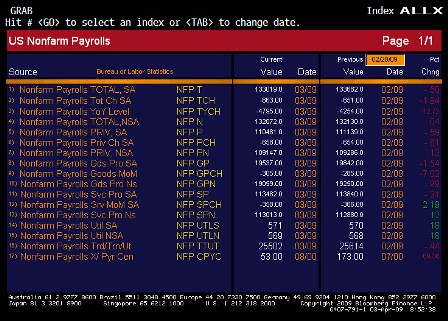
Nonfarm Payrolls ALLX (Mar)

[top][end]

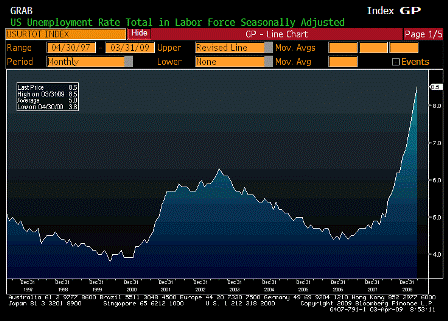
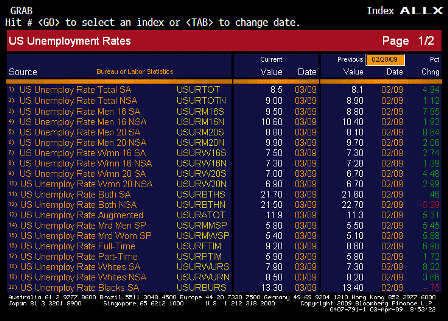
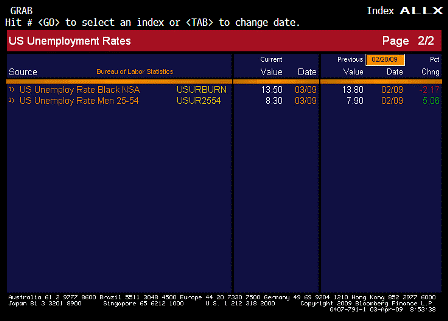
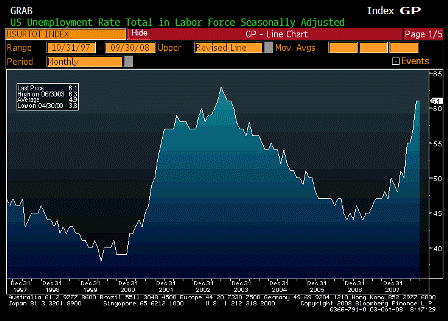
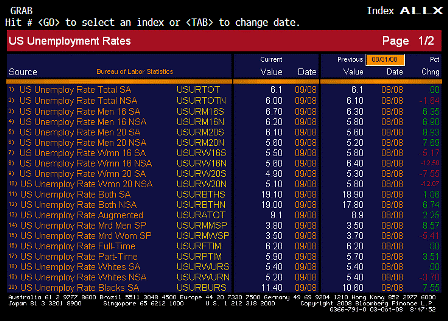
Unemployment Rate (Mar)

Survey 8.5%
Actual 8.5%
Prior 8.1%
Revised n/a

[top][end]

Unemployment Rate ALLX 1 (Mar)

[top][end]

Unemployment Rate ALLX 2 (Mar)

[top][end]

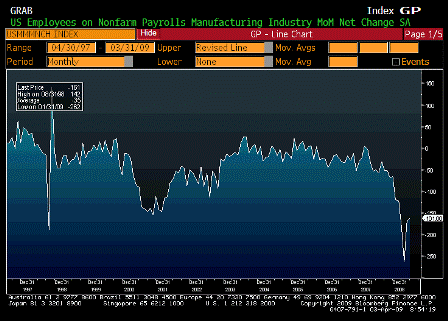
Change in Manufacturing Payrolls (Mar)

Survey -162K
Actual -161K
Prior -168K
Revised -169K

[top][end]

Change in Manufacturing Payrolls YoY (Mar)

Survey n/a
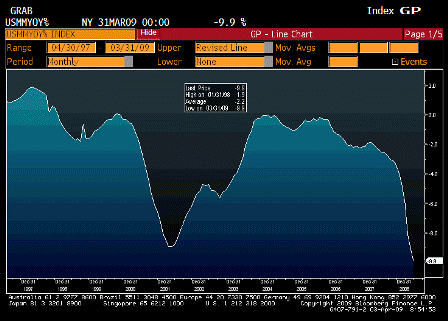
Actual -9.9%
Prior -9.1%
Revised n/a

[top][end]

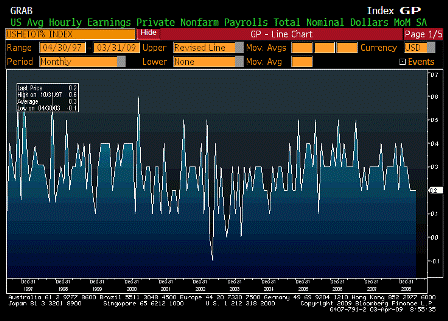
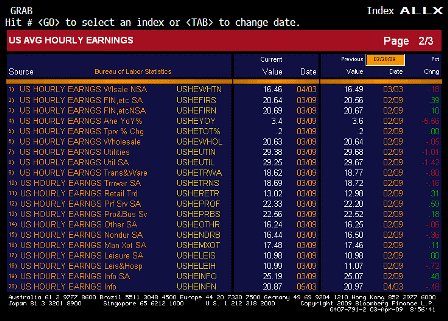
Average Hourly Earnings MoM (Mar)

Survey 0.2%
Actual 0.2%
Prior 0.2%
Revised n/a

[top][end]

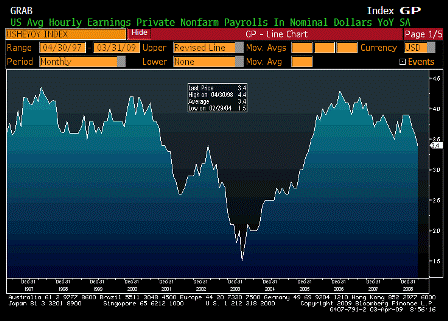
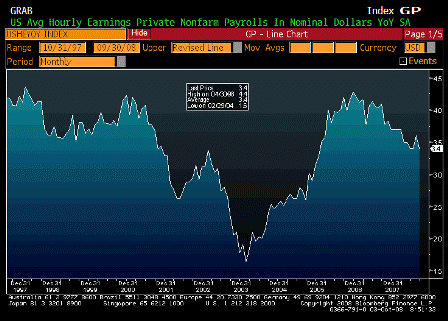
Average Hourly Earnings YoY (Mar)

Survey 3.5%
Actual 3.4%
Prior 3.6%
Revised n/a

[top][end]

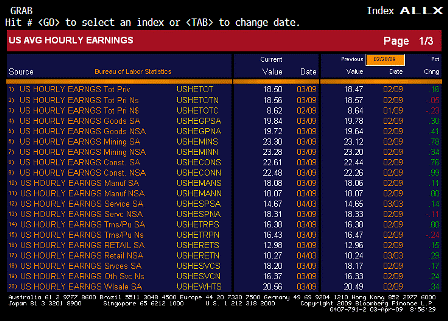
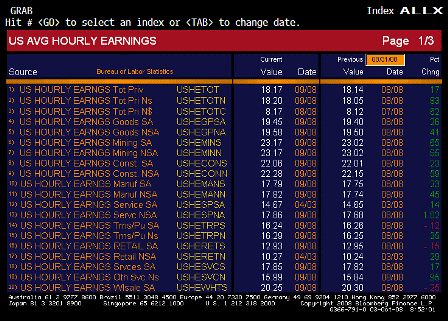
Average Hourly Earnings ALLX 1 (Mar)

[top][end]

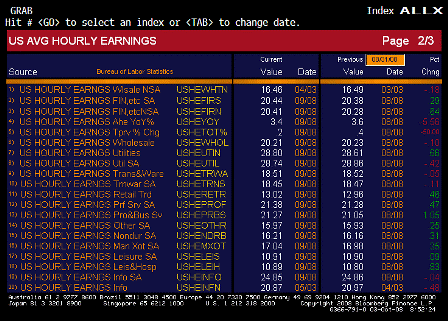
Average Hourly Earnings ALLX 2 (Mar)

[top][end]

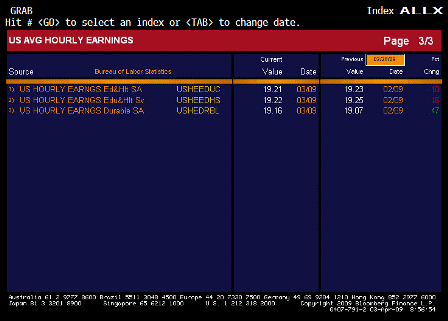
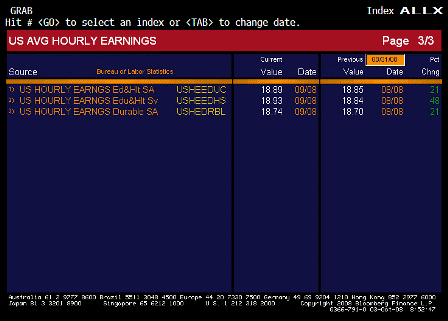
Average Hourly Earnings ALLX 3 (Mar)

[top][end]

Average Weekly Hours (Mar)

Survey 33.3
Actual 33.2
Prior 33.3
Revised n/a

[top][end]


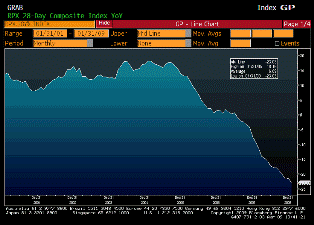
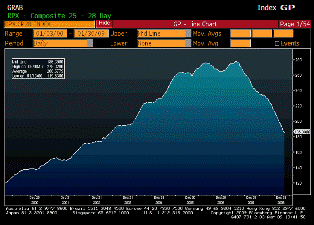
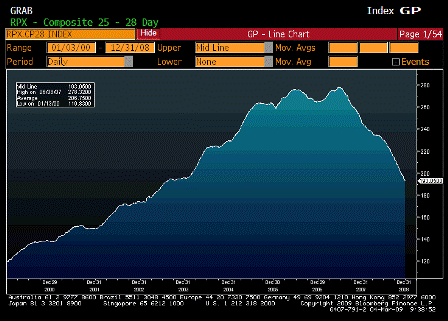
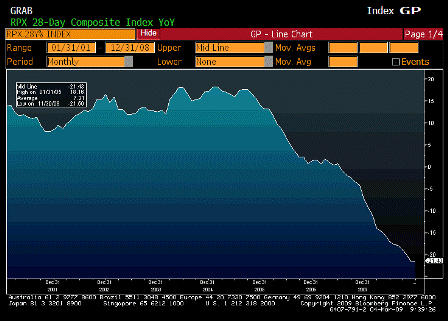
RPX Composite 28dy YoY (Jan)

Survey n/a
Actual -23.03%
Prior -21.43%
Revised n/a

[top][end]

RPX Composite 28dy Index (Jan)

Survey n/a
Actual 186.39
Prior 193.05
Revised n/a

[top][end]


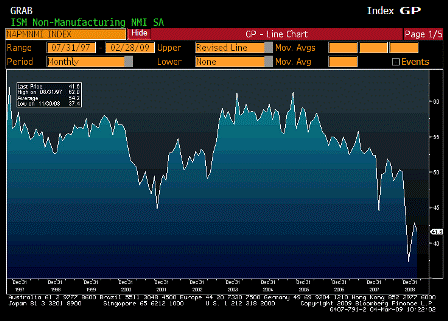
ISM Non Manufacturing Composite (Mar)

Survey 42.0
Actual 40.8
Prior 41.6
Revised n/a


[top]

2009-03-04 USER


[Skip to the end]

 
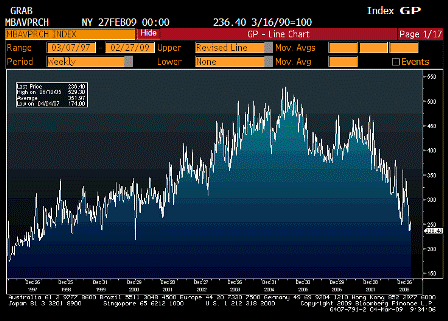
It all still looks very, very weak. But so low that even small improvements will show high % gains.


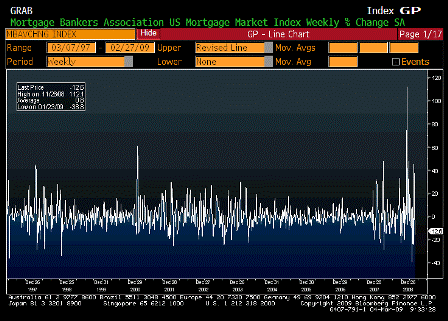
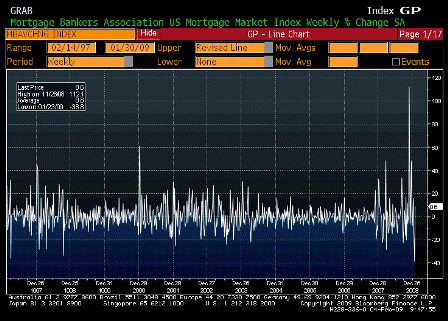
MBA Mortgage Applications (Feb 27)

Survey n/a
Actual -12.6%
Prior -15.1%
Revised n/a

[top][end]

MBA Purchasing Applications (Feb 27)

Survey n/a
Actual 236.40
Prior 250.50
Revised n/a

[top][end]

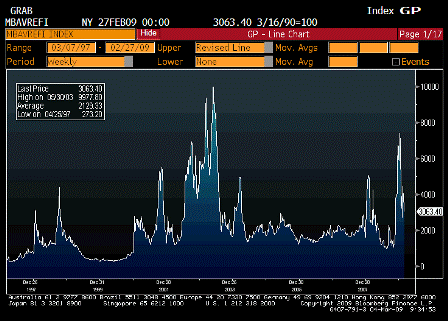
MBA Refinancing Applications (Feb 27)

Survey n/a
Actual 3063.40
Prior 3618.00
Revised n/a

[top][end]


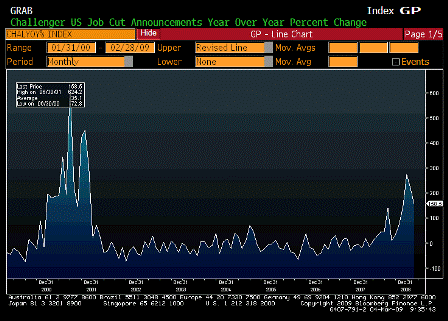
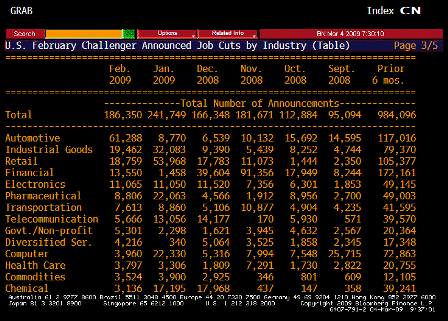
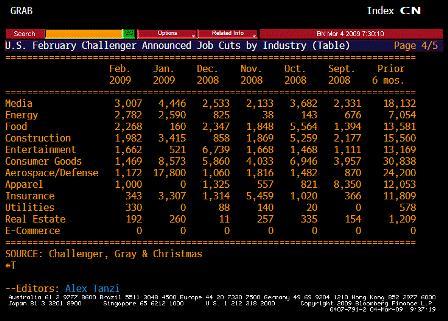
Challenger Job Cuts YoY (Feb)

Survey n/a
Actual 158.49%
Prior 222.40%
Revised n/a

[top][end]

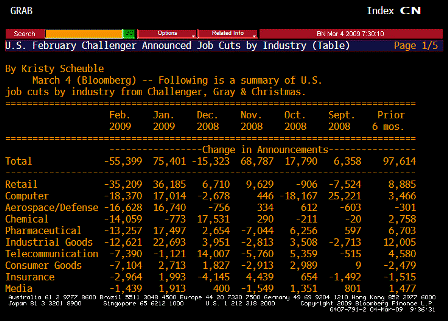
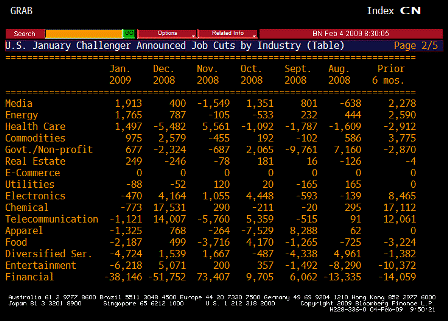
Challenger Job Cuts TABLE 1 (Feb)

[top][end]

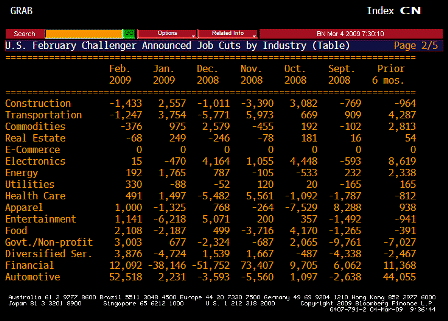
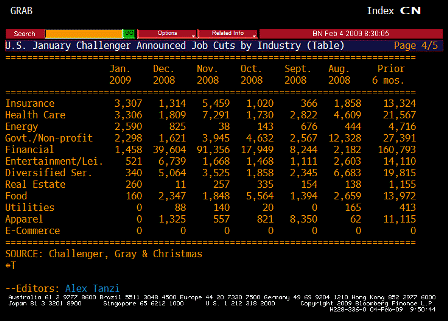
Challenger Job Cuts TABLE 2 (Feb)

[top][end]

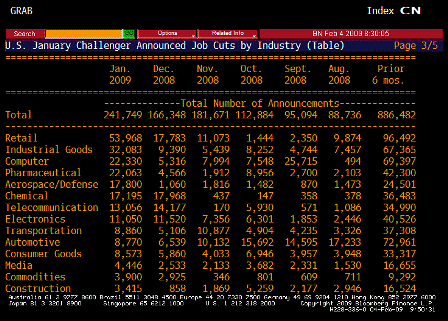
Challenger Job Cuts TABLE 3 (Feb)

[top][end]

Challenger Job Cuts TABLE 4 (Feb)

[top][end]


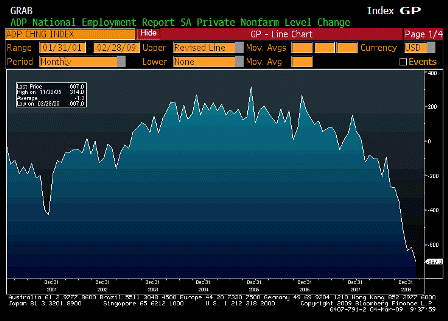
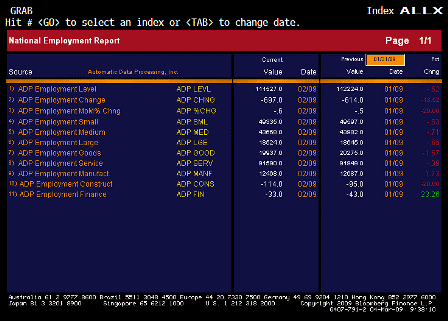
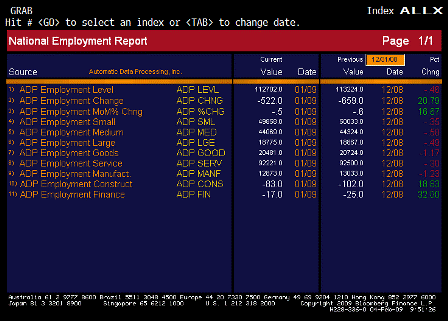
ADP Employment Change (Feb)

Survey -630K
Actual -697K
Prior -522K
Revised -614K

[top][end]

ADP ALLX (Feb)

[top][end]


RPX Composite 28dy Index (Dec)

Survey n/a
Actual 193.05
Prior 199.39
Revised n/a

[top][end]

RPX Composite 28dy YoY (Dec)

Survey n/a
Actual -21.43%
Prior -21.59%
Revised n/a

[top][end]


ISM Non Manufacturing Composite (Feb)

Survey 41.0
Actual 41.6
Prior 42.9
Revised 42.9


[top]

2009-02-04 USER


[Skip to the end]


MBA Mortgage Applications (Jan 30)

Survey n/a
Actual 8.6%
Prior -38.8%
Revised n/a

[top][end]

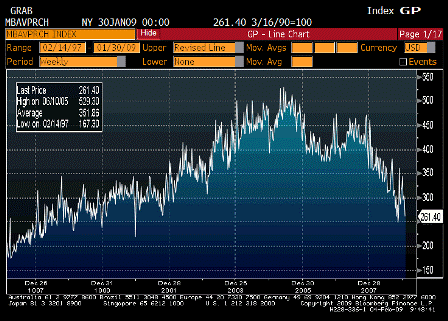
MBA Purchasing Applications (Jan 30)

Survey n/a
Actual 261.40
Prior 294.30
Revised n/a

[top][end]

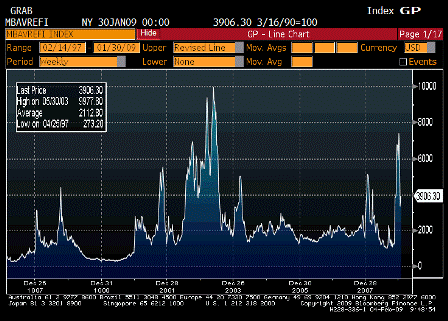
MBA Refinancing Applications (Jan 30)

Survey n/a
Actual 3906.30
Prior 3373.90
Revised n/a

[top][end]

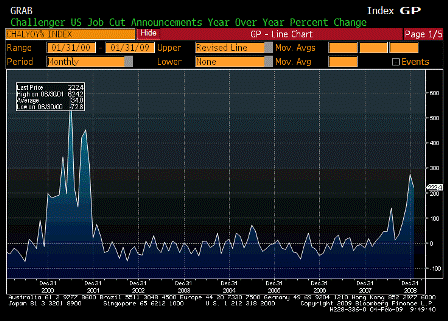
Challenger Job Cuts YoY (Jan)

Survey n/a
Actual 222.4%
Prior 274.5%
Revised n/a

[top][end]

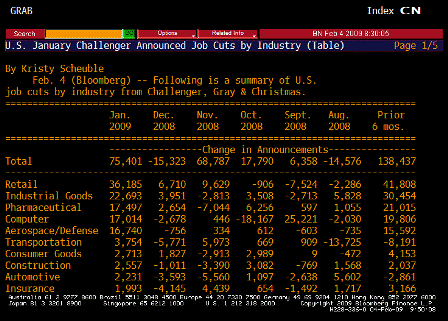
Challenger Job Cuts TABLE 1 (Jan)

[top][end]

Challenger Job Cuts TABLE 2 (Jan)

[top][end]

Challenger Job Cuts TABLE 3 (Jan)

[top][end]

Challenger Job Cuts TABLE 4 (Jan)

[top][end]

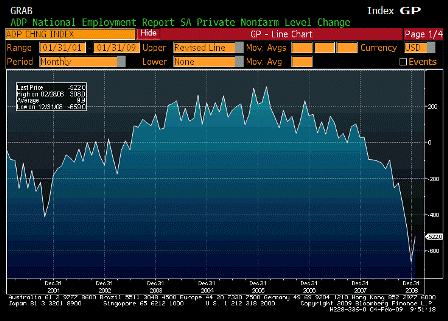
ADP Employment Change (Jan)

Survey -535K
Actual -522K
Prior -693K
Revised -659K

[top][end]

ADP ALLX (Jan)

[top][end]

ISM Non Manufacturing Composite (Jan)

Survey 39.0
Actual 42.9
Prior 40.6
Revised 40.1


[top]

2008-10-03 USER


[Skip to the end]


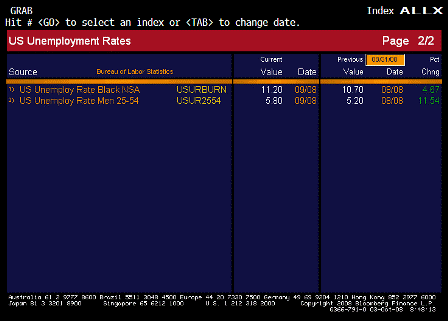
Unemployment Rate (Sep)

Survey 6.1%
Actual 6.1%
Prior 6.1%
Revised n/a

[top][end]

Unemployment Rate ALLX 1 (Sep)

[top][end]

Unemployment Rate ALLX 2 (Sep)

[top][end]


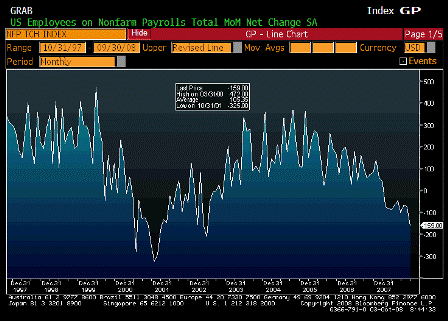
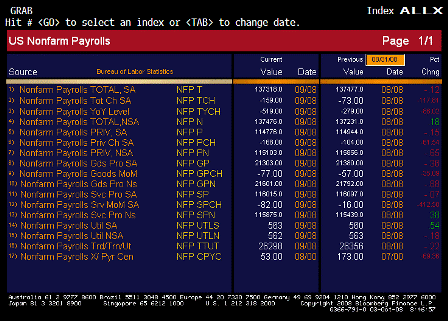
Change in Nonfarm Payrolls (Sep)

Survey -105k
Actual -159k
Prior -84k
Revised -73k

[top][end]

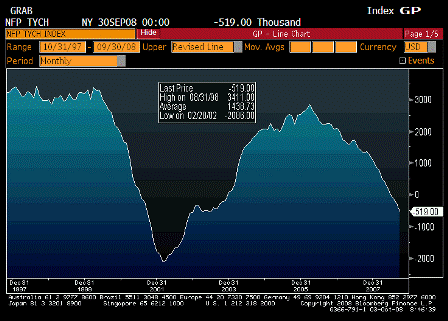
Change in Nonfarm Payrolls YoY (Sep)

Survey n/a
Actual -519.00
Prior -279.00
Revised n/a

[top][end]

Nonfarm Payrolls ALLX (Sep)

[top][end]

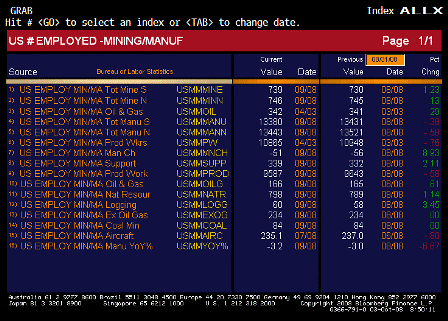
Change in Manufacturing Payrolls (Sep)

Survey -57k
Actual -51k
Prior -61k
Revised -56k

[top][end]

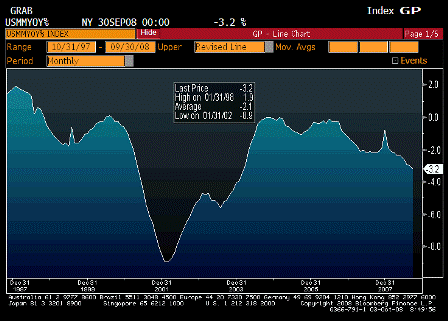
Change in Manufacturing Payrolls YoY (Sep)

Survey n/a
Actual -3.2%
Prior -3.0%
Revised n/a

[top][end]

Manufacturing Payrolls ALLX (Sep)

[top][end]


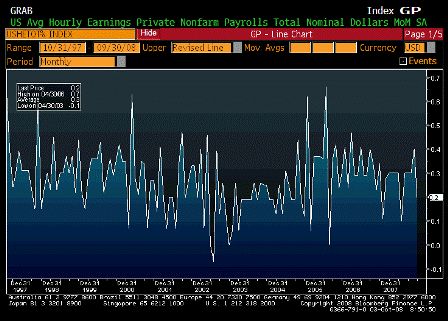
Average Hourly Earnings MoM (Sep)

Survey 0.3%
Actual 0.2%
Prior 0.4%
Revised n/a

[top][end]

Average Hourly Earnings YoY (Sep)

Survey 3.6%
Actual 3.4%
Prior 3.6%
Revised n/a

[top][end]

Average Hourly Earnings ALLX 1 (Sep)

[top][end]

Average Hourly Earnings ALLX 2 (Sep)

[top][end]

Average Hourly Earnings ALLX 3 (Sep)

[top][end]


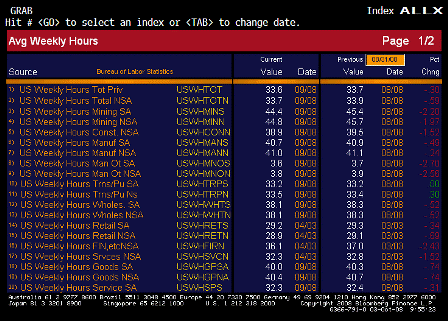
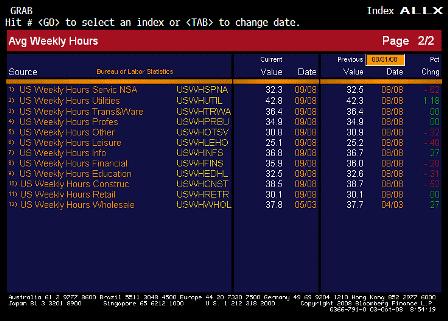
Average Weekly Hours (Sep)

Survey 33.7
Actual 33.6
Prior 33.7
Revised n/a

[top][end]

Average Weekly Hours ALLX 1 (Sep)

[top][end]

Average Weekly Hours ALLX 2 (Sep)

[top][end]


ISM Non Manufacturing Composite (Sep)

Survey 50.0
Actual 50.2
Prior 50.6
Revised n/a


[top]

2008-01-04 US Economic Releases

2008-01-04 Unemployment Rate

Unemployment Rate (Dec)

Survey 4.8%
Actual 5.0%
Prior 4.7%
Revised n/a

It comes from the household survey – been volatile.


2008-01-04 Change in Nonfarm Payrolls

Change in Nonfarm Payrolls (Dec)

Survey 70K
Actual 18K
Prior 94K
Revised 115K

2008-01-04 Change in Manufacturing Payrolls

Change in Manufacturing Payrolls (Dec)

Survey -15K
Actual -31K
Prior -11K
Revised -13K

Payroll increases continue to decline modestly over time. The fed believes demographic changes will reduce the labor force participation rate, keeping unemployment relatively low and labor markets tight, even with fewer jobs.


2008-01-04 Average Hourly Earnings MoM

Average Hourly Earnings MoM

Survey 0.3%
Actual 0.4%
Prior 0.5%
Revised 0.4%

2008-01-04 Average Hourly Earnings YoY

Average Hourly Earnings YoY (Dec)

Survey 3.6%
Actual 3.7%
Prior 3.8%
Revised n/a

Remains firm, and productivity probably down, meaning unit labor costs rising some.


2008-01-04 Average Weekly Hours

Average Weekly Hours (Dec)

Survey 33.8
Actual 33.8
Prior 33.8
Revised n/a

2008-01-04 ISM Non-Manufacturing

ISM Non-Manufacturing (Dec)

Survey 53.6
Actual 53.9
Prior 54.1
Revised

Very firm and cross checks with th 93,000 increase in service sector jobs for December.

ISM Non-Manufacturing TABLE ISM Non-Manufacturing TABLE

ISM Non-Manufacturing TABLE

Note the strength in the price categories.


♥

2007-12-05 US Economic Releases


2007-12-05 MBA Mortgage Applications

MBA Mortgage Applications (Nov 30)

Survey n/a
Actual 25.5%
Prior -4.3%
Revised -5.2%

Mortgage banking purchase index is holding above 400 since April, and up nicely year over year. The ‘multiple application’ story is getting old.


2007-12-05 Challenger Job Cuts YoY

Challenger Job Cuts YoY (Nov)

Survey n/a
Actual -4.7%
Prior -8.8%
Revised n/a

Modest improvement- doesn’t look like a recession has started.


2007-12-05 ADP Employment Change

ADP Employment Change (Nov)

Survey 50K
Actual 189K
Prior 106K
Revised 119K

No weakness here- prelude to Friday’s employment number.


2007-12-05 Nonfarm Productivity

Nonfarm Productivity (3QF)

Survey 5.9%
Actual 6.3%
Prior 4.9%
Revised n/a

More real output from the same amount of labor input, further questions the deflator for Q3.


2007-12-05 Unit Labor Costs

Unit Labor Costs (3QF)

Survey -1.2%
Actual -2.0%
Prior 0.2%
Revised n/a

As above, the q3 deflator looked suspiciously low.

This should adjust with q4 numbers.


2007-12-05 Factory Orders

Factory Orders (Oct)

Survey 0.0%
Actual 0.5%
Prior 0.2%
Revised 0.3%

Boring, and not worse than Fed forecasts.


2007-12-05 ISM Non-Manufacturing

ISM Non-Manufacturing (Nov)

Survey 55.0
Actual 54.1
Prior 55.8
Revised n/a

It’s been drifting lower with falling budget deficit, but exports propping up gdp.

Probably not any worse than Fed forecasts.


♥