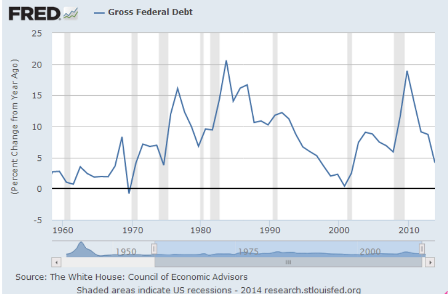
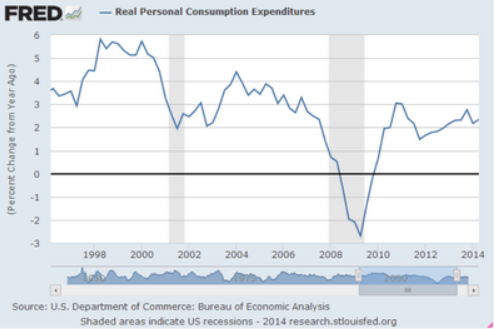
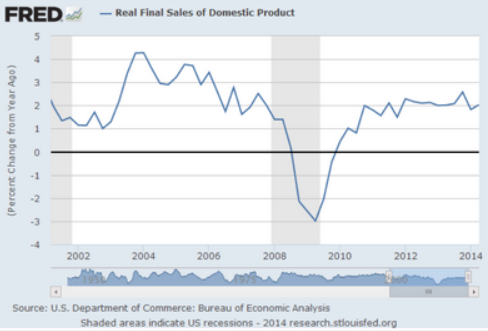
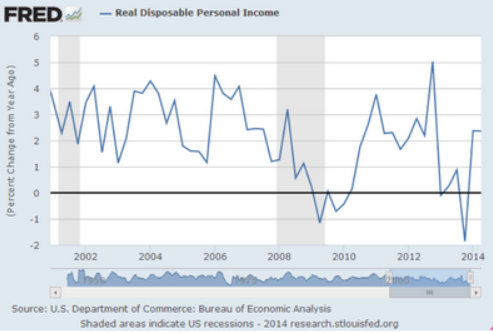
Headlines sound a lot better than the charts look.
Absolute levels and growth rates continue to fall short of prior cycles:
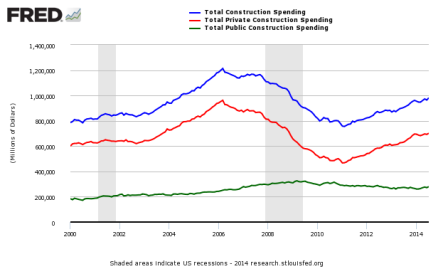
Construction Spending
Highlights
Construction outlays saw a broad-based gain in July. Construction spending rebounded 1.8 percent after a 0.9 percent dip in June. While all broad categories advanced, July’s increase was led by the public sector-up 3.0 percent, following a 1.8 percent decrease in June. Private nonresidential spending rebounded 2.1 percent in July after slipping 0.8 percent the month before. Private residential outlays gained 0.7 percent, following a 0.4 percent dip in June.
On a year-ago basis, total outlays were up 8.2 percent in July, compared to 7.0 percent the month before.
Overall, the latest construction data add to third quarter momentum. Third quarter GDP estimates will likely be nudged up. There is a lot of recent volatility in construction data but the residential gain is encouraging.

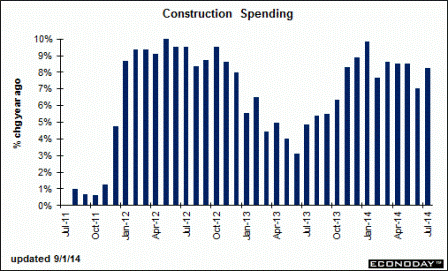
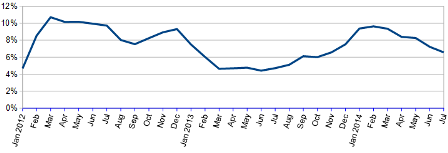
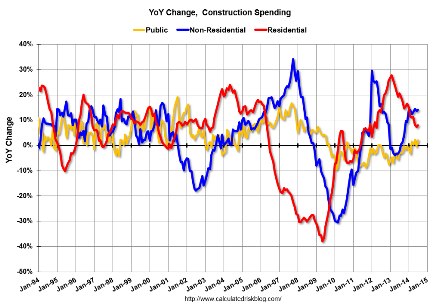
Unadjusted Construction Spending – Three Month Rolling Average Compared to the Rolling Average One Year Ago
Full size image
Full size image
Full size image
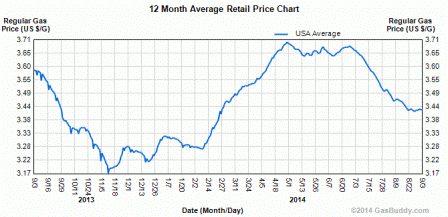
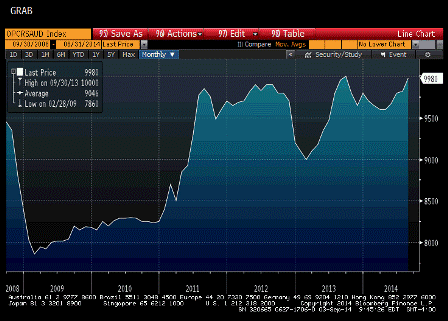
This helps consumers some and also puts downward pressure on ‘inflation’:
Full size image
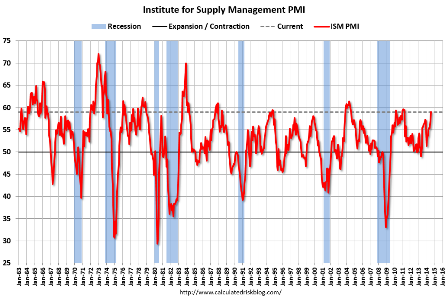
Manufacturing continues to do reasonably well, chugging along about the way it always does until the cycle ends:
Full size image
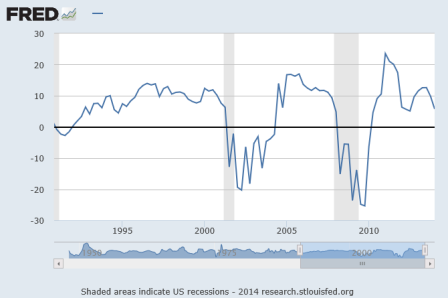
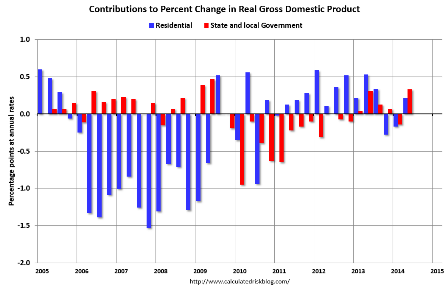
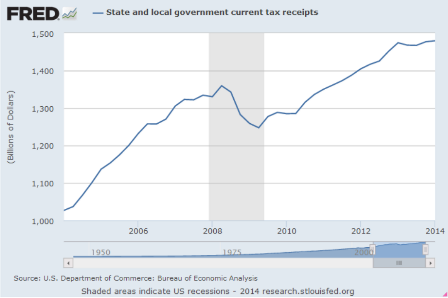
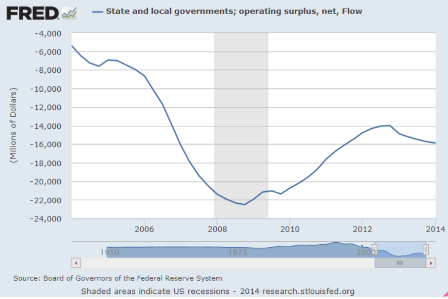
Don’t be misled by the talk of state and local govt contributing to GDP. The spending side is only half the story- they also tax. So you need to look at state and local govt deficits to get an idea of their net contribution:
This is the spending side:
Full size image
It’s a bit tricky as you don’t want to double count federal $ spent by the states:
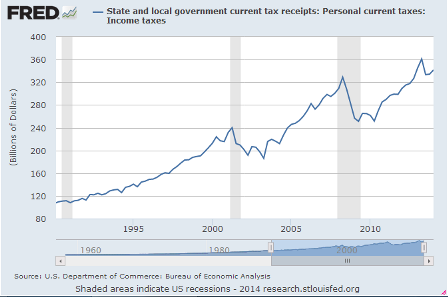
Sure enough, tax receipts which tend to be highly cyclical, going up when the economy does better, seem to have stalled, and state and local deficits have gone up. So is that an indicator of growth?
And it looks like state and local deficits did go up a tad, but not a lot:
And this just came out:
Full size image
The call on Saudi oil shows no signs of diminishing which they remain as ‘swing producer/price setter’, setting price and letting quantity adjust with demand:
Full size image
And this:
;)
Full size image