Deficit spending for dummies


[Skip to the end]

The media is screaming that deficit spending simply takes money from borrowers and gives it to someone else, so it doesn’t work.

This is NOT the case. In fact, deficit spending ADDS to our total savings of financial assets.

Operationally, this is how $100 billion of deficit spending ‘works’ to ADD to nominal savings of financial assets:

  1. The Treasury sells $100 billion of treasury securities.
  2. Paying for the new securities reduces member bank balances held at the Fed by $100 billion.
  3. And our holdings of treasury securities increase by $100 billion.
  4. Quick recap-

    We buy treasury securities from the government which means we have $100 billion more treasury securities.

    We pay for them which means we have $100 billion less in our bank accounts.

    So far all we have done is exchange bank balances at the Fed for treasury securities, which also held at the Fed.

    So far nothing of economic consequence has changed, apart from now we could be earning more interest on our treasury securities than we had been earning on our Fed balances.

  5. The Treasury spends the $100 billion it got from selling us the $100 billion of new treasury securities.
  6. This increases member bank balances at the Fed by $100 billion.

Final recap:

  • Bank balances are back where they started from.
  • Our holdings of treasury securities, which are financial assets and saving, have increased by $100 billion.

Conclusion and proof:

Government deficit spending of $100 billion necessarily increases savings of financial assets by $100 billion.

Please distribute as widely as possible as a matter of further public purpose!!!


[top]

2009-02-19 USER


[Skip to the end]


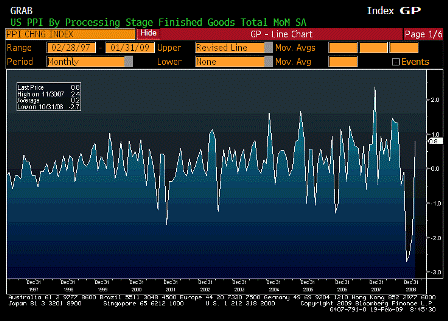
Producer Price Index MoM (Jan)

Survey 0.3%
Actual 0.8%
Prior -1.9%
Revised n/a

 
Karim writes:

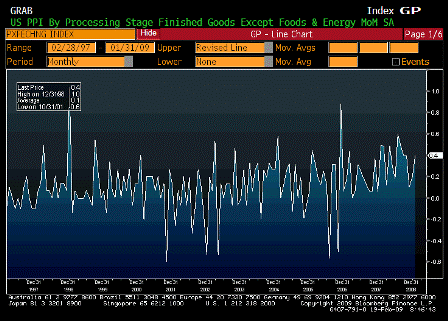
  • PPI up 0.8% and 0.4% core; core boosted by some annual one-offs (prescriptions at 1.1% and tobacco at 0.6%)
  • Pipeline pressures continue to decline; intermediate -0.7% and core intermediate -1.1%; crude -2.9% and core crude 0.1%

[top][end]

PPI Ex Food and Energy MoM (Jan)

Survey 0.1%
Actual 0.4%
Prior 0.2%
Revised n/a

[top][end]

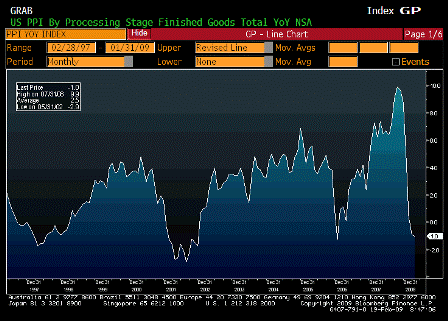
Producer Price Index YoY (Jan)

Survey -2.4%
Actual -1.0%
Prior -0.9%
Revised n/a

[top][end]

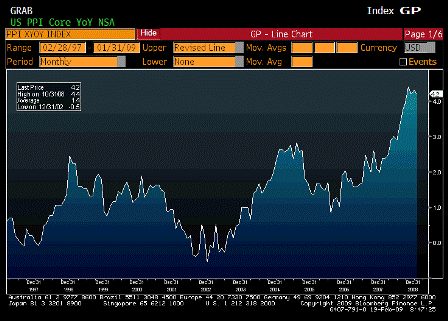
PPI Ex Food and Energy YoY (Jan)

Survey 3.8%
Actual 4.2%
Prior 4.3%
Revised n/a

[top][end]

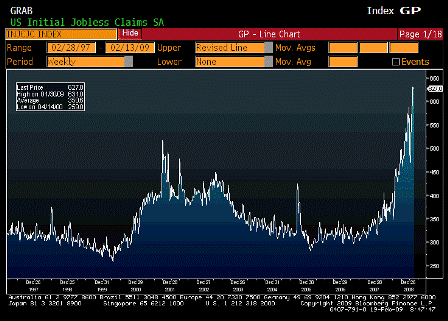
Initial Jobless Claims (Feb 14)

Survey 620K
Actual 627K
Prior 623K
Revised 627K

 
Karim writes:

  • Initial claims remain unch at 627k (prior week revised up 4k)
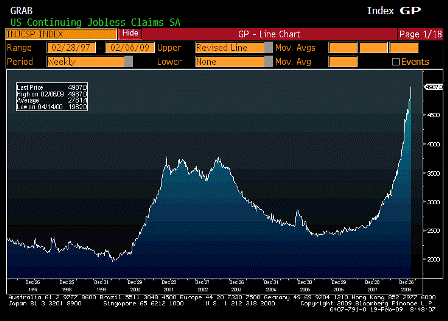
  • Continuing claims up 170k to new cycle high

[top][end]

Continuing Claims (Feb 7)

Survey 4830K
Actual 4987K
Prior 4810K
Revised 4817K

[top][end]

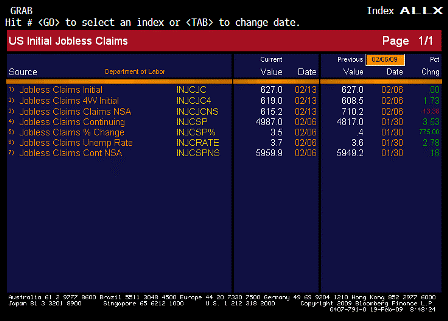
Jobless Claims ALLX (Feb 14)

[top][end]

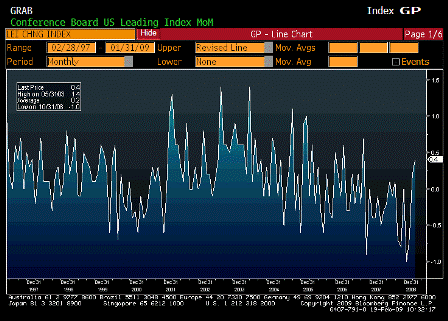
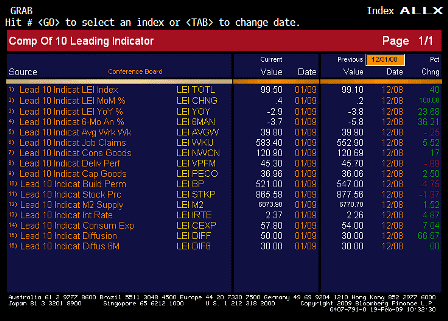
Leading Indicators (Jan)

Survey 0.1%
Actual 0.4%
Prior 0.3%
Revised 0.2%

[top][end]

Leading Indicators ALLX (Jan)

[top][end]

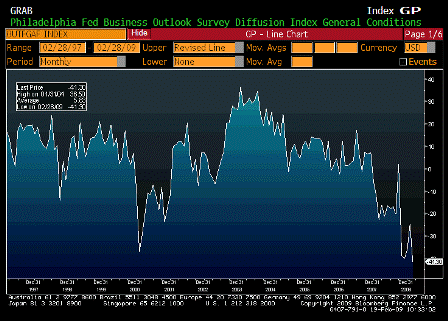
Philadelphia Fed (Feb)

Survey -25.0
Actual -41.3
Prior -24.3
Revised n/a

 
Karim writes:

  • Philly Fed confirms Empire survey earlier this week that rate of decline in manufacturing is accelerating.
  • Headline activity, orders, shipments, and employment all fall sharply

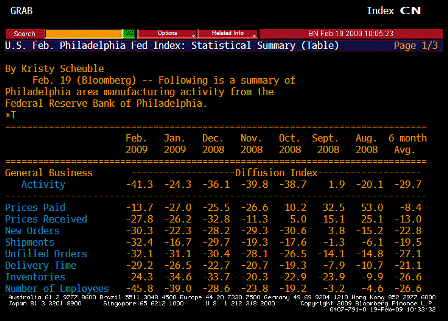
Feb 2009 Jan 2009 Dec 2008 Nov 2008 Oct 2008 Sept 2008 Aug 2008 6 month avg
General Business Activity -41.3 -24.3 -36.1 -39.8 -38.7 1.9 -20.1 -29.7
Prices Paid -13.7 -27.0 -25.5 -26.6 10.2 32.5 53.0 -8.4
Prices Received -27.8 -26.2 -32.8 -11.3 5.0 15.1 25.1 -13.0
New Orders -30.3 -22.3 -28.2 -29.3 -30.6 3.8 -15.2 -22.8
Shipments -32.4 -16.7 -29.7 -19.3 -17.6 -1.3 -6.1 -19.5
# of Employees -45.8 -39.0 -28.6 -23.8 -19.2 -3.2 -4.6 -26.6

[top][end]

Philadelphia Fed TABLE 1 (Feb)

[top][end]

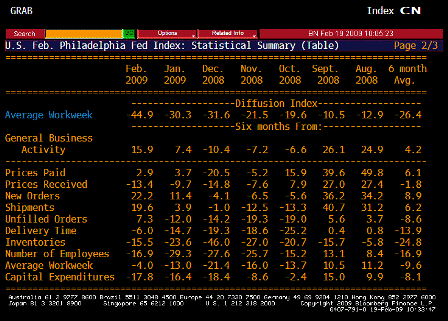
Philadelphia Fed TABLE 2 (Feb)


[top]