2008-07-08 US Economic Releases


[Skip to the end]


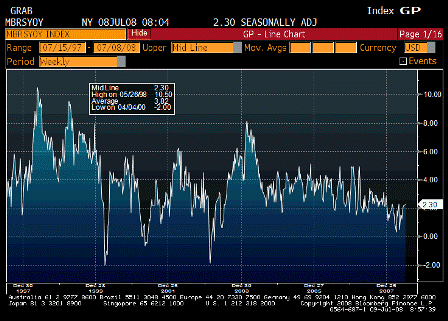
ICSC-UBS Store Sales YoY (Jul 8)

Survey n/a
Actual 2.3%
Prior 2.2%
Revised n/a

Holding up with the rebate checks.

[top][end]


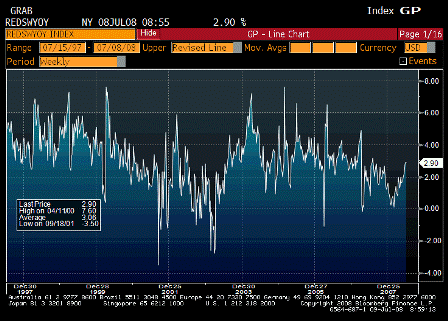
Redbook Sales YoY (Jul 8)

Survey n/a
Actual 2.9%
Prior 2.9%%
Revised n/a

Rebate checks doing their thing.

[top][end]


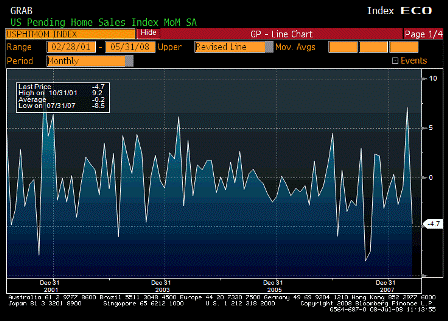
Pending Home Sales MoM (May)

Survey -3.0%
Actual -4.7%
Prior 6.3%
Revised 7.1%

[top][end]

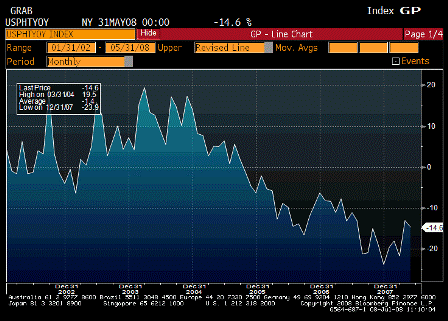
Pending Home Sales YoY (May)

Survey n/a
Actual -14.6%
Prior -13.0%
Revised n/a

Still looks like they may be moving back up to me.
[top][end]


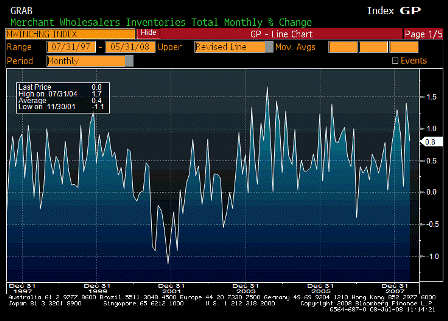
Wholesale Inventories MoM (May)

Survey 0.6%
Actual 0.8%
Prior 1.3%
Revised 1.4%

[top][end]

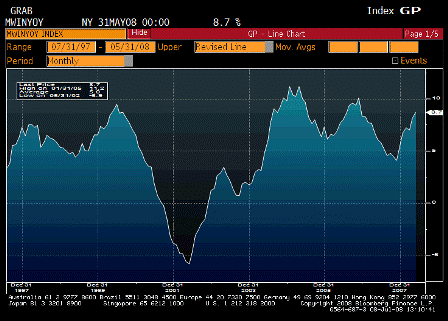
Wholesale Inventories YoY (May)

Survey n/a
Actual 8.7%
Prior 8.1%
Revised n/a

Moving up some but not problematic yet.
[top][end]


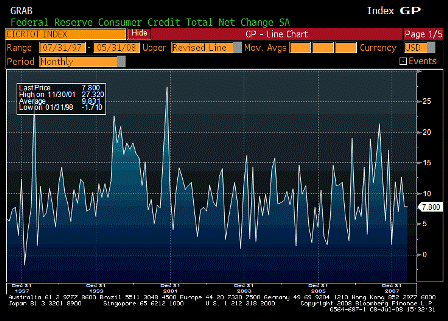
Consumer Credit (May)

Survey $7.5B
Actual $7.8B
Prior $8.9B
Revised $7.8B

[top][end]


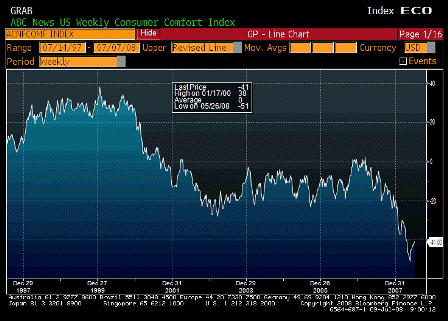
ABC Consumer Confidence (Jul 6)

Survey -43
Actual -41
Prior -43
Revised n/a

Still low but higher than expected and moving up with the rebates.


[top]

2008-06-09 US Economic Releases


[Skip to the end]


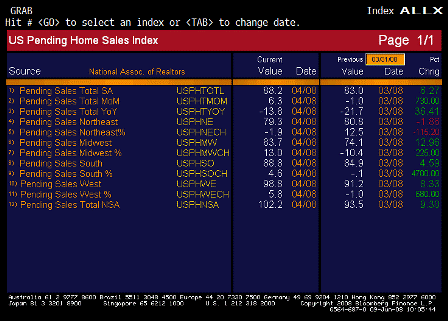
2008-06-09 Pending Home Sales MoM

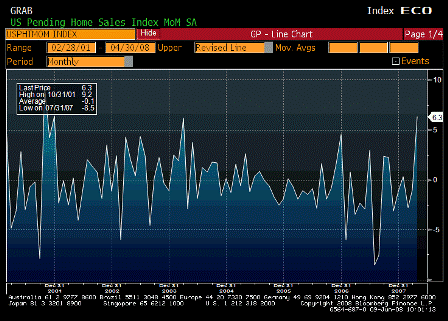
Pending Home Sales MoM (Apr)

Survey -0.4%
Actual 6.3%
Prior -1.0%
Revised n/a

[top][end]


2008-06-09 Pending Home Sales YoY

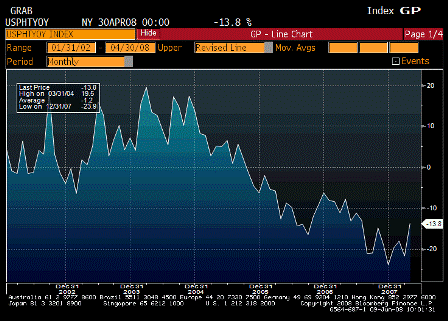
Pending Home Sales YoY (Apr)

Survey n/a
Actual -13.8%
Prior -21.7%
Revised n/a

[top][end]


2008-06-09 Pending Home Sales ALLX

Pending Home Sales ALLX

Yet another better than expected release.

Might be too strong to call this a blow out number, but only because it’s from a low base.

The northeast was about flat, the rest of the regions up.

For a while I’ve been suggesting we bottomed in the Oct/Nov period and it still looks like that could be about right.

Note the large jump in the non seasonally adjusted numbers.

Prices should be (irregularly) moving up as well.

And housing will be expected to subtract less from GDP. Might even start adding soon.

The Fed is getting what it perceives as ‘further and further behind the inflation curve’ as CPI continues higher and GDP moves higher.

And much of the financial sector is getting left behind as the real economy moves forward without it.

Friday’s unemployment info was a lagging indicator and now it’s fading from market memory as well as evidenced by the large increases in market interest rates.


[top]

2008-05-07 US Economic Releases


[Skip to the end]


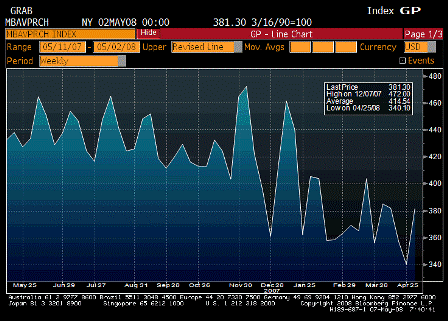
2008-05-07 MBAVPRCH Index

MBAVPRCH Index (May 2)

Survey n/a
Actual 381.3
Prior 340.1
Revised n/a

Seems to have at least stabilized.

[top] [end]


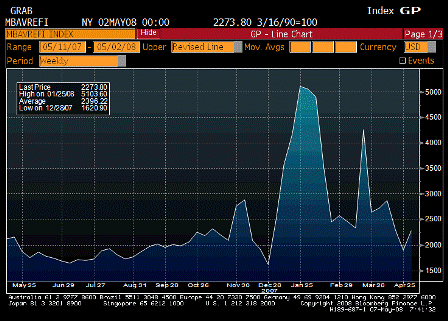
2008-05-07 MBAVREFI Index

MBAVREFI Index (May 2)

Survey n/a
Actual 2773.8
Prior 1905.2
Revised n/a

Doing okay.

[top][end]


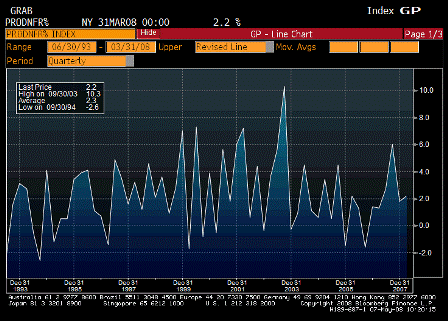
2008-05-07 Nonfarm Productivity

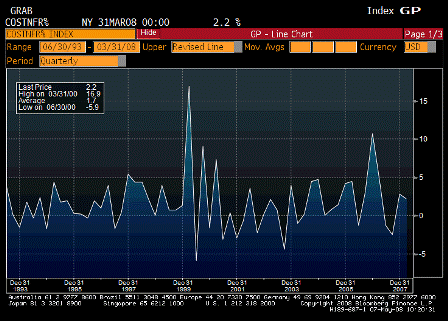
Nonfarm Productivity (1Q P)

Survey 1.5%
Actual 2.2%
Prior 1.9%
Revised 1.8%

Better than expected. Usually rises with output.

[top][end]


2008-05-07 Unit Labor Costs

Unit Labor Costs (1Q P)

Survey 2.6%
Actual 2.2%
Prior 2.6%
Revised 2.8%

Better then expected, prior revised up. This series isn’t doing much.

Look to imports from China for a handle on unit labor costs as well.

[top][end]


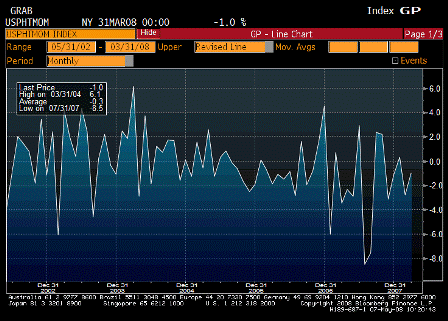
2008-05-07 Pending Home Sales MoM

Pending Home Sales MoM (Mar)

Survey -1.0%
Actual -1.0%
Prior -1.9%
Revised -2.8%

Still falling some, seasonally adjusted, and with actual inventory going down there is less to buy.

[top][end]


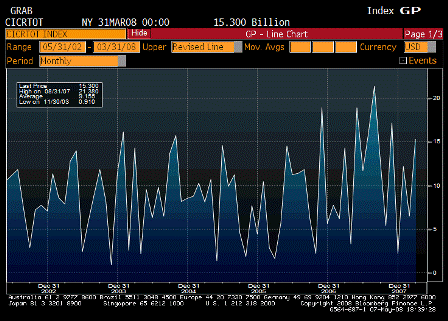
2008-05-07 Consumer Credit

Consumer Credit (Mar)

Survey $6.0B
Actual $15.3B
Prior $5.2B
Revised $6.5B

Volatile series.
Seems to be holding up as incomes hold up.

[top]

2008-04-08 US Economic Releases

COMMENTS TO COME!!

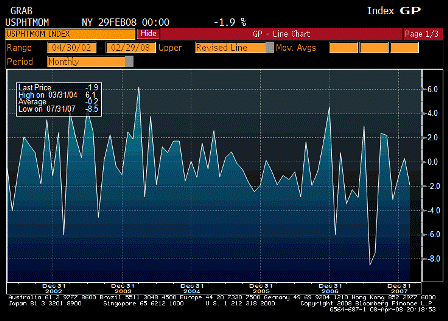
2008-04-08 Pending Home Sales MoM

Pending Home Sales MoM (Feb)

Survey -1.0%
Actual -1.9%
Prior 0.0%
Revised 0.3%

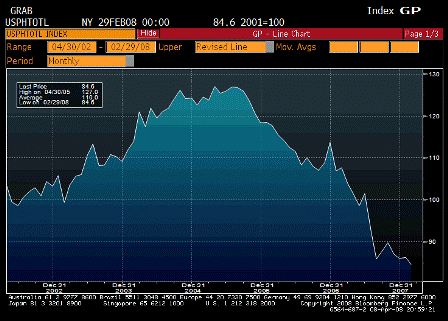
2008-04-08 Pending Home Sales Total SA

Pending Home Sales Total SA

Survey n/a
Actual 84.6
Prior 86.2
Revised n/a

Last month revised to actually being up a tad, but back down this month.

Not going anywhere as of February, but still a winter number.


IBD/TIPP Economic Optimism (Apr)

Survey 41.5
Actual 39.2
Prior 42.5
Revised n/a

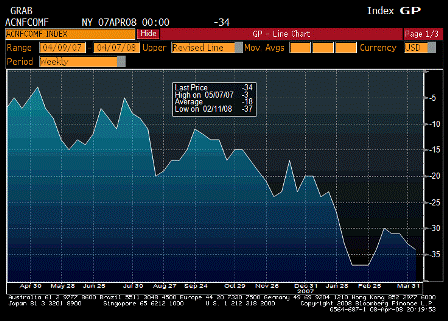
2008-04-08 ABC Consumer Confidence

ABC Consumer Confidence (Apr 6)

Survey n/a
Actual -34
Prior -33
Revised n/a

Still looking to me as turning to the upside. A stable stock market should help a lot.

2008-03-06 US Economic Releases

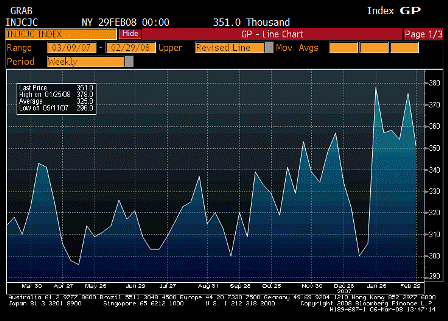
2008-03-06 Initial Jobless Claims

Initial Jobless Claims (Mar 1)

Survey 360K
Actual 351K
Prior 373K
Revised 375K

So far staying near the 4 week average of about 360,000. While higher than before, this is no longer high enough for a large enough output gap to address the now elevated rate of inflation and upward creeping inflation expectations.


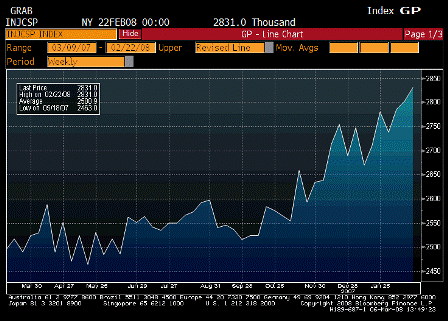
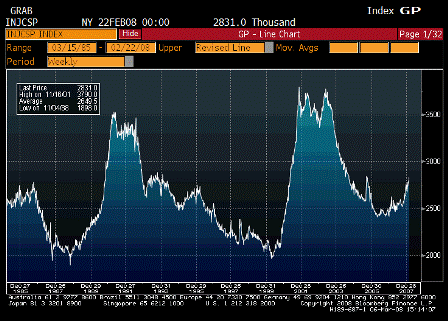
2008-03-06 Continuing Claims

Continuing Claims (Feb 23)

2008-03-06 Continuing Claims since 1985

Continuing Claims since 1985

Survey 2810K
Actual 2831K
Prior 2807K
Revised 2802K

This too, is far to low for an output gap that the Fed may deem necessary to bring down inflation. The longer term chart is more informative in this regard.


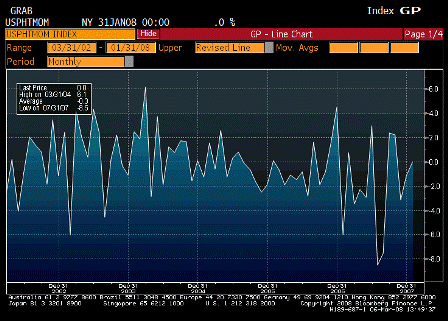
2008-03-06 Pending Home Sales MoM

Pending Home Sales MoM (Jan)

Survey -1.0%
Actual 0.0%
Prior -1.5%
Revised -1.2%

The last thing the Fed needs is for housing to pick up now and shrink the current output gap.
That would put them hundreds of basis points behind the inflation curve.


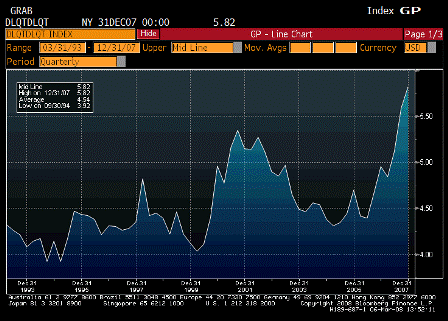
2008-03-06 Mortgage Delinquencies

Mortgage Delinquencies (4Q)

Survey n/a
Actual 5.82%
Prior 5.59%
Revised n/a

Mostly the sub prime buldge, but higher quality mtg delinquencies are up as well. Again, with higher inflation, the Fed needs a larger output gap.


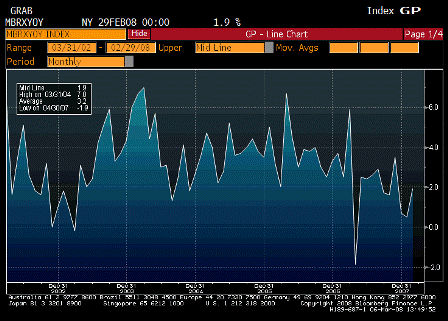
2008-03-06 ICSC Chain Store Sales YoY

ICSC Chain Store Sales YoY (Feb)

Survey 0.6%
Actual 1.9%
Prior 0.5%
Revised n/a

Shows how domestic demand has been moderating over time, but not collapsing to recession levels.

2008-02-07 US Economic Releases

2008-02-07 Initial Jobless Claims

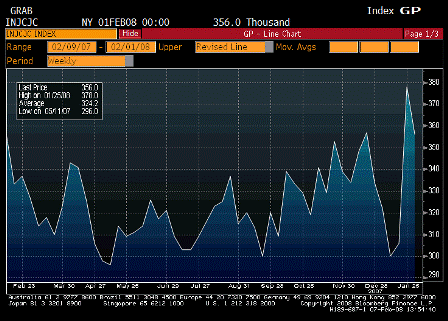
Initial Jobless Claims (Feb 2)

Survey 342K
Actual 356K
Prior 375K
Revised 378K

Moving down, but will need to fall more next week to signal employment is doing reasonably well.


2008-02-07 Continuing Claims

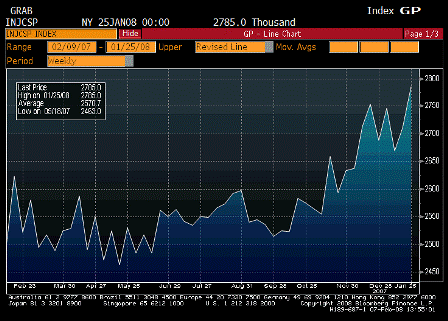
Continuing Claims (Jan 26)

Survey 2715K
Actual 2785K
Prior 2716K
Revised -2710K

Back up a bit, but not through the highs, and reflects lasts weeks higher claims.


2008-02-07 Total Pending Home Sales SA

Total Pending Home Sales SA (Dec)

Survey -1.0%
Actual -1.5%
Prior -2.6%
Revised -3.0%

Down some, but not through the lows. October/November may still have been the bottom of housing.


2008-02-07 ICSC Chain Store Sales YoY

ICSC Chain Store Sales YoY (Jan)

Survey 0.8%
Actual 0.5%
Prior 0.9%
Revised n/a

Been drifting lower for quite a while. Part of the expected softening of domestic demand since Q2 2006.


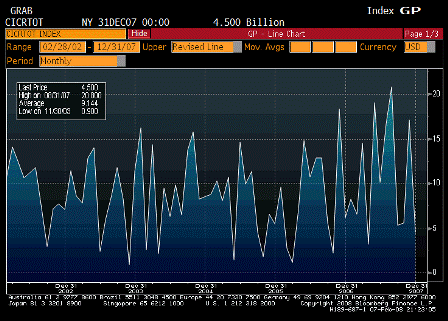
2008-02-07 Consumer Credit

Consumer Credit (Dec)

Survey $7.4B
Actual $4.5B
Prior $15.4B
Revised $17.1B

♥

2008-01-08 US Economic Releases

2008-01-08 Pending Sales Total SA

Pending Home Sales Total SA

Survey -0.7%
Actual -2.6%
Prior 0.6%
Revised n/a

Down a touch but not through the lows, could still be forming a bottom.


ibd-tipp-economic-optimism-graph.gif

Economic
Outlook
Personal
Financial
Outlook
Federal
Economic
Policies
Overall
Jan. 2008 31.4 55.7 42.7 43.2
Dec. 2007 32.1 58.3 42.7 44.4
Nov. 2007 30.8 53.5 47.1 43.8
Oct. 2007 38.5 58.2 45.1 47.3
Sept. 2007 37.9 59.3 47.3 48.2
Aug. 2007 40.3 59.8 48.5 49.5
July 2007 39.5 58.3 46.8 48.2
June 2007 41.3 58.9 47.1 49.1
May 2007 39.1 57.6 47.3 48
April 2007 34.9 56.2 45.3 45.5
March 2007 41.5 61.1 49.8 50.8
Feb. 2007 46.4 60.8 51 52.7

IBD/TIPP Economic Optimism (Jan) TABLE

Survey 43.0
Actual 43.2
Prior 44.4
Revised n/a

Speaks for itself…


2008-01-08 Consumer Credit Net Net Change

Consumer Credit Total Net Change

Survey $8.0B
Actual $15.4B
Prior $4.7B
Revised $2.0B

Explains November spending strength and probably borrowed from December due to how the holidays fell.


2008-01-08 ABC Consumer Confidence

ABC Consumer Confidence

Survey -20
Actual -20
Prior -20
Revised n/a

♥