2009-04-07 USER


[Skip to the end]


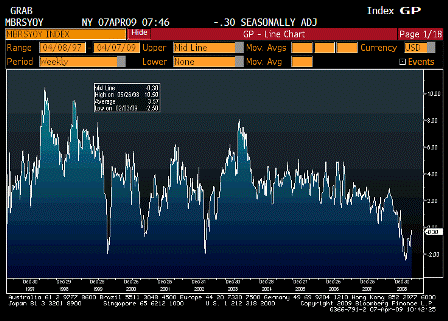
ICSC UBS Store Sales YoY (Apr 7)

Survey n/a
Actual -0.3%
Prior -0.2%
Revised n/a

[top][end]

ICSC UBS Store Sales WoW (Apr 7)

Survey n/a
Actual 0.6%
Prior 1.1%
Revised n/a

[top][end]

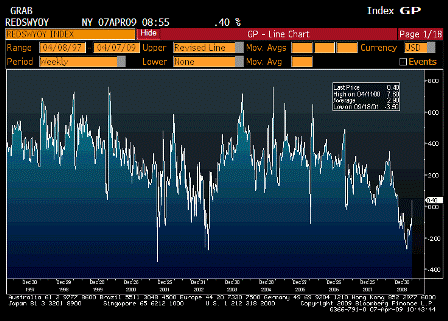
Redbook Store Sales Weekly YoY (Apr 7)

Survey n/a
Actual 0.4%
Prior -0.6%
Revised n/a

[top][end]

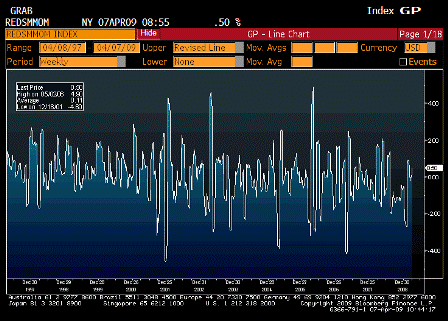
Redbook Store Sales MoM (Apr 7)

Survey n/a
Actual 0.5%
Prior 0.2%
Revised n/a

[top][end]

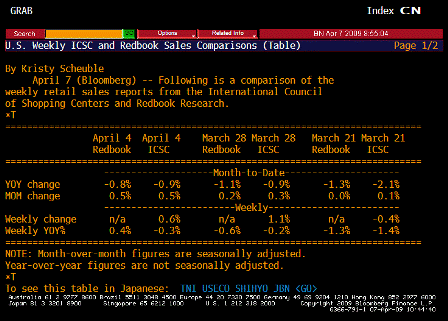
ICSC UBS Redbook Comparison TABLE (Apr 7)

[top][end]

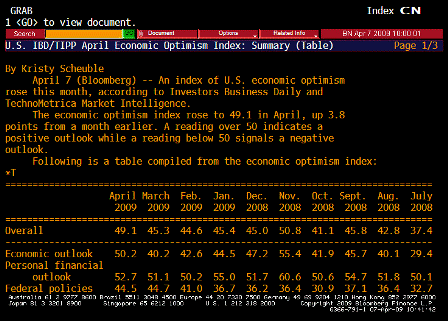
IBD TIPP Economic Optimism (Apr)

Survey 45.8
Actual 49.1
Prior 45.3
Revised n/a


[top]

2009-03-10 USER


[Skip to the end]


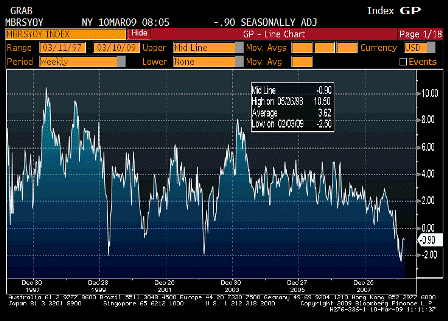
ICSC UBS Store Sales YoY (Mar 10)

Survey n/a
Actual -0.9%
Prior -0.8%
Revised n/a

[top][end]

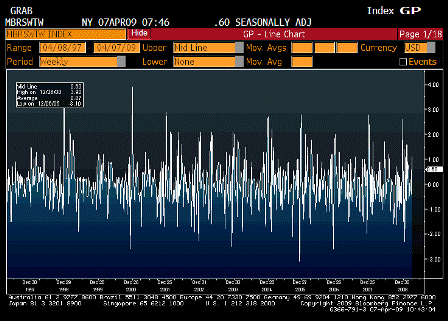
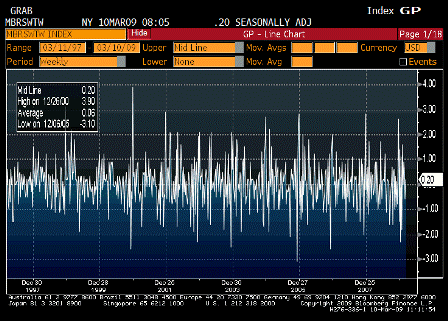
ICSC UBS Store Sales WoW (Mar 10)

Survey n/a
Actual 0.2%
Prior -0.6%
Revised n/a

[top][end]

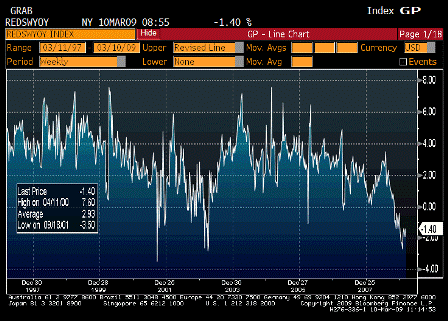
Redbook Store Sales Weekly YoY (Mar 10)

Survey n/a
Actual -1.4%
Prior -1.9%
Revised n/a

[top][end]

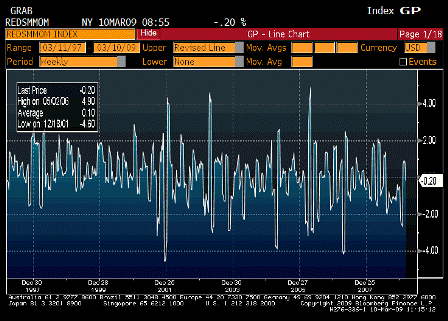
Redbook Store Sales MoM (Mar 10)

Survey n/a
Actual -0.2%
Prior 0.8%
Revised n/a

[top][end]

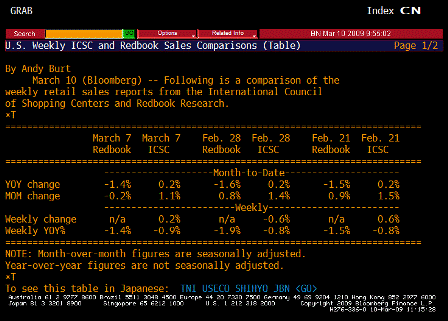
ICSC UBS Redbook Comparison TABLE (Mar 10)

[top][end]

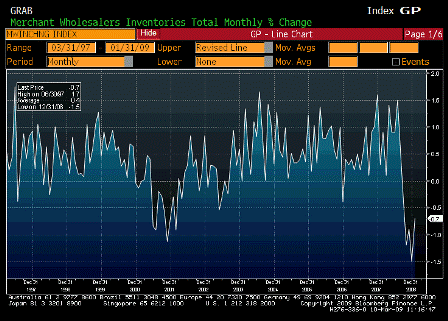
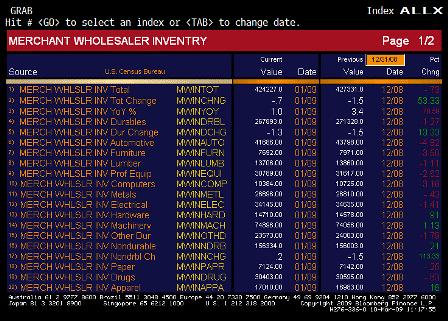
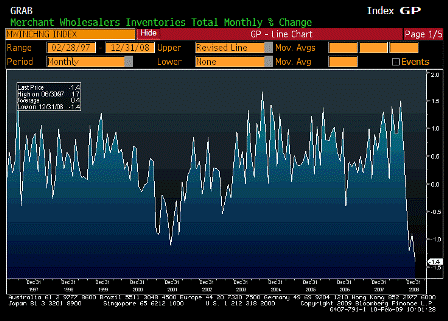
Wholesale Inventories MoM (Jan)

Survey -1.0%
Actual -0.7%
Prior -1.4%
Revised -1.5%

[top][end]

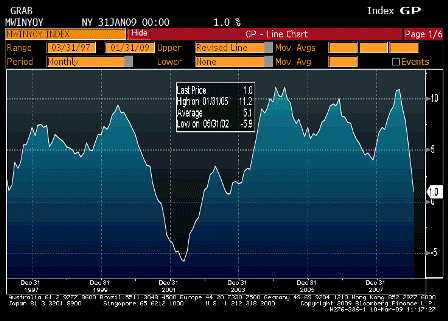
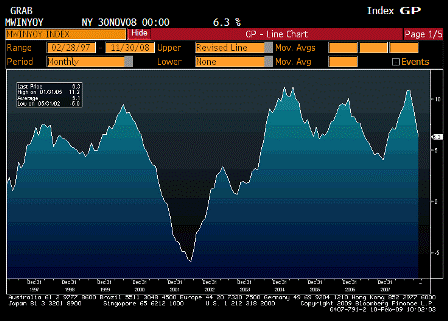
Wholesale Inventories YoY (Jan)

Survey n/a
Actual 1.0%
Prior 3.4%
Revised n/a

[top][end]

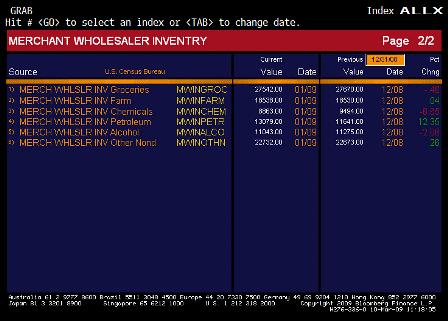
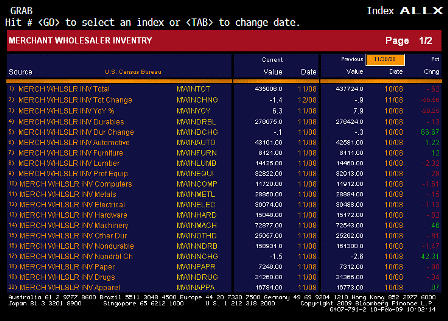
Wholesale Inventories ALLX 1 (Jan)

[top][end]

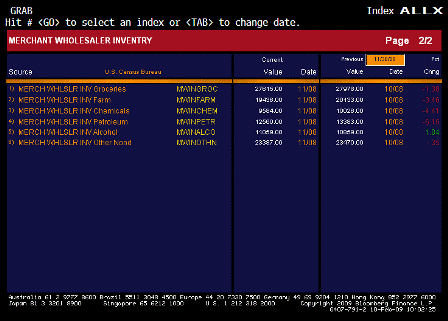
Wholesale Inventories ALLX 2 (Jan)

[top][end]

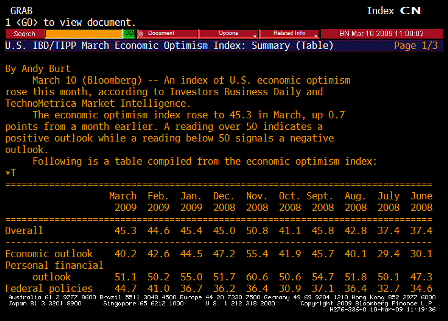
IBD TIPP Economic Optimism (Mar)

Survey 43.0
Actual 45.3
Prior 44.6
Revised n/a


[top]

2009-02-10 USER


[Skip to the end]


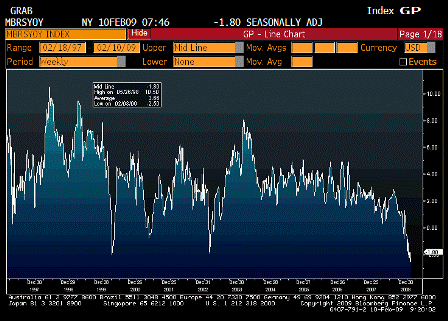
ICSC UBS Store Sales YoY (Feb 10)

Survey n/a
Actual -1.80%
Prior -2.50%
Revised n/a

[top][end]

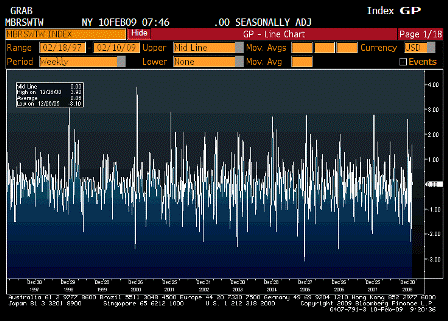
ICSC UBS Store Sales WoW (Feb 10)

Survey n/a
Actual 0.00%
Prior 1.60%
Revised n/a

[top][end]

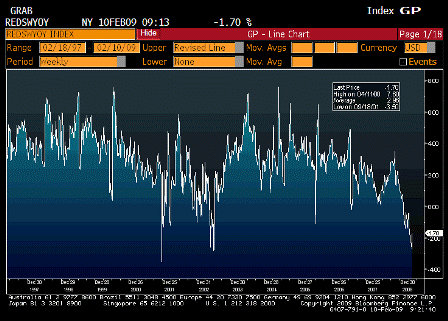
Redbook Store Sales Weekly YoY (Feb 10)

Survey n/a
Actual -1.70%
Prior -2.70%
Revised n/a

[top][end]

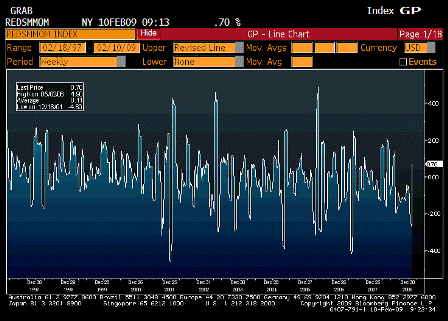
Redbook Store Sales MoM (Feb 10)

Survey n/a
Actual 0.70%
Prior -2.70%
Revised n/a

[top][end]

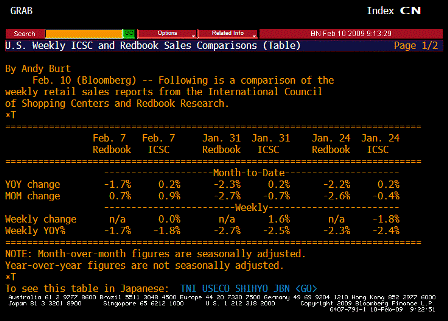
ICSC UBS Redbook Comparison TABLE (Feb 10)

[top][end]

Wholesale Inventories MoM (Dec)

Survey -0.7%
Actual -1.4%
Prior -0.6%
Revised -0.9%

[top][end]

Wholesale Inventories YoY (Dec)

Survey n/a
Actual 6.3%
Prior 7.9%
Revised n/a

[top][end]

Wholesale Inventories ALLX 1 (Dec)

[top][end]

Wholesale Inventories ALLX 2 (Dec)

[top][end]

IBD TIPP Economic Optimism (Feb)

Survey 44.0
Actual 44.6
Prior 45.4
Revised n/a


[top]

2009-01-13 USER


[Skip to the end]

 
Even with lower fuel prices it keeps getting worse.


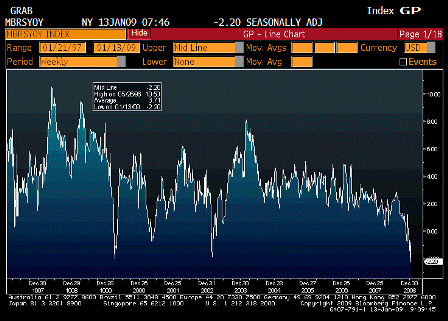
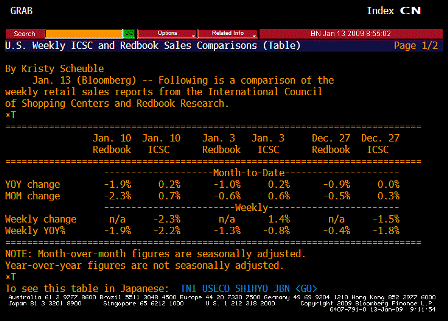
ICSC UBS Store Sales YoY (Jan 13)

Survey n/a
Actual -2.20%
Prior -0.80%
Revised n/a

[top][end]

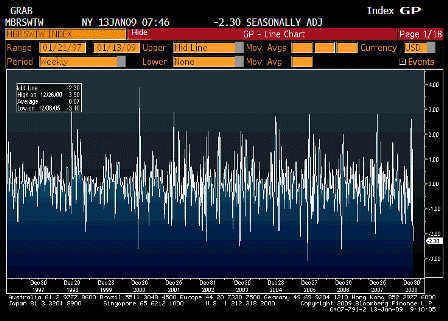
ICSC UBS Store Sales WoW (Jan 13)

Survey n/a
Actual -2.30%
Prior 1.40%
Revised n/a

[top][end]

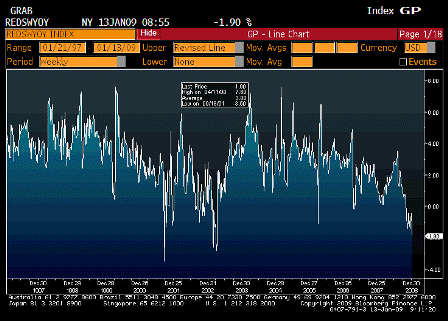
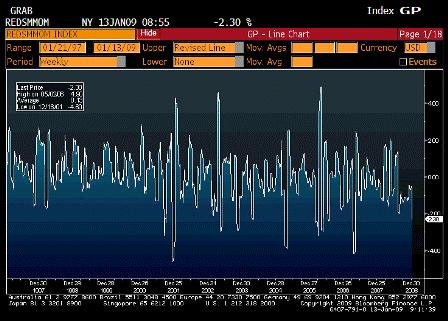
Redbook Store Sales Weekly YoY (Jan 13)

Survey n/a
Actual -1.90%
Prior -1.30%
Revised n/a

[top][end]

Redbook Store Sales MoM (Jan 13)

Survey n/a
Actual -2.30%
Prior -0.60%
Revised n/a

[top][end]

ICSC UBS Redbook Comparison TABLE (Jan 13)

[top][end]


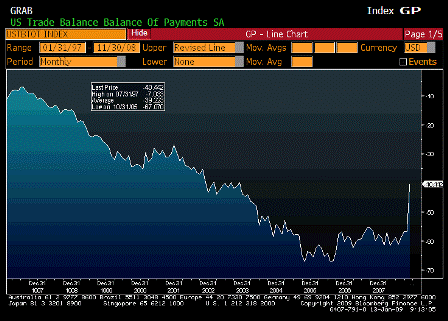
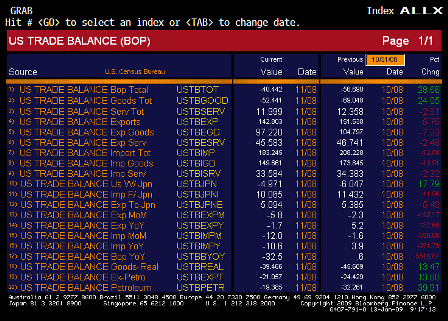
Trade Balance (Nov)

Survey -$51.0B
Actual -$40.4B
Prior -$57.2B
Revised -$56.7B

[top][end]

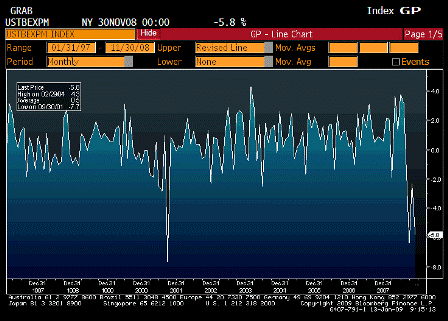
Exports MoM (Nov)

Survey n/a
Actual -5.8%
Prior -2.3%
Revised n/a

[top][end]

Imports MoM (Nov)

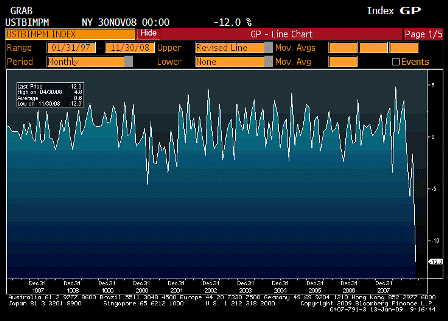
Survey n/a
Actual -12.0%
Prior -1.6%
Revised n/a

[top][end]

Exports YoY (Nov)

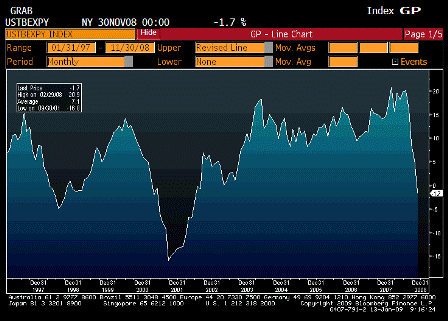
Survey n/a
Actual -1.7%
Prior 5.2%
Revised n/a

[top][end]

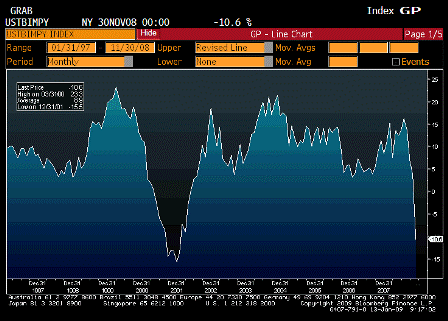
Imports YoY (Nov)

Survey n/a
Actual -10.6%
Prior 3.9%
Revised n/a

[top][end]

Trade Balance ALLX (Nov)

[top][end]


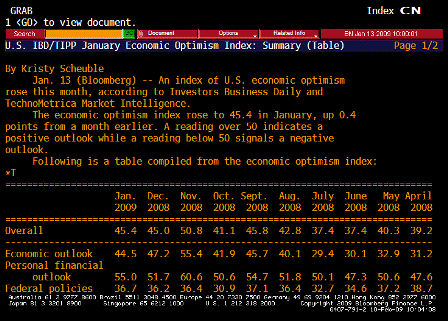
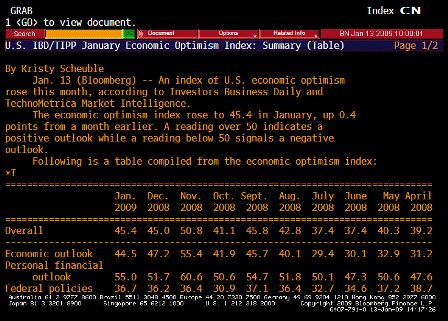
IBD TIPP Economic Optimism (Jan)

Survey 44.0
Actual 45.4
Prior 45.0
Revised n/a

[top][end]


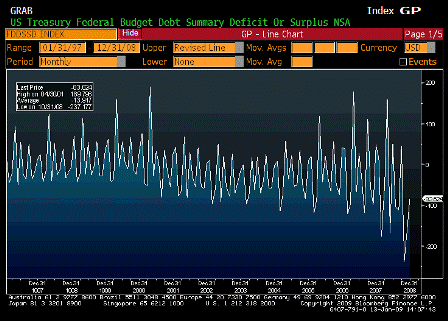
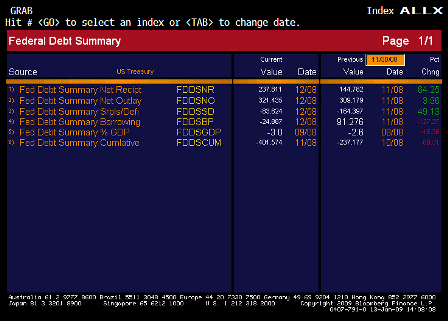
Monthly Budget Statement (Dec)

Survey -$83.0B
Actual -$83.6B
Prior -$48.3B
Revised n/a

[top][end]

Monthly Budget Statement ALLX (Dec)


[top]

2008-08-12 US Economic Releases


[Skip to the end]


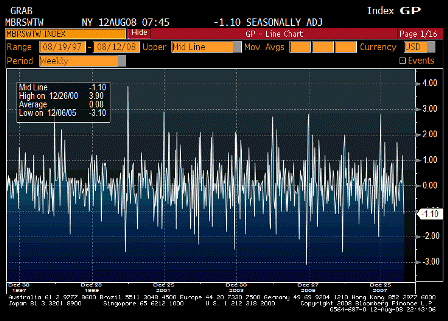
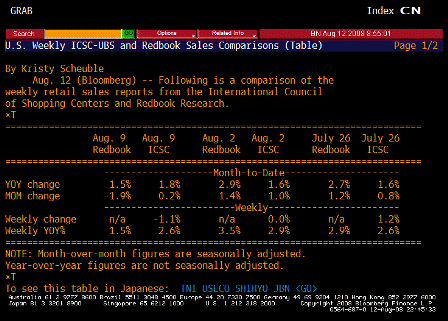
ICSC-UBS Store Sales WoW (Aug 12)

Survey n/a
Actual -1.1%
Prior 0.0%
Revised n/a

[top][end]

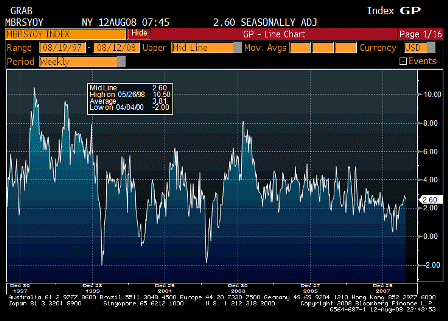
ICSC-UBS Store Sales YoY (Aug 12)

Survey n/a
Actual 2.6%
Prior 2.9%
Revised n/a

Year over year looking fine.

[top][end]

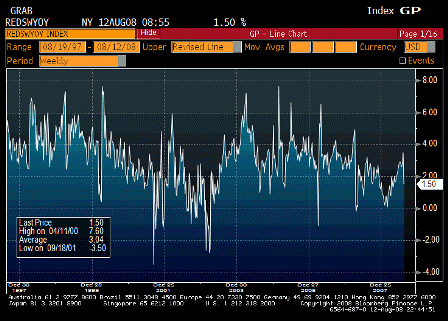
Redbook Store Sales Weekly YoY (Aug 12)

Survey n/a
Actual 1.5%
Prior 3.5%
Revised n/a

Softer but no collapse.

[top][end]

ICSC-UBS Redbook Comparisson TABLE (Aug 12)

[top][end]


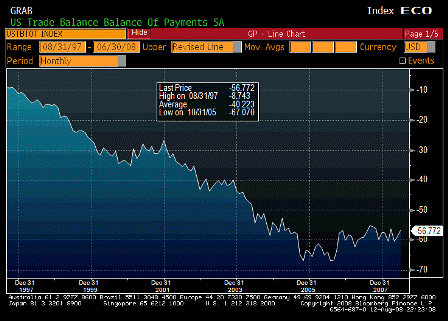
Trade Balance (Jun)

Survey -$62.0B
Actual -$56.8B
Prior -$59.8B
Revised -$59.2B

Lower than expected and moving lower even with crude prices up in June.

I still think last months number was too high which is part of the reason for the June drop.

[top][end]

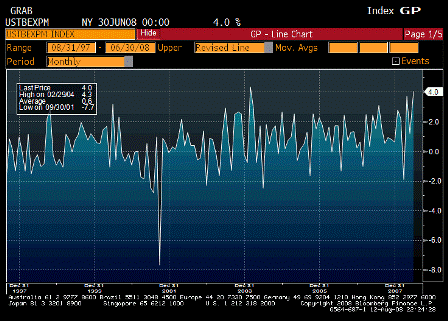
Exports MoM (Jun)

Survey n/a
Actual 4.0%
Prior 1.2%
Revised n/a

Government and exports continue to support GDP.

Q2 now looking to be revised to maybe north of 3%.

[top][end]

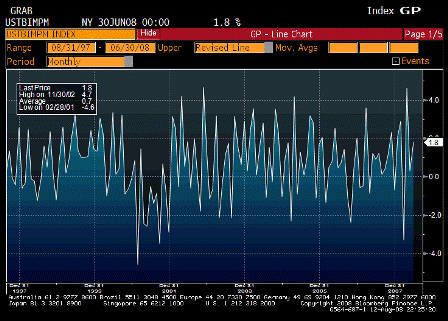
Imports MoM (Jun)

Survey n/a
Actual 1.8%
Prior 0.3%
Revised n/a

Up due to crude and gasoline prices.

[top][end]

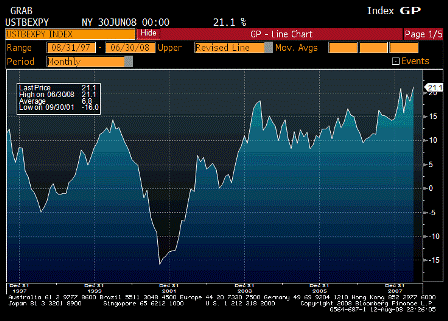
Exports YoY (Jun)

Survey n/a
Actual 21.1%
Prior 18.2%
Revised n/a

Looking more like an export economy every day. Weak domestic consumption and ok employment.

Workers earn enough to drive to work and eat, and the rest of their output gets exported to someone else.

[top][end]

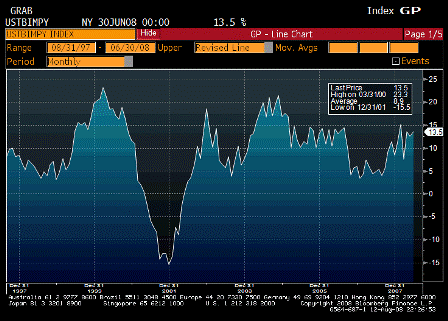
Imports YoY (Jun)

Survey n/a
Actual 13.5%
Prior 12.5%
Revised n/a

Mostly petro and product prices.

Other imports are down.

[top][end]

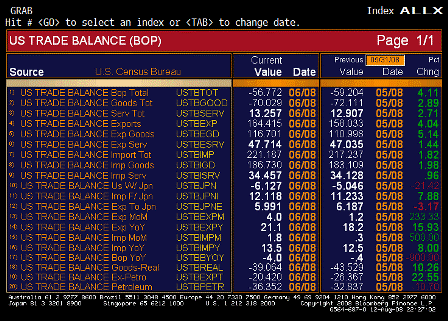
Trade Balance ALLX (Jun)

Ex petro down to about 20 billion.

[top][end]


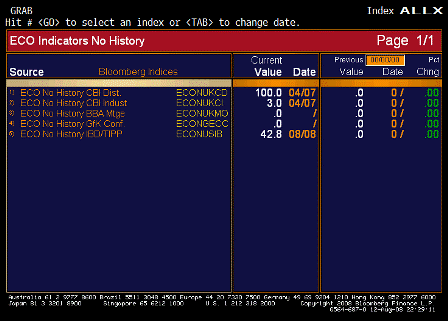
IBD-TIPP Economic Optimism (Aug)

Survey 39.0
Actual 42.8
Prior 37.4
Revised n/a

Up some, but less than expected.

[top][end]


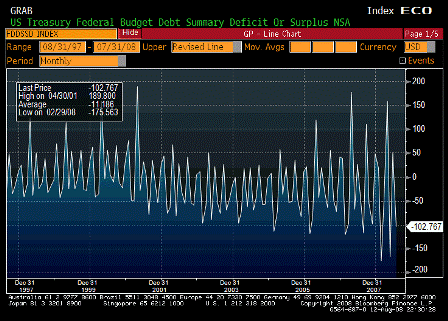
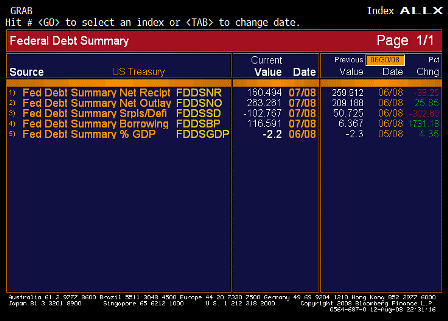
Monthly Budget Statement (Jul)

Survey -$95.0B
Actual -$102.8B
Prior -$36.4B
Revised n/a

Government spending and exports supporting GDP more than most anticipate.

[top][end]

Monthly Budget Statement ALLX (Jul)

[top][end]


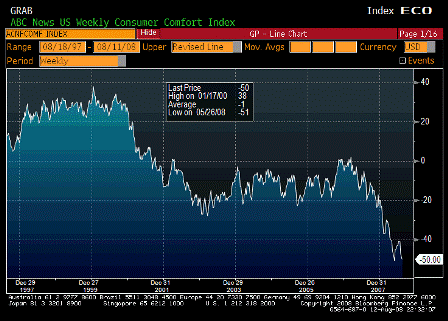
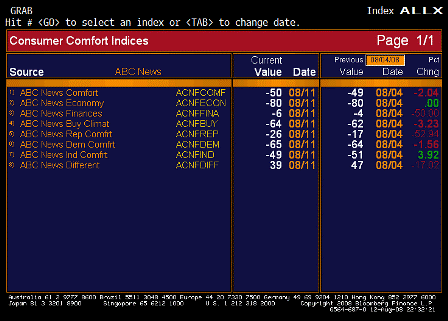
ABC Consumer Confidence (Aug 10)

Survey n/a
Actual -50
Prior -49
Revised n/a

Bumping along the bottom.

Inflation hurting confidence as wages remain ‘well contained’.

[top][end]

ABC Consumer Confidence ALLX (Aug 10)


[top]

2008-07-15 US Economic Releases


[Skip to the end]


ICSC-UBS Store Sales YoY (Jun)

Survey n/a
Actual 2.2%
Prior 2.3%
Revised n/a

Fiscal spending seems to have stemmed the decline.

[top][end]
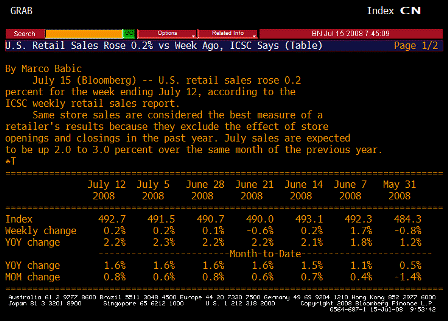
ICSC-UBS Store Sales TABLE (Jun)

Same.

[top][end]
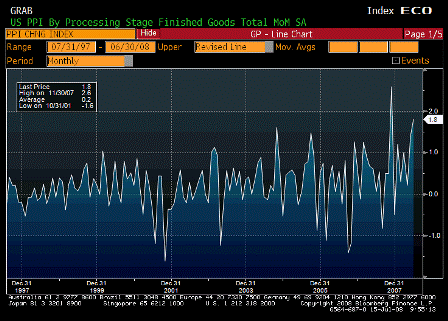

Producer Price Index MoM (Jun)

Survey 1.4%
Actual 1.8%
Prior 1.4%
Revised n/a

Looks like a banana republic with a weak currency.

[top][end]
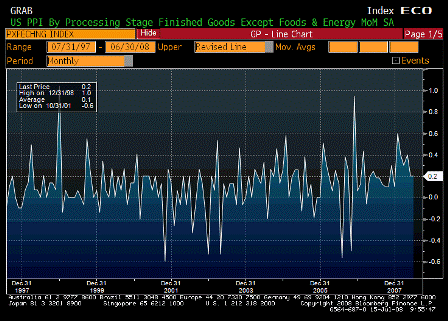
PPI Ex Food & Energy MoM (Jun)

Survey 0.3%
Actual 0.2%
Prior 0.2%
Revised n/a

Also looks to be working its way higher.

[top][end]
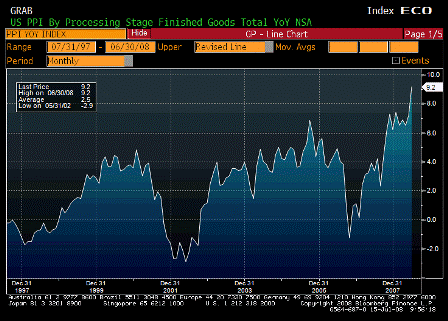
Producer Price Index YoY (Jun)

Survey 8.7%
Actual 9.2%
Prior 7.2%
Revised n/a

Inflation pouring in through the front door – import prices.

[top][end]
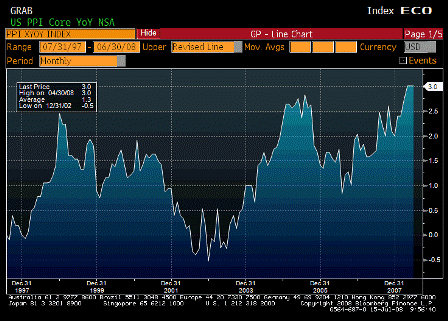
PPI Ex Food & Energy YoY (Jun)

Survey 3.2%
Actual 3.0%
Prior 3.0%
Revised n/a

Looking like its on the way up, as it’s recovered and surpassed the level of Aug 06 when Goldman changed their commodity index and triggered massive selling of gasoline.

The Fed is watching for headline to leak into core, which they’ve said is already happening.

When only food/crude/import prices go up, it’s a relative value story, as funds to buy that stuff mean less to buy other things, and they lag in price.

But in this case core measures are not going down to offset headline numbers.

True, they haven’t gone up that much yet, but they have gone up rather than down.

That means that yes, demand is ‘weak’ and unemployment creeping up,

But demand is still strong enough to support both higher headline CPI and rising core measures as well,

Supported by government spending which is not revenue constrained nor liquidity constrained,

And supported by booming exports as non residents trip over each other trying to spend their now unwanted multi $trillion hoard of US financial assets.

Current levels of demand are more than sufficient to support much higher levels of housing starts (though still low levels), relatively flat employment, and rising core inflation measures.

And US real terms of trade continue to deteriorate along with the standard of living as a foreign oil monopolist exacts ever higher relative prices.

[top][end]
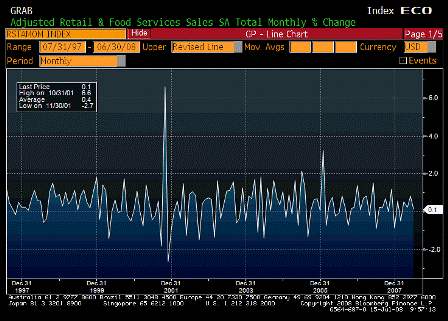

Advance Retail Sales MoM (Jun)

Survey 0.4%
Actual 0.1%
Prior 1.0%
Revised 0.8%

Lower than expected, due to weaker than expected auto sales, due to the wrong vehicles on the showroom floors, which will take a while to correct.

[top][end]
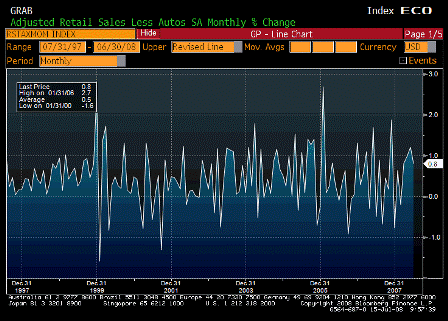
Retail Sales Less Autos MoM (Jun)

Survey 1.0%
Actual 0.8%
Prior 1.2%
Revised n/a

A little weaker than expected but pretty good from a strong previous month.

[top][end]
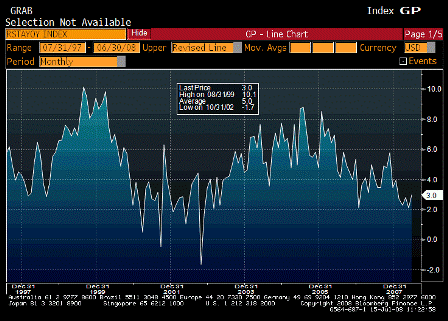
Advance Retail Sales YoY (Jun)

Survey n/a
Actual 3.0%
Prior 2.1%
Revised n/a

Once again fiscal policy, not monetary policy, stops the slide.

[top][end]
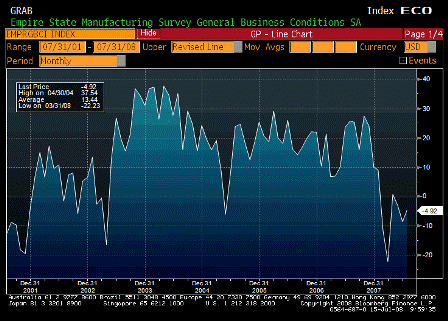

Empire Manufacturing (Jul)

Survey -8.0%
Actual -4.9%
Prior -8.7%
Revised n/a

May be on the mend from the lows.

Karim writes:

  • Retail sales a bit softer than expected..up 0.1% headline, up 0.8% ex-autos, and -0.5% ex-gas
  • Control (ex-autos, gas and building materials) up 0.3% and minor downward revisions to prior two months
  • PPI up 1.8% headline and 0.2% core; y/y 9.2% and 3.0% respectively
  • Pipeline pressures remain intense with intermediate up 2.1% m/m and crude 3.7%
  • Medical goods and services component decline (large component of PCE deflator; so June core PCE may come in 0.0% or 0.1%).
  • Empire survey shows modest improvement but stays in negative territory: -8.68 to -4.92
  • Right, Redbook sales show same moderate growth in non-auto sales. The wrong vehicles are on the showroom floors right now and it will take a while for the right ones to take their place.

    I have no idea what’s driving lower medical costs and whether further declines are to be expected, but seems highly unlikely.

    The dollar’s down again today.

    ‘Inflation’ is flowing in through that channel like water through a screen door on a submarine.

    [top][end]
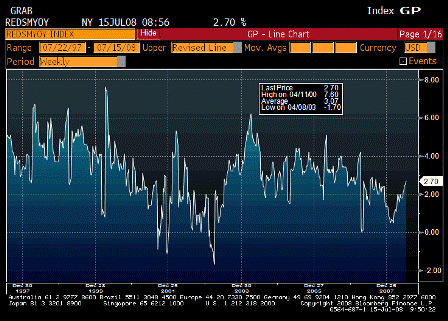

    Redbook Store Sales (Jul 8)

    Survey n/a
    Actual 2.7%
    Prior 2.6%
    Revised n/a

    Moving up as fiscal policy kicks in.

    [top][end]
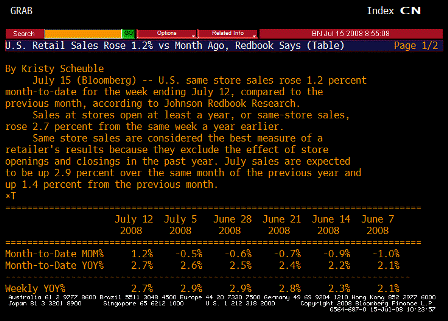
    Redbook Store Sales TABLE (Jul 8)

    [top][end]


    IBD/TIPP Economics Optimism (Jul)

    Survey 36.8
    Actual 37.4
    Prior 37.4
    Revised n/a

    A little better than expected.

    [top][end]
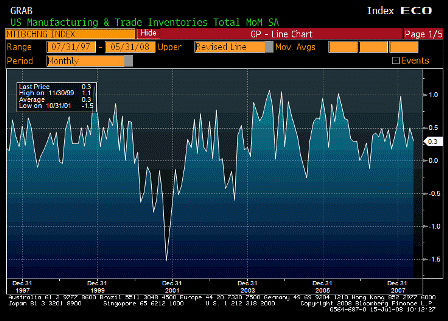

    Business Inventories (May)

    Survey 0.5%
    Actual 0.3%
    Prior 0.5%
    Revised n/a

    Possible that sales may be exceeding estimates and lowering inventories.

    [top][end]
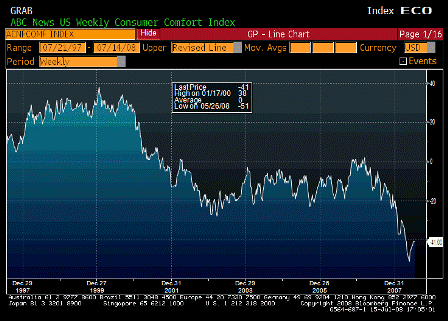

    ABC Consumer Confidence (Jul 13)

    Survey -41
    Actual -41
    Prior -41
    Revised n/a

    Seems to have bottomed, but remains at low levels, probably due to inflation.


    [top]
2008-05-20 US Economic Releases


[Skip to the end]

Whether the ‘definitions’ call the food and energy price hikes ‘inflation’ or not, they are still problematic.

There are two choices for government: try to sustain aggregate demand or try to reduce aggregate demand.

Currently, the policy is to say ‘inflation’ is not a problem and try to sustain aggregate demand, as evidenced by the tax rebates and Fed rate cuts.
(NOTE: I don’t think rate cuts add to demand, but the Fed does.)

And as oil climbs in price, markets discount lower rates from the Fed (markets also think lower rates add to demand).

And, for another fiscal example, Obama speaks of tax cuts for the middle class so people can pay for their food and energy. Adding to demand like that will drive prices up further.

Supply responses aren’t particularly price sensitive in the short run; so, crude could go up a lot more before something like pluggable hybrids in sufficient quantities cut demand for gasoline by the 5-10 million bpd necessary to break the rise in crude prices.

And by that time the pass throughs to the rest of the economy (yes, including housing and wages) will be well entrenched.

The other choice for government is to cut aggregate demand. This means tax hikes or spending cuts, and a deep, ugly recession to hopefully cut demand for gasoline that way. Looks even more painful and less promising, if that’s possible.

I have suggested cutting demand for gasoline with a ‘non-price’ policy of setting the national speed limit at 30 mph for private transportation. This is a conceptual extension of policies mandating mpg, etc. It will cut gasoline demand by perhaps 5 million bpd and if adopted world wide more than that, but has yet to even enter the national debate.

So it will be a debate between adding to aggregate demand and cutting aggregate demand – like choosing whether you want to get shot with a revolver or an automatic.

The days are numbered for current bias to add to demand – the limits of ‘inflation’ tolerance aren’t far away. We are only now probably seeing the pass through from $60 crude. There is much more to come, and for several years. And in hindsight, the current policy of adding to demand will at best be considered an error of judgment.


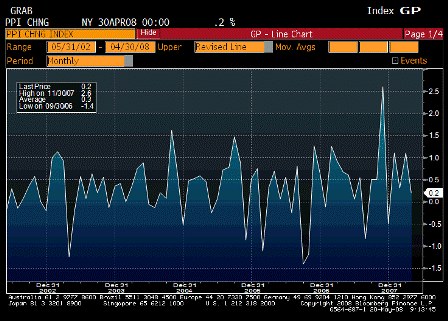
2008-05-20 Producer Price Index MoM

Producer Price Index MoM (Apr)

Survey 0.4%
Actual 0.2%
Prior 1.1%
Revised n/a

[top][end]


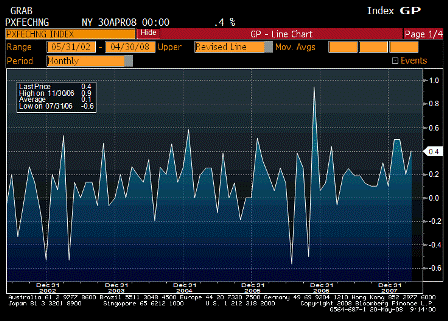
2008-05-20 PPI Ex Food & Energy MoM

PPI Ex Food & Energy MoM (Apr)

Survey 0.2%
Actual 0.4%
Prior 0.2%
Revised n/a

[top][end]


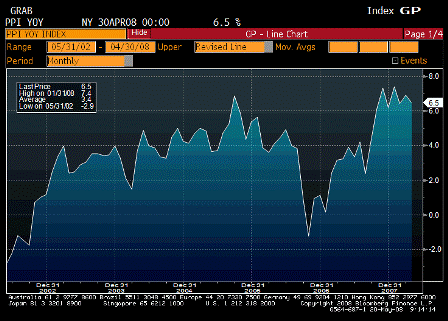
2008-05-20 Producer Price Index YoY

Producer Price Index YoY (Apr)

Survey 6.7%
Actual 6.5%
Prior 6.9%
Revised n/a

This all either gets passed through to all other prices (inflation) or real terms of trade deteriorate further – both unpleasant at best.

[top][end]


2008-05-20 PPI Ex Food & Energy YoY

PPI Ex Food & Energy YoY (Apr)

Survey 2.9%
Actual 3.0%
Prior 2.7%
Revised n/a

The pass through has started and has long way to go just based on current energy prices.

[top][end]


IBD/TIPP Economic Optimism (May)

Survey 37.8
Actual 40.3
Prior 39.2
Revised

Add one more to the ‘better than expected’ list.

[top][end]


ABC Consumer Confidence (May 18)

Survey
Actual
Prior 2.9%
Revised

[comments]


[top]