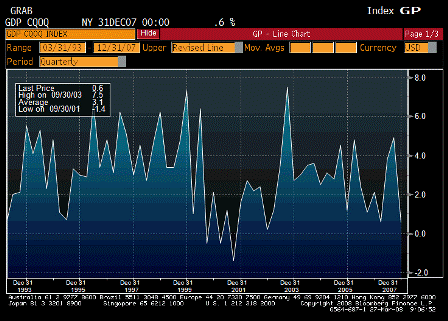
- GDP QoQ Annualized (Released 8:30 EST)
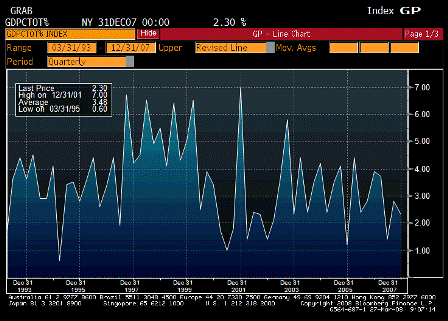
- GDP YoY Annualized Real (Released 8:30 EST)
- GDP YoY Annualized Nominal (Released 8:30 EST)
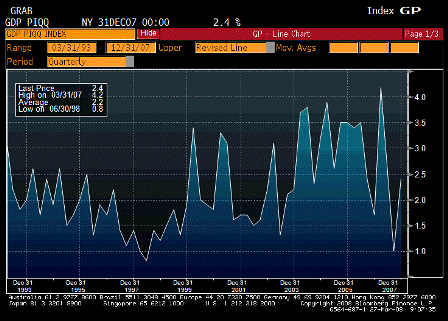
- GDP Price Index (Released 8:30 EST)
- GDP ALLX (Released 8:30 EST)
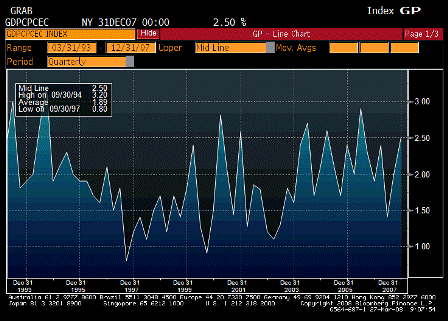
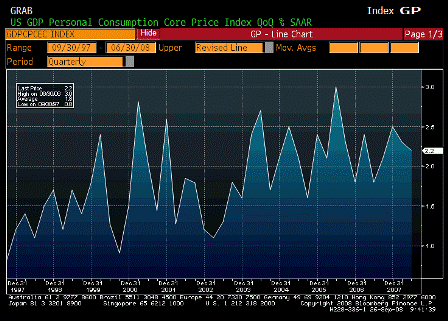
- Core PCE QoQ (Released 8:30 EST)
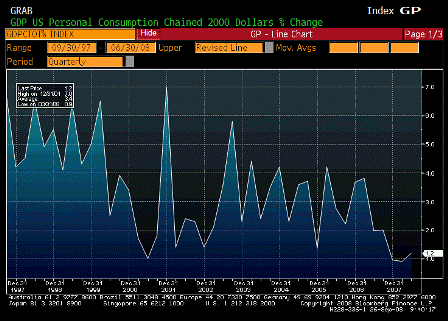
- Personal Consumption (Released 8:30 EST)
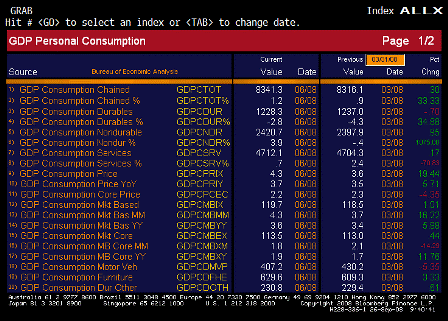
- Personal Consumption ALLX 1 (Released 8:30 EST)
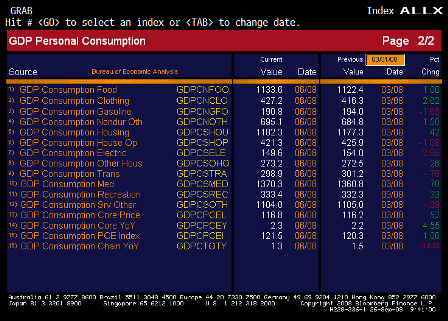
- Personal Consumption ALLX 2 (Released 8:30 EST)
- Univ. of Michigan Confidence (Released 10:00 EST)
- 1 Year Inflation Expectations (Released 10:00 EST)
- 5 Year Inflation Expectations (Released 10:00 EST)
- Univ. of Michigan TABLE Inflation Expectations (Released 10:00 EST)
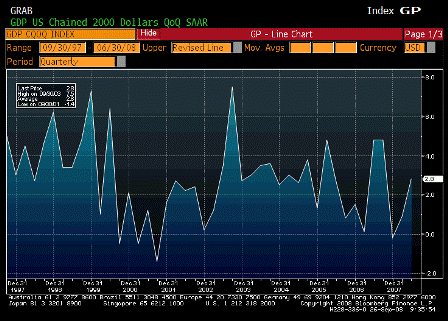
GDP QoQ Annualized (2Q F)
| Survey | 3.3% |
| Actual | 2.8% |
| Prior | 3.3% |
| Revised | n/a |
Growth lower than expected, but still ok.
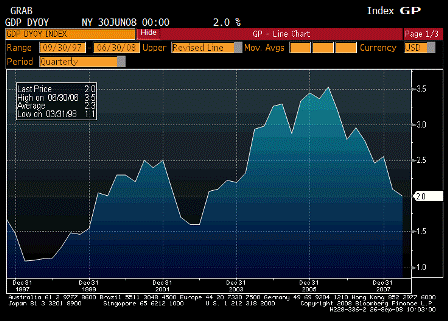
GDP YoY Annualized Real (2Q F)
| Survey | n/a |
| Actual | 2.0% |
| Prior | 2.1% |
| Revised | n/a |
Still above recession levels, but still not looking that healthy.
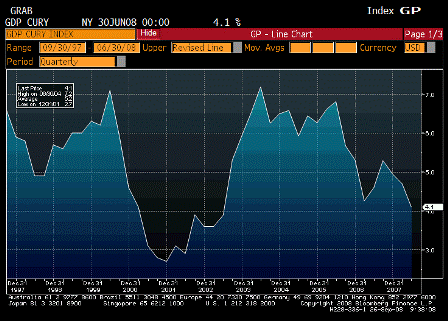
GDP YoY Annualized Nominal (2Q F)
| Survey | n/a |
| Actual | 4.1% |
| Prior | 4.7% |
| Revised | n/a |
Nominal GDP falling, but not yet to previous recession levels.
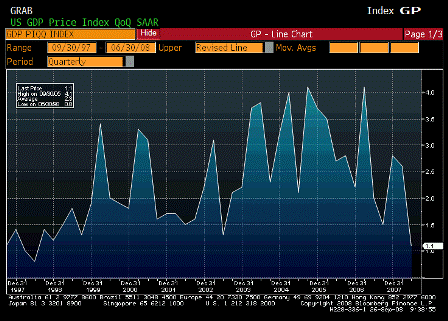
GDP Price Index (2Q F)
| Survey | 1.2% |
| Actual | 1.1% |
| Prior | 1.2% |
| Revised | n/a |
A little better than expected, but this series doen’t carry much weight.
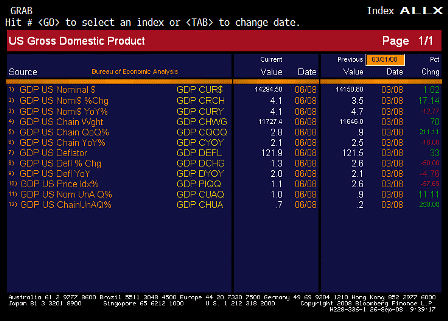
GDP ALLX (2Q F)
Core PCE QoQ (2Q F)
| Survey | 2.1% |
| Actual | 2.2% |
| Prior | 2.1% |
| Revised | n/a |
A bit higher than expected, and the Fed does watch this one closely. They want it under 2%.
Personal Consumption (2Q F)
| Survey | 1.7% |
| Actual | 1.2% |
| Prior | 1.7% |
| Revised | n/a |
Worse than expected and not moving much off the bottom, which are at recession type levels.
Personal Consumption ALLX 1 (2Q F)
Personal Consumption ALLX 2 (2Q F)
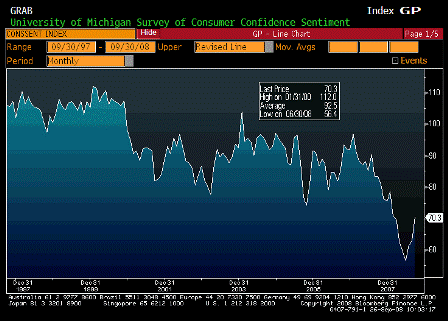
Univ. of Michigan Confidence (Sep F)
| Survey | 70.8 |
| Actual | 70.3 |
| Prior | 73.1 |
| Revised | n/a |
Less than expected but looks to have perked up some.
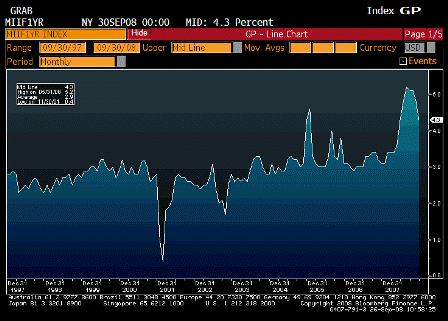
1 Year Inflation Expectations (Sep F)
| Survey | n/a |
| Actual | 4.3% |
| Prior | 3.6% |
| Revised | n/a |
Welcome news for the Fed. Follows gasoline prices pretty closely.
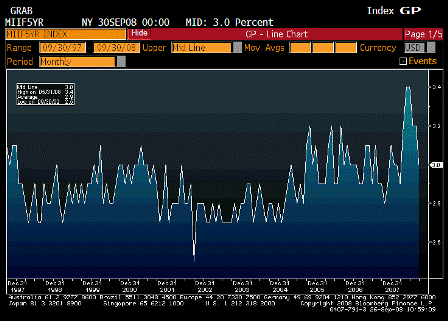
5 Year Inflation Expectations (Sep F)
| Survey | n/a |
| Actual | 3.0% |
| Prior | 2.9% |
| Revised | n/a |
Also nice to see that coming down.
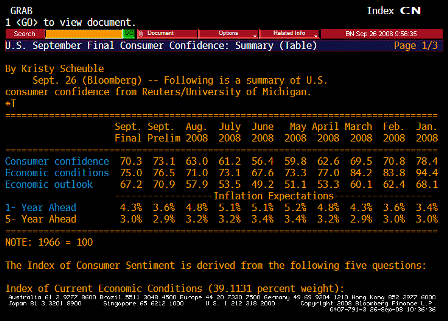
Univ. of Michigan TABLE Inflation Expectations (Sep F)
[top]


