2008-01-10 US Economic Releases

2008-01-10 Initial Jobless Claims

Initial Jobless Claims (Jan 5)

Survey 340K
Actual 322K
Prior 336K
Revised 337K

2008-01-10 Continuing Claims

Continuing Claims (Dec 29)

Survey 2730K
Actual 2702K
Prior 2761K
Revised 2754K

Looks like employment for December was pretty good.


2008-01-10 Wholesale Inventories

Wholesale Inventories (Nov)

Survey 0.4%
Actual 0.6%
Prior 0.0%
Revised

November sales look good, and October revised up.

Inventory/sales ratio hits new low:

U.S. Nov wholesale inventories up 0.6 pct

by Lisa Lambert

(Reuters) Inventories at U.S. wholesalers rose 0.6 percent in November, but they did not keep pace with sales, which saw the biggest monthly increase in more than two years on rising petroleum prices, the government reported Thursday.

The Commerce Department said sales rose by 2.2 percent in November, the biggest monthly gain since September 2005. That reflected an 8.9 percent boost in petroleum sales, which a Commerce Department official said reflected higher prices. It was also
the biggest rise since September 2005, when a devastating hurricane season drove up the price of oil.

Analysts polled by Reuters expected a 0.4 percent gain in inventories, after a flat reading in October, which was unrevised. The department had a big revision in sales during October, reporting a 1.4 percent rise instead of the prior estimate of 0.7 percent.

In a sign businesses are not building up stockpiles as the economy slows, the inventory-to-sales ratio — a measure of the number months it would take to deplete existing stocks at the current sales pace — fell to a record low of 1.07 months from October’s downwardly revised 1.08 months.


2008-01-10 ICSC Chain Store Sales YoY

ICSC Chain Store Sales YoY (Dec)

Survey n/a
Actual 0.9%
Prior 3.5%
Revised n/a

Certainly moderating, but not all that bad.


A blurb from a broker

(email)

>
> An impressive November Factory Orders report offered a respite from the
> recent round of weak economic data.

Yes, and maybe even nudge up Q4 forecasts (forecasting the past).

Also, if you look at the continuing claims graph since 1980, it is very low, especially when considering the growth in the labor force, and the latest rise isn’t yet at all meaningful.

> Another data point likely be viewed as
> an incremental positive by the Fed, was the first increase in Asset-Backed
> Commercial Paper outstanding in 20 weeks.

Yes, and the banks are now actively competing for that business. Markets are ‘functioning’ albeit at different rates than before.

> The ABCP market has been around
> for over 20 years. Between 2005 to 2007 it grew by 80% to $1.2 trillion as
> it became the primary funding tool for SIVs.

Yes. And before that, GDP managed to somehow grow, hitting 6%+ in the late 90s before the surplus took it all down.

There is now very good evidence -not that it was needed- that the financial sector adds little or nothing of value to the ‘real economy’ and instead acts as a massive ‘brain drain’ on the real economy.

> The market enabled SIVs to
> initiate hundreds of billions of dollars of leveraged spread trades. The
> SIVs borrowed short in the ABCP market and used the cash to finance
> purchases of mortgage backed securities, CDO’s and other credit instruments.
> Investors have made it clear to the ABCP market that they will no longer
> finance these carry trades. As a result, from August to December. The ABCP
> market shrunk by 37%. One of the concerns, the Fed has expressed has been
> that the legitimate participants in the ABCP market would be cut off from
> financing.

Right, hasn’t happened, and now, as you state, it is going the other way, and cheaper wholesale funding is again becoming available and again taking that lending away from the banks..

> This news could be the first to sign the ABCP market is
> returning to a sense of normalcy, which should be viewed as a minor positive
> and monitored for further improvement.

Agreed, thanks!


♥

2008-01-03 US Economic Releases

2008-01-03 MBA Mortgage Applications

MBA Mortgage Applications (Dec 28)

Survey n/a
Actual -11/6%
Prior -7.6%
Revised n/a

Last December number – purchase applications normally shoot back up in January.


2008-01-03 Challenger Job Cuts YoY

Challenger Job Cuts YoY (Dec)

Survey n/a
Actual -18.7%
Prior -4.7%
Revised n/a

Graph looks OK.


2008-01-03 ADP Employment Change

ADP Employment Change (Dec)

Survey 33K
Actual 40K
Prior 189K
Revised 173K

A touch better than expected, trending down some, but fed thinks there are fewer people left to hire. This is a real number as ADP reports the actual number of people on its payroll system.


2008-01-03 Initial Jobless Claims

Initial Jobless Claims

Survey 345K
Actual 336K
Prior 349K
Revised 357K

This kind of drop means there is no weakness indicated here.


2008-01-03 Continuing Claims

Continuing Claims (Dec 22)

2008-01-03 Continuing Claims from 1980

Continuing Claims since 1980

Survey 2675K
Actual 2761K
Prior 2713K
Revised 2715K

Up some, but the long term graph looks fine.


2008-01-03 Factory Orders

Factory Orders (Nov)

Survey 0.5%
Actual 1.5%
Prior 0.5%
Revised 0.7%

No weakness here.


2008-01-03 Total Vehicle Sales

Total Vehicle Sales (Dec)

Survey 16.0M
Actual 16.3M
Prior 16.2M
Revised n/a

Still on the soft side, but no disaster.


2008-01-03 Domestic Vehicle Sales

Domestic Vehicle Sales (Dec)

Survey 12.2M
Actual 12.5M
Prior 12.4M
Revised n/a

As above.


♥

2007-12-27 US Economic Releases

2007-12-27 MBAVPCH Index

MBAVPCH Index


2007-12-27 MBA Mortgage Application

MBA Mortgage Applications (Dec 21)

Survey n/a
Actual -7.6%
Prior 19.5%
Revised n/a

Goes down this time every year and bounces back early January.


2007-12-27 Durable Goods Orders

Durable Goods Orders (Nov)

Survey 2.0%
Actual 0.1%
Prior -0.4%
Revised -0.4%

2007-12-27 Durables Ex Transporation

Durable Goods Ex Transportation (Nov)

Survey 0.5%
Actual -0.7%
Prior -0.7%
Revised -0.9%

Still drifting lower over time.

Domestic demand has been gradually softening for about a year and a half, as the lower deficit hiked the financial obligation ratios to levels where the rate of consumer credit expansion peaked.


2007-12-27 Initial Jobless Claims

Initial Jobless Claims (Dec 22)

Survey 340K
Actual 349K
Prior 346K
Revised 348K

2007-12-27 Continuing Claims

Continuing Claims (Dec 15)

Survey 2645K
Actual 2713K
Prior 2646K
Revised 2638K

Drifting up very modestly.


2007-12-27 Consumer Confidence

Consumer Confidence (Dec)

Survey 86.5
Actual 88.6
Prior 87.3
Revised 87.8

CNBC gloominess peaked?


♥

2007-12-06 US Economic Releases

2007-12-06 Initial Jobless Claims

Initial Jobless Claims (Dec 1)

Survey 335K
Actual 338K
Prior 352K
Revised 353K

Down from the week before, chart still looks like a modest up move has taken place. Still comfortably below the 375-400K level that would signal a slowdown.


2007-12-06 Continuing Claims

Continuing Claims (Nov 24)

Survey 2620K
Actual 2599K
Prior 2665K
Revised 2658K

Also backing off from last week’s mini spike and not a problem for the fed at current levels.


2007-12-06 Mortgage Deliquencies

Mortgage Delinquencies (3Q)

Survey n/a
Actual 5.59%
Prior 5.12%
Revised n/a


Delinquencies up some, but probably not far from fed expectations.


2007-12-06 ICSC Chain Store Sales YoY

ICSC Chain Store Sales YoY

Survey 2.4%
Actual 3.5%
Prior 5.12%
Revised n/a


These look fine – up a touch and no sign of collapse.


♥

2007-11-29 US Economic Releases

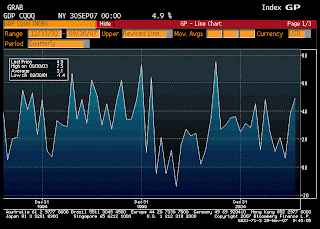
GCP Annualized (3QP)

Survey 4.8%
Actual 4.9%
Prior 3.9%
Revised n/a

Keeps coming in above expectations.


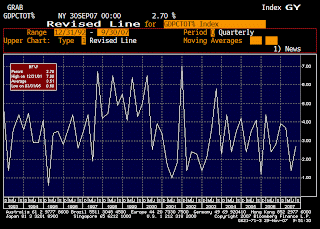
Personal Consumption (3QP)

Survey 2.9%
Actual 2.7%
Prior 3.0%
Revised n/a

A touch higher bust still seems very low.


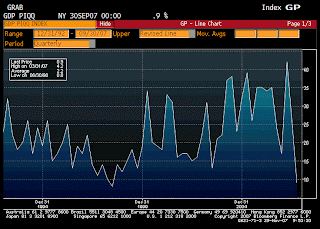
GDP Price Index (3QP)

Survey 0.8%
Actual 0.9%
Prior 0.8%
Revised n/a

A touch higher bust still seems very low.


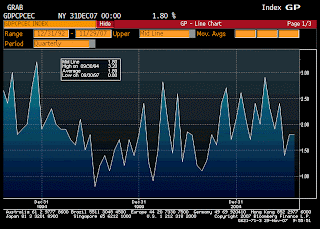
Core PCE QoQ (3QP)

Survey 1.8%
Actual 1.8%
Prior 1.8%
Revised n/a

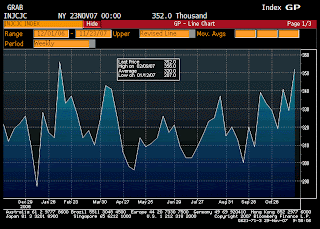
Initial Jobless Claims (Nov 24)

Survey 330K
Actual 352K
Prior 330K
Revised 329K

Thanksgiving week. Next week’s number is more informative.


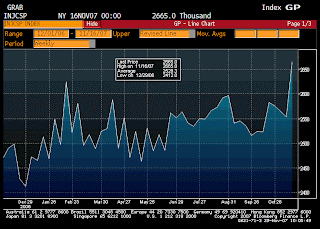
Continuing Claims (Nov 17)

Survey 2575K
Actual 2665K
Prior 2566K
Revised 2553K

Thanksgiving week. Next week’s number is more informative.


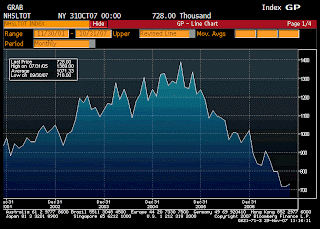
New Home Sales (Oct)

Survey 750K
Actual 728K
Prior 770K
Revised 716K

Up a touch from revised lower number, but still very low.


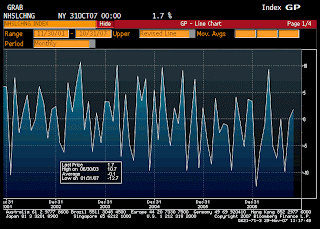
New Home Sales MoM (Oct)

Survey -2.6%
Actual 1.7%
Prior 4.8%
Revised -0.1%

Up a touch from revised lower number, but still very low.


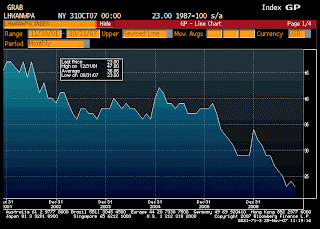
Help Wanted Index (Oct)

Survey 23
Actual 23
Prior 24
Revised n/a

Thanksgiving week. Next week’s number is more informative.


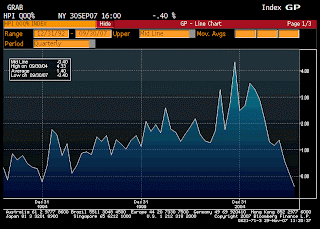
House Price Index QoQ (3Q)

Survey -0.5%
Actual -0.4%
Prior 0.1%
Revised n/a

Moving lower.
Do you think any of this is below fed expectations as of October 31st?


♥