Corporate profits

Seems the corporate profits report includes the Fed’s profits, all of which get turned over to the Treasury, of course…

How the Fed Stopped the “Corporate Profit Recession” (and the Media Fell for it)

By Wolf Tichter

The end of the corporate “profit recession” has been declared last week. It was based on data by the Bureau of Economic Analysis, released on May 27. Corporate profits, after declining with some zigs and zags since their peak in the third quarter 2014, suddenly ticked up in the first quarter 2016. And everyone was ecstatic.
er-6-2-16-5
But there’s a detail – a huge detail – that the media conveniently forgot to point out: whose profits are included in “corporate profits.” The BEA tells us (emphasis added):

These organizations consist of all entities required to file federal corporate tax returns, including mutual financial institutions and cooperatives subject to federal income tax; nonprofit organizations that primarily serve business; Federal Reserve banks; and federally sponsored credit agencies.

For the first quarter, the Federal Reserve Banks reported a consolidated profit that had jumped 11% from a year earlier to a record $24.9 billion!

And this magic profit was added to the BEA’s measure of “corporate profits.” Total corporate profits ticked up $8.1 billion in the first quarter, including the Fed’s magic $24.9 billion. And without the Fed’s magic profits?

So somewhat embarrassingly for the gurus of the end of the corporate profit recession: “Were it not for this increase, overall profits in the US would have actually been down for a third consecutive quarter.”

In fact, on an annualized basis, the Fed’s magic profits accounted for 27.2% of US financial sector profits and for 5.3% of total US corporate profits (blue line in the chart below), “the highest level in a generation.”

ADP, NY ISM

A forecast for tomorrow’s employment report:

ADP Employment Report
er-6-2-16-2
Highlights
The May employment report isn’t expected to be very strong but it may not prove, in contrast to expectations, to be any weaker than April, at least based on ADP’s estimate for private payrolls which comes in at 173,000 vs ADP’s revised 166,000 for April. The Econoday consensus for private payrolls in tomorrow’s government report is noticeably lower, at 150,000 vs May’s 171,000. ADP has been very accurate so far this year and today’s results are bound to have forecasters wondering if they should boost their estimates, at least perhaps slightly, for tomorrow’s big report.

er-6-2-16-3

United States ISM New York Index

The ISM NY Current Business Conditions Index dropped sharply to 37.2 in May 2016 from 57 in the previous month. It is the lowest reading since April of 2009 as employment (44.6 from 49.9 in April), quantity of purchases (37.5 from 48.2) and prices paid (45.7 from 48.1) decreased further while current (60 from 50) and expected (68 from 56) revenues increased. The 6-month outlook stabilized at 53.6 after falling to a 7-year low of 53.1 in April. Ism New York Index in the United States averaged 55.69 percent from 1993 until 2016, reaching an all time high of 88.80 percent in December of 2003 and a record low of 23.40 percent in October of 2001. Ism New York Index in the United States is reported by the Institute for Supply Management.

er-6-2-16-4

Saudi Aramco Seen Increasing July Oil Premium for Asia Customers

The higher prices likely indicate a change in policy from that of putting downward pressure on prices to a more neutral stance.

Might have something to due with the last change in oil ministers.

We will know more when this latest chart of the history of discounts/premiums is updated:
er-6-2-16-1

Saudi Aramco Seen Increasing July Oil Premium for Asia Customers

By Serene Cheong and Sharon Cho

(Bloomberg) — Saudi Aramco may widen Arab Light premium by 40c/bbl for July sales to Asia, accord. to median est. in Bloomberg survey of 5 refiners, traders.

July Arab Light OSP fcast at 65c/bbl above Oman-Dubai bmark vs 25c/bbl premium for June

June OSP increased by $1.10 m/m vs fcast of 65c gain in a survey last mo.

For July OSP, 3 participants est. premium to rise 30-40c, 2 predict 50c-60c increase

Co. may announce OSP for July shipments in next few days

READ: Saudis Raise Oil Pricing for Asia by Most Since April Last Year

May US light vehicle sales

Car sales continue to soften from the highs of last year.

And May sales unchanged from April would mean no contribution to growth this month:

U.S. Light Vehicle Sales increase to 17.4 million annual rate in May

by Bill McBride

Based on a preliminary estimate from WardsAuto, light vehicle sales were at a 17.37 million SAAR in May (Preliminary estimate excluding Jaguar Land Rover and Volvo).

That is down about 1.5% from May 2015, and up slightly from the 17.32 million annual sales rate last month.
er-6-1-16-9

Mtg purchase apps, Mortgage origination, PMI indexes

Down 5% after last week’s up 5%… ;)

MBA Mortgage Applications
er-6-1-16-1

Note that the total is in decline:
er-6-1-16-2
This (limited) measure of retail sales is still depressed and weakening as well:
er-6-1-16-3
Two manufacturing indexes out today.

The first was slightly lower than last month and trending down:

PMI Manufacturing Index
er-6-1-16-4
Highlights
Markit Economics’ U.S. manufacturing sample continues to report nearly dead flat conditions, at a final May index of 50.7 which compares with 50.5 for the mid-month flash and a final 50.8 for April. Production is in outright contraction (below 50) for the first time in 6-1/2 years as growth in new orders is as slow as it’s been all year. Export orders posted a marginal drop while total backlog orders are also down. The sample, however, increased hiring in an anomaly that won’t likely last given the weakness in orders. Efforts to slow inventory accumulation contributed to the decline in production. Price data include an uptick in input costs, tied in part to higher steel prices, but little change for selling prices which is actually an improvement following three straight months of decline.

Negative factors cited by the sample include weak capital investment across the energy sector, uncertainty related to the presidential election and generally subdued economic conditions. Coming up on the calendar at 10:00 a.m. ET will be the closely watched ISM manufacturing index which forecasters see coming in very close to this report, at a consensus 50.6.

er-6-1-16-5
The second was up some from last month but still relatively weak:
er-6-1-16-6
Construction was way down, which is not at all good for GDP:

Construction Spending
er-6-1-16-7
Highlights
A major downturn for construction spending in April is offset to a large degree by a major upward revision to the prior month. Construction spending fell 1.8 percent in April for the worst reading since January 2011. But March’s gain, initially at only plus 0.3 percent, is now plus 1.5 percent. And February is also revised higher, up 4 tenths to plus 1.4 percent. Still, the year-on-year rate does point to slowing, at plus 4.5 percent which is down from a long run in the high single digits and the lowest since June 2013.

er-6-1-16-8

Personal income and spending, Chicago PMI, Consumer confidence, Dallas Fed, State Street investor confidence

Yet another pretty good April release that I suspect will be reversed in May, as has happened with several other data series. And the increased spending on gasoline due to higher prices coincided with a reduction in the savings rate, as April spending outstripped income. And note that March’s +.1 was revised to 0 with this April number also subject to revision.

Personal Income and Outlays
er-5-31-1
Highlights
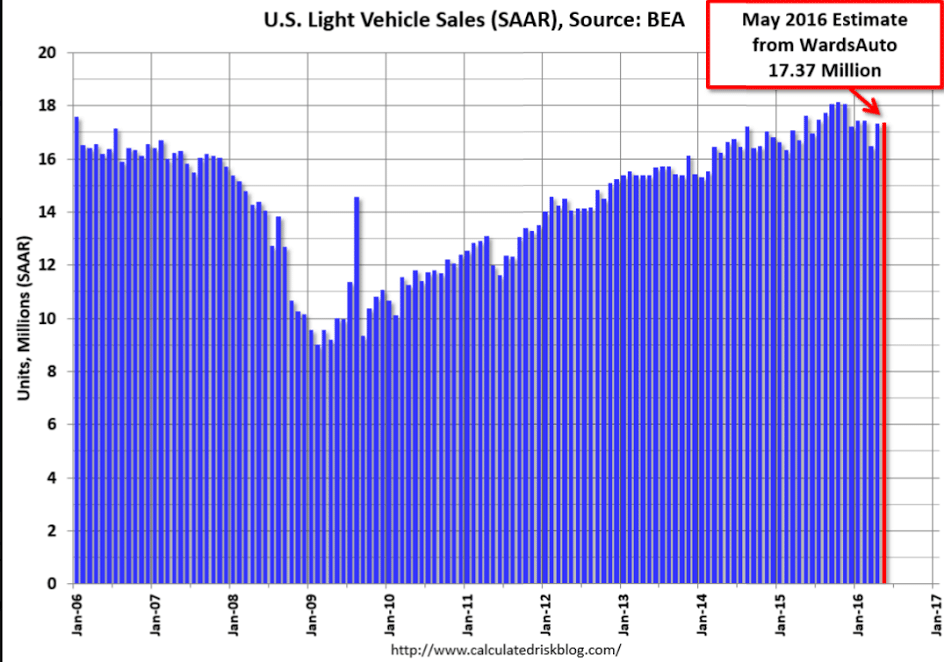
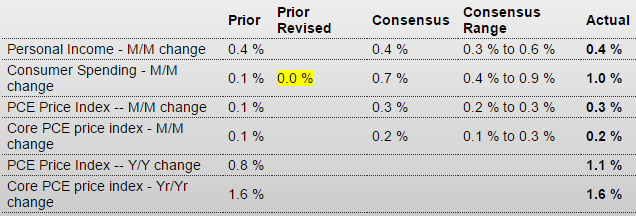
April was definitely the month of the consumer as consumer spending surged 1.0 percent for the largest monthly jump of the economic cycle, since August 2009. The spending gain reflects strength in vehicle sales, which boosted durable spending by an outsized 2.3 percent in the month, and also reflects price effects for gasoline as spending on nondurable goods rose 1.4 percent. Spending on services, which is a bulwark of this report, rose a very solid 0.6 percent in the month.

The income side of today’s report is also strong, up 0.4 percent which includes a 0.5 percent rise for wages & salaries. Consumers tapped into their savings for the spending rush as the savings rate fell 5 tenths to what is still a very solid 5.4 percent.

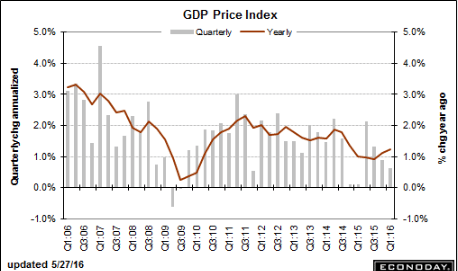
Price data are mixed as the PCE core rate — which is the Fed’s most important gauge — rose only 0.2 percent with the year-on-year rate decidedly flat at an unchanged 1.6 percent and still, despite the gain for wages, 4 tenths below target. The overall price index shows more life, up 0.3 percent on the month and 3 tenths higher on the year at plus 1.1 percent.

The spending side of this report is an eye catcher and if repeated in May could very well, despite the lack of pressure on core prices, raise the chances for a June FOMC rate hike. Note that unit vehicle sales, to be posted on tomorrow’s calendar, will offer the first substantial clues on consumer spending in May.

Speaking of firmer April releases that reversed in May, here’s another example:
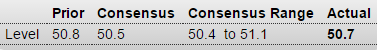
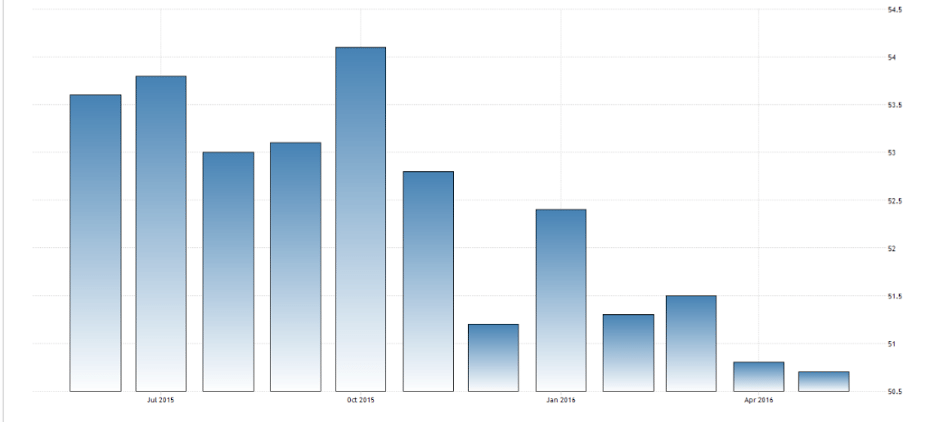
Chicago PMI
er-5-31-2
Highlights
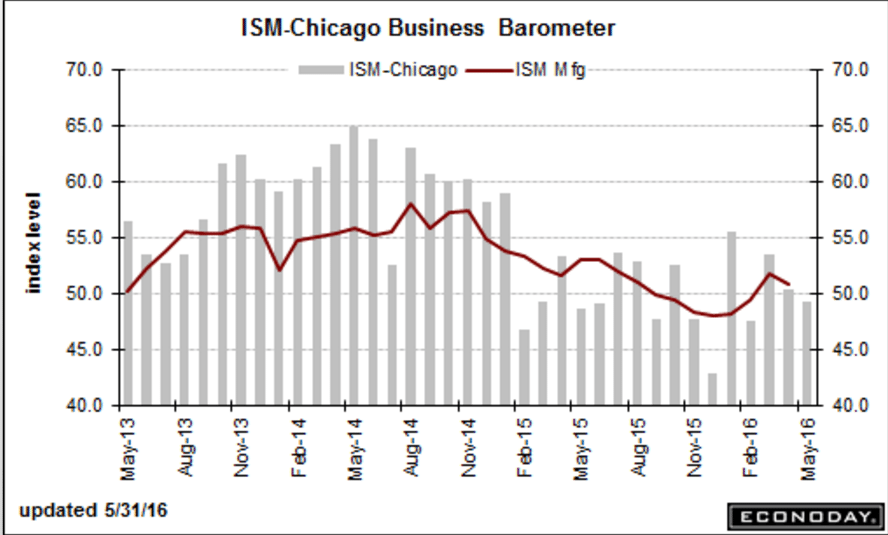
Businesses in the Chicago area are reporting slowing conditions with the PMI down 1.1 points to a sub-50 contractionary reading of 49.3. New orders, which slowed in the prior month, are now also in outright contraction as are backlog orders. Production is also in contraction while employment, though slowing, is still above 50 — but likely not for long given the weakness in orders and production.

A key indication of overall weakness is sharp contraction underway in inventories which are at their lowest point since November 2009. The decrease in inventories points to caution among businesses which apparently do not see demand improving. The prices paid index slowed but remains above 50 to indicate monthly growth, which is a plus right now as policy makers try to stimulate inflation.

The Chicago PMI has been up and down this year though the trend is pointing lower. Still, this report is dwarfed in importance by the big surge posted in this morning’s consumer income and spending data. The Chicago PMI samples companies from both the manufacturing and non-manufacturing sectors.

er-5-31-3
And yet another April uptick reverses in May:

Consumer Confidence
er-5-31-4

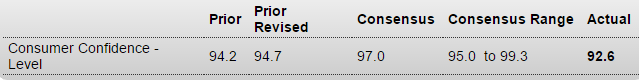
And a big time reversal into contraction from April to May here as well:

Dallas Fed Mfg Survey
er-5-31-5
Highlights
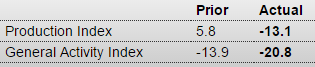
The Dallas manufacturing production index fell into negative territory with a reading of minus 13.1 from a positive 5.8 reading in April. At the same time, the May general activity index sank to minus 20.8 from minus 13.9 last time. This was the 17th consecutive negative reading.

New orders also fell back into negative territory. After popping up 6.2 in April after four consecutive declines, new orders dropped to a reading of minus 14.9. Employment remains weak, at minus 6.7 for a fifth straight contraction. Price data showed some life with wages up and raw materials, which had been week, also up. Selling prices, however, remain a negative, at minus 3.3, an improvement from minus 6.6 in April.

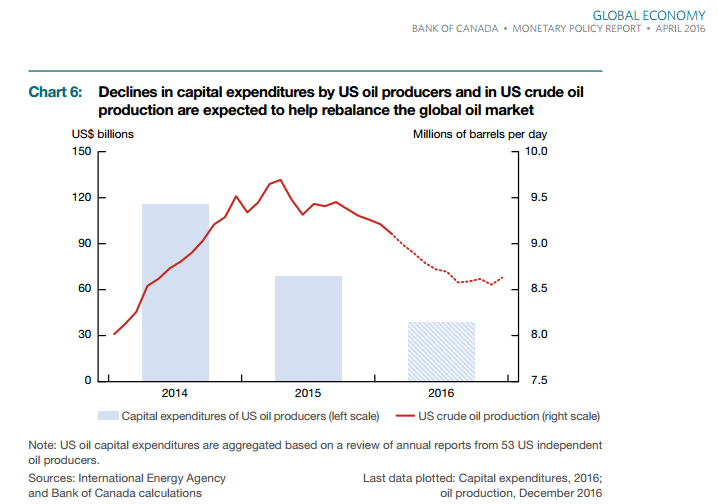
The ongoing recovery for oil is having a positive effect on energy prices and is likely to have a wider positive effect for the Texas manufacturing area eventually. However, this report is a setback.

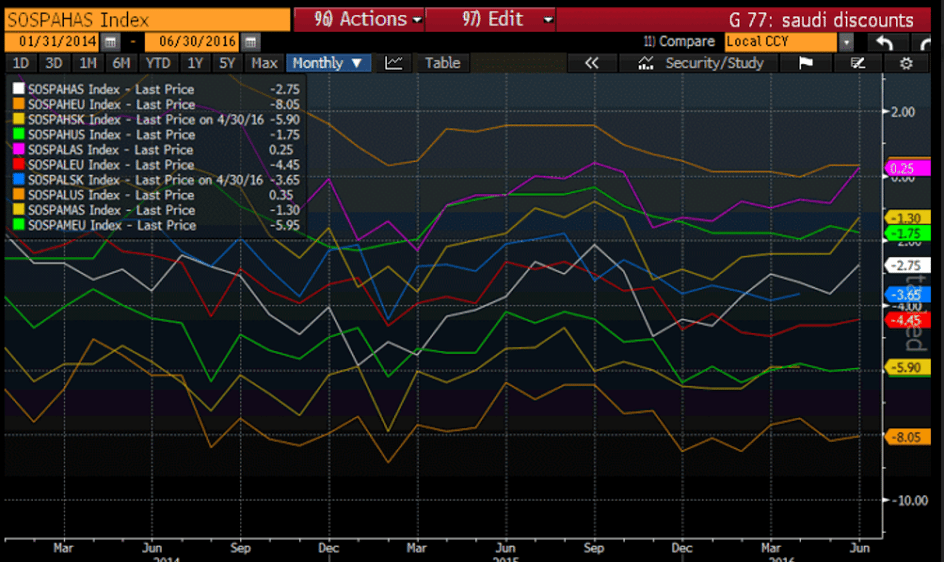
And even this indicator, whatever it is, shows the same pattern:

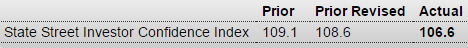
State Street Investor Confidence Index
er-5-31-6

GDP, Corporate profits, Oil capex, Truck tonnage, Vehicle sales preview

Pretty much as expected, inflation a bit lower.

Inventories revised up so Q2 that much more likely to see an inventory reduction along with associated cuts in output:

GDP
er-5-30-1
Highlights
First-quarter GDP is now revised higher but only slightly, to an annualized growth rate of plus 0.8 percent for a 3 tenths gain from the initial estimate. Upward revisions to residential investment and exports are behind the small gain along with an unwanted upward revision to inventories. Nonresidential investment remains very weak with government purchases holding only modestly positive. Personal consumption was soft, unrevised at a plus 1.9 percent rate. Final demand is revised higher but not by very much, only 1 tenth to a very soft plus 1.2 percent. Inflation data are weak with the GDP price index revised 1 tenth lower to an annualized plus 0.6 percent. Residential investment, boosted by home improvements, is the standout in this report which otherwise shows a very soft opening to 2016.

Next month I expect the year over year growth rate to decline substantially and continue to decline, as the weather related easy comparison with last year is ‘replaced’ by a much tougher comparison:
er-5-30-2
er-5-30-3
Still lots of time for these forecast to come down. They’ve been held up by April releases, including inventory building, housing and cars that have already shown signs of the reversals I expect in May:
er-5-30-4

May 27, 2016: Highlights

The FRBNY Staff Nowcast for GDP growth in 2016:Q2 has increased for the third week in a row and stands now at 2.2%.

Positive news came from new single family houses sold and manufacturers’ new orders of durable goods.

This week’s second estimate of GDP growth for 2016:Q1 from the Commerce Department was 0.8%. In the advance estimate released last month, GDP growth was 0.5%. The last FRBNY Staff Nowcast for that quarter, computed before the release of the advance estimate, was 0.7%.

Corporate profits have gone negative, as happens when deficit spending (private and public) is too low to offset desires to not spend income (savings). The immediate culprit was the drop in oil related capex spending that is spreading to the rest of the economy:

Corporate Profits
er-5-30-5
er-5-30-6

From the Bank of Canada- shows how just US oil capex spending and production has and continues to decline:
er-5-30-7
Interesting blip up and reversal pattern here too:
er-5-30-8
er-5-30-9
A reversal from April’s modest uptick, and down from last summer’s highs.

I see the year over year change in the process of going negative here as well:

Vehicle Sales Forecasts: Sales to be Over 17 Million SAAR in May

by Bill McBride on 5/26/2016 01:40:00 PM

The automakers will report May vehicle sales on Wednesday, June 1st.

Note: There were 24 selling days in May, down from 26 in May 2015.

From WardsAuto: May Forecast Calls for Improved Sales, Days’ Supply

WardsAuto forecast calls for U.S. automakers to deliver 1.52 million light vehicles in May.

The forecast daily sales rate of 63,443 units over 24 days represents a 1.3% improvement from like-2015 (26 days), while total volume for the month would fall 6.5% from year-ago. The 14.4% DSR increase from April (27 days) is ahead of the 7-year average 8% growth.

The report puts the seasonally adjusted annual rate of sales for the month at 17.3 million units, slightly above the 17.1 million SAAR from the first four months of the year, but below the 17.6 million SAAR reached in May 2015.

Philly Fed indicator, Fed discount rate

Not good!
er-5-26-16-5
The regional Feds are calling for higher discount lending rates even though borrowings are at 0!

According to the Fed minutes from the discount rate meeting (different from the FOMC minutes), four of the Fed banks called for a hike in the discount rate. It’s the emergency rate at which banks could borrow directly from the Fed’s discount window – currently at 1%. This disclosure suggests that the Fed is becoming increasingly hawkish.

er-5-26-16-6

Durable goods orders, KC Fed, Pending home sales, Health insurance premiums

Way up and better than expected, but looks like it was all a large aircraft order and some cars. Another good headline April release also likely to reverse in May:

Durable Goods Orders
er-5-26-16-1
Highlights
Indications on the factory sector have been mixed as is April’s durable goods report. The headline came in at a stronger-than-expected gain of 3.4 percent with March revised higher to a gain of 1.9 percent. Vehicles orders gave an important boost to April, up 2.9 percent as did the always volatile commercial aircraft component which swung 65 percent higher. But the ex-transportation reading, which excludes vehicles and commercial aircraft, rose a more modest and as-expected 0.4 percent.

A negative in the report is a sizable 0.8 percent decline in core capital goods orders which ominously is the third straight decline for this reading and the fifth out of the last six reports. Year-on-year, orders are noticeably in the negative column at minus 5.0 percent. These readings point squarely to stubborn weakness in business investment and uncertainty in the general business outlook.

There are, however, solid points of strength in the report including 0.6 percent gains for both total shipments and total unfilled orders. The gain for unfilled orders is the largest since July 2014. Another plus is a 0.2 percent decline in inventories which pulls down the inventory-to-shipments ratio to a leaner 1.65 from 1.67.

Vehicle strength is an important foundation for the factory sector, one tied to domestic consumer demand and a strength that highlights this otherwise mixed report.

After moving up some in April, backing down in May, and negative all along:
er-5-26-16-2
Another upbeat April housing number likely to reverse in May, the way all the other releases have so far:

Pending Home Sales Index
er-5-26-16-3
Highlights
News from the housing sector has been improving and very rapidly. First Tuesday’s new home sales report which absolutely surged and now a similar surge in the pending home sales index, up 5.1 percent in April for a third straight gain and pointing to greater acceleration for final sales of existing homes. The West, where existing home sales have been lagging, shot up a monthly 11.4 percent in today’s report with the South showing additional strength, up 5.1 percent. This week’s data, coming right at the beginning of the Spring season, have turned around the housing outlook, from modest growth to sharp growth in what is the latest indication of household strength.

As previously discussed, the logic behind allowing people with existing conditions to buy insurance at the same rate as everyone else is highly suspect:
er-5-26-16-4

Mtg prch apps, PMI services

Not a word from the analysts when they were down 6% last week.

But when up 5% this week expect lots of mentions…

MBA Mortgage Applications
er-5-25-16-1
Highlights
Purchase applications for home mortgages revived in the May 20 week, increasing by 5 percent from the prior week, while refinancing activity managed to post a gain of 0.4 percent despite slightly higher rates. The average 30-year mortgage for conforming loans ($417,000 or less) was up 3 basis points to 3.85 percent. Purchase applications were 17 percent higher than they were a year ago, an impressive gain that points to continuing strength of a very strong housing market, as seen best in yesterday’s new home sales report for April, showing total year-on-year sales up a remarkable 23.8 percent.

er-5-25-16-2

er-5-25-16-3