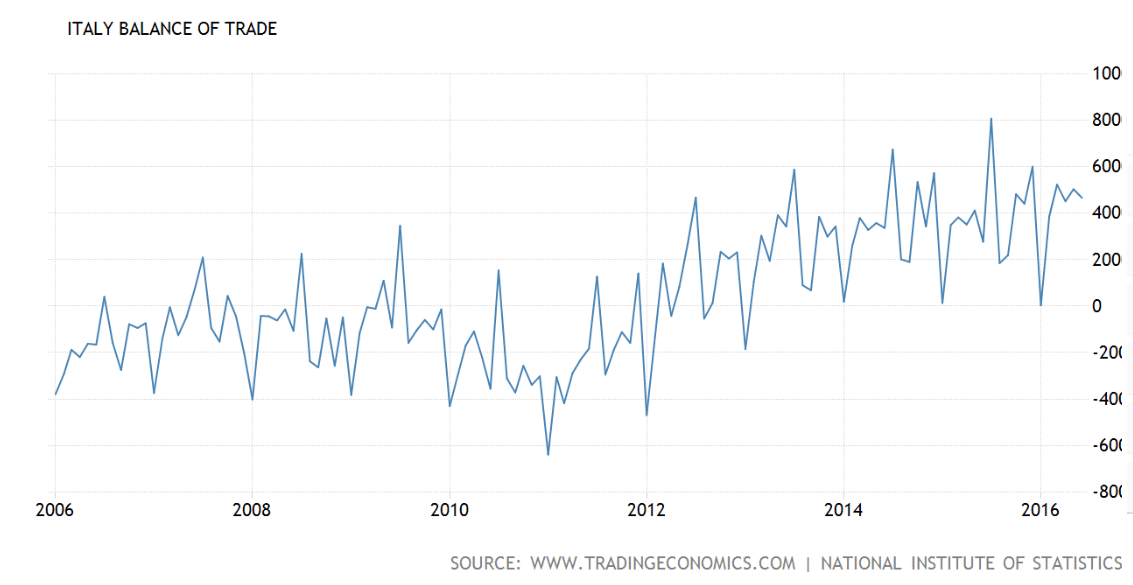
The euro area trade surplus in general seems to be continuing, even as global trade weakens. Fundamentally this removes net euro financial assets from global markets that were sold by portfolio managers. Those managers include central bankers proactively selling their euro reserves over the last two years or so to buy US dollars, which has in turn kept the euro low enough to drive the surplus:
Category Archives: Uncategorized
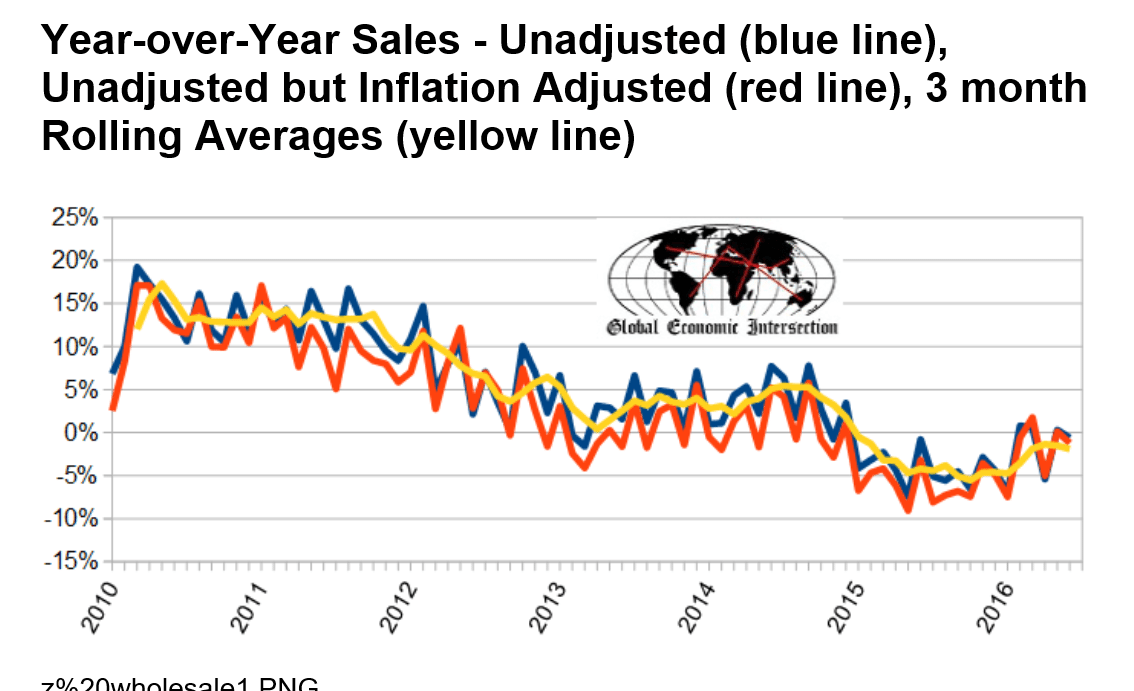
Wholesale sales, Household debt
unadjusted sales rate of growth decelerated 0.9 % month-over-month. unadjusted sales year-over-year growth is down 0.6 % year-over-year unadjusted sales (but inflation adjusted) down 1.2 % year-over-year the 3 month rolling average of unadjusted sales decelerated 0.4 % month-over-month, and down 1,9 % year-over-year.
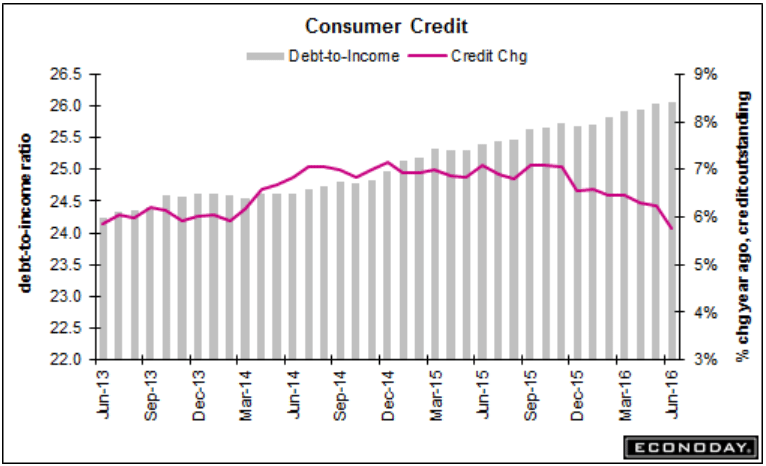
Very modest household credit expansion coincided with very weak growth for the last several quarters:
From the NY Fed: Household Debt Balances Increase Slightly, Boosted By Growth In Auto Loan And Credit Card Balances
The Federal Reserve Bank of New York’s Center for Microeconomic Data today issued its Quarterly Report on Household Debt and Credit, which reported that household debt increased by $35 billion (a 0.3 percent increase) to $12.29 trillion during the second quarter of 2016. This moderate growth was driven by increases in auto loan and credit card debt, which increased by $32 billion and $17 billion respectively. Mortgage debt declined by $7 billion in the second quarter, after a $120 billion increase in the first quarter, and student loan balances were roughly flat. Meanwhile, this quarter saw improvements in overall delinquency rates and another historical low (over the 18 years of the data sample) in new foreclosures. …
Read more at http://www.calculatedriskblog.com/#le2jQT0ugvGRLrDT.99
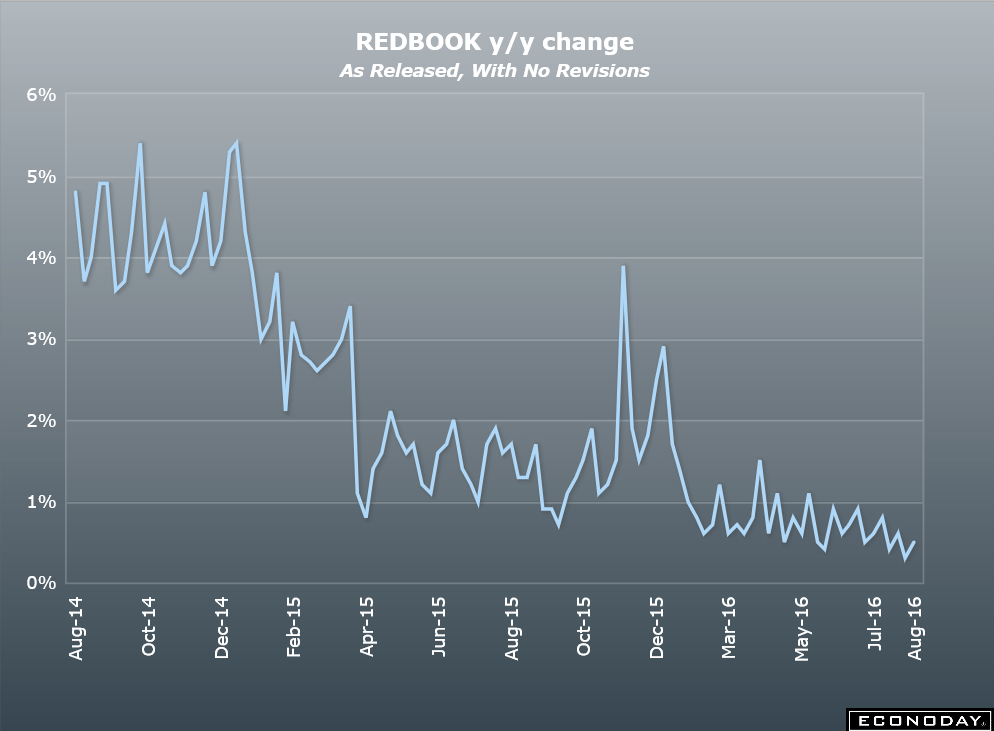
China, Small business index, Productivity and Labor costs, Redbook retail sales
No sign of increased global demand here:
China Exports Slide on Weak Demand
By Mark Magnier
Aug 9 (WSJ) — China’s General Administration of Customs said Monday that exports fell 4.4% in July year-over-year in dollar terms after a 4.8% decline in June. July imports fell by a greater-than-expected 12.5% from a year earlier, raising concerns over weak domestic demand. This compared with an 8.4% fall in June, the customs agency said. China’s trade surplus widened more than expected in July to $52.31 billion from $48.11 billion the previous month. The economy grew at a better-than-expected 6.7% rate in the second quarter, matching its first-quarter level.
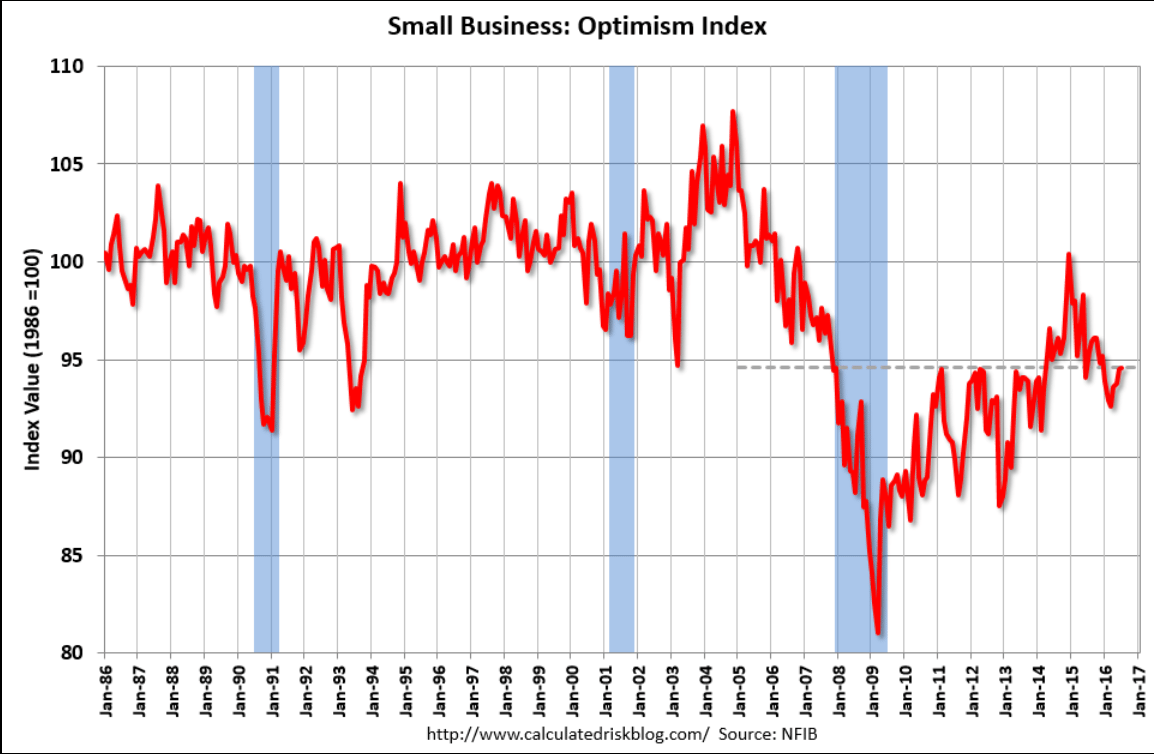
No improvement of note here as this index remains depressed:
Highlights
The small business optimism index rose 0.1 points in July to 94.6, a minute gain but nevertheless a touch higher than expectations and the fourth monthly increase in a row after falling to a 2-year low in March. Four of the 10 components of the index increased, four declined and two were unchanged.Expectations that the economy will improve led the gains again, rising 4 points as it did in May and June yet still remaining negative at minus 5, followed by plans to increase inventories, which rose 3 point to a neutral 0. Job openings hard to fill fell 3 points to 26 while maintaining its position as the strongest of the components, with the second strongest, plans to increase capital outlays, also dropping 1 point to 25. Business owners became even more pessimistic about earnings trends, with what has been the most negative component falling 1 point to minus 21.
I’m still thinking the negative productivity numbers- more employees producing less output- can be thought of as ‘human inventory building’ that increases costs and at some point reverses. That is, without increases in sales there’s generally no reason to increase employment.
At the same time, the still substantial slack in the labor market is keeping down labor costs, with the initially reported large Q1 gain revised down to a negative .2%.
Highlights
Output picked up in the second quarter but not quite as much as hours worked or compensation. Productivity fell 0.5 percent in the quarter for the third decline in a row. This is the longest negative streak in the history of this report which goes back to just after WWII.Unit labor costs rose 2.0 percent but, in a plus, were revised sharply lower in the first quarter which now shows a rare decline at minus 0.2 percent. But most readings in this report are not positive including the year-on-year rate for productivity which is down 0.4 percent for the first decline since second-quarter 2013. In an unfavorable contrast, year-on-year unit labor costs are up 2.1 percent.
Lack of business investment is unfortunately a central negative of this cycle and it results in weakening productivity for the nation. Americans are working more hours but production isn’t keeping up.
Still stone cold dead:
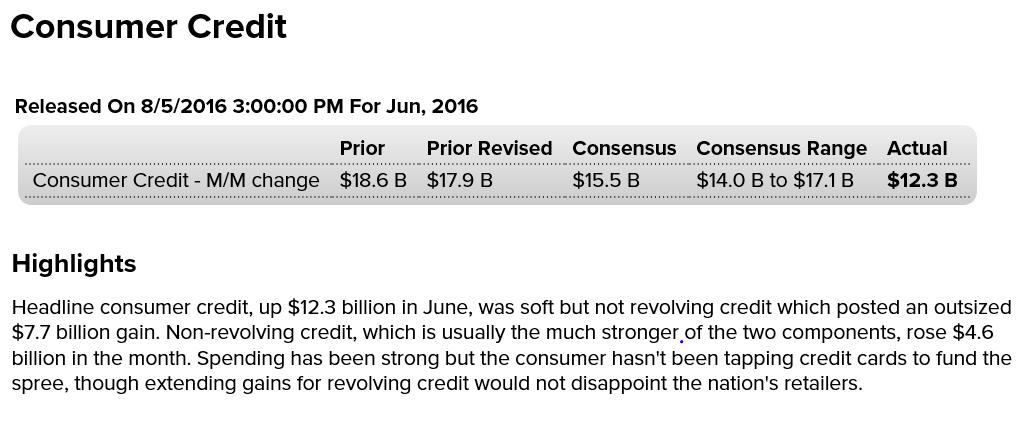
Consumer credit
Less then expected, last month revised down. No sign of the acceleration in credit we need to support growth here. And the mix between revolving and non revolving not encouraging either:
pmc ride tomorrow
thanks for all the donations!!!
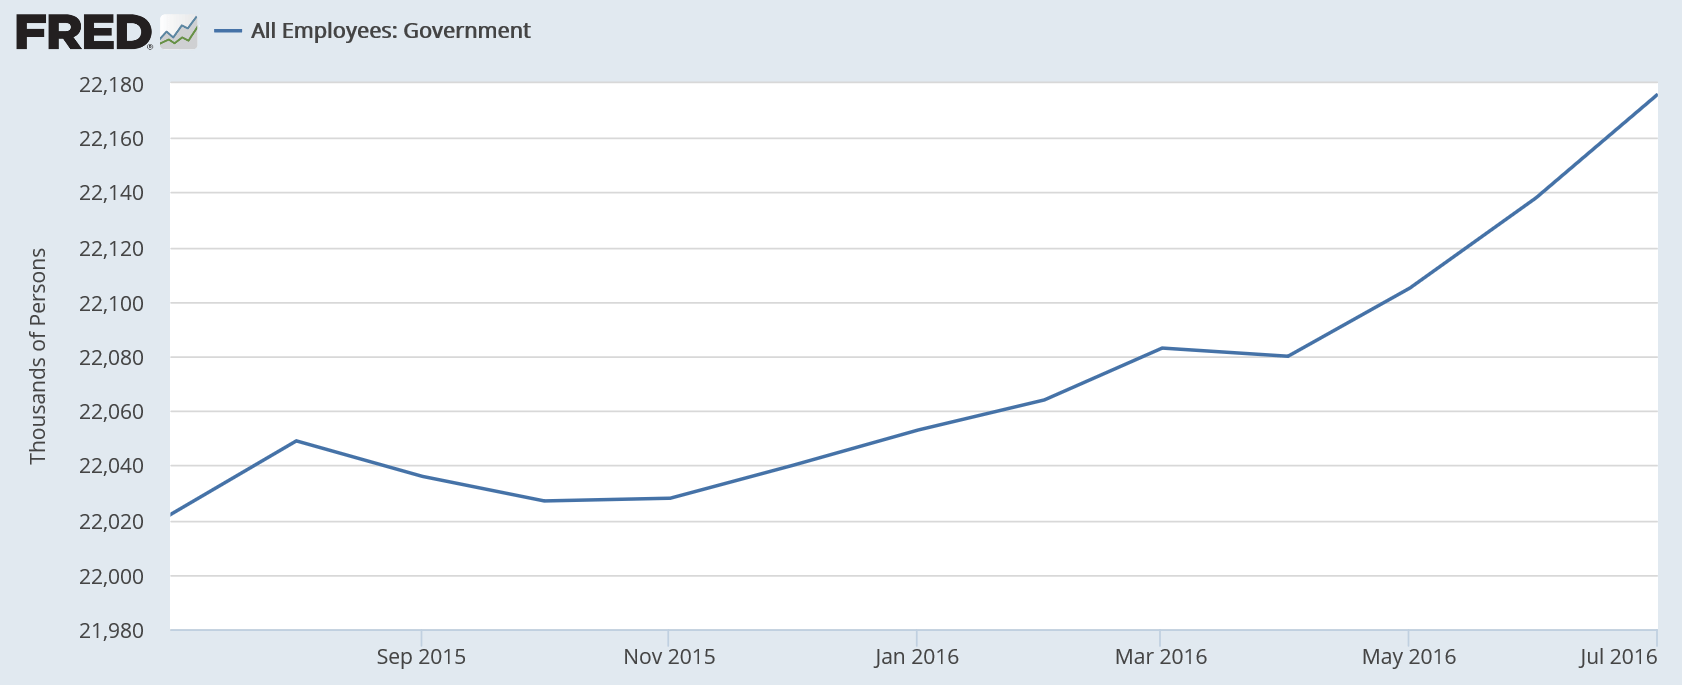
Employment charts, Atlanta GDP forecast
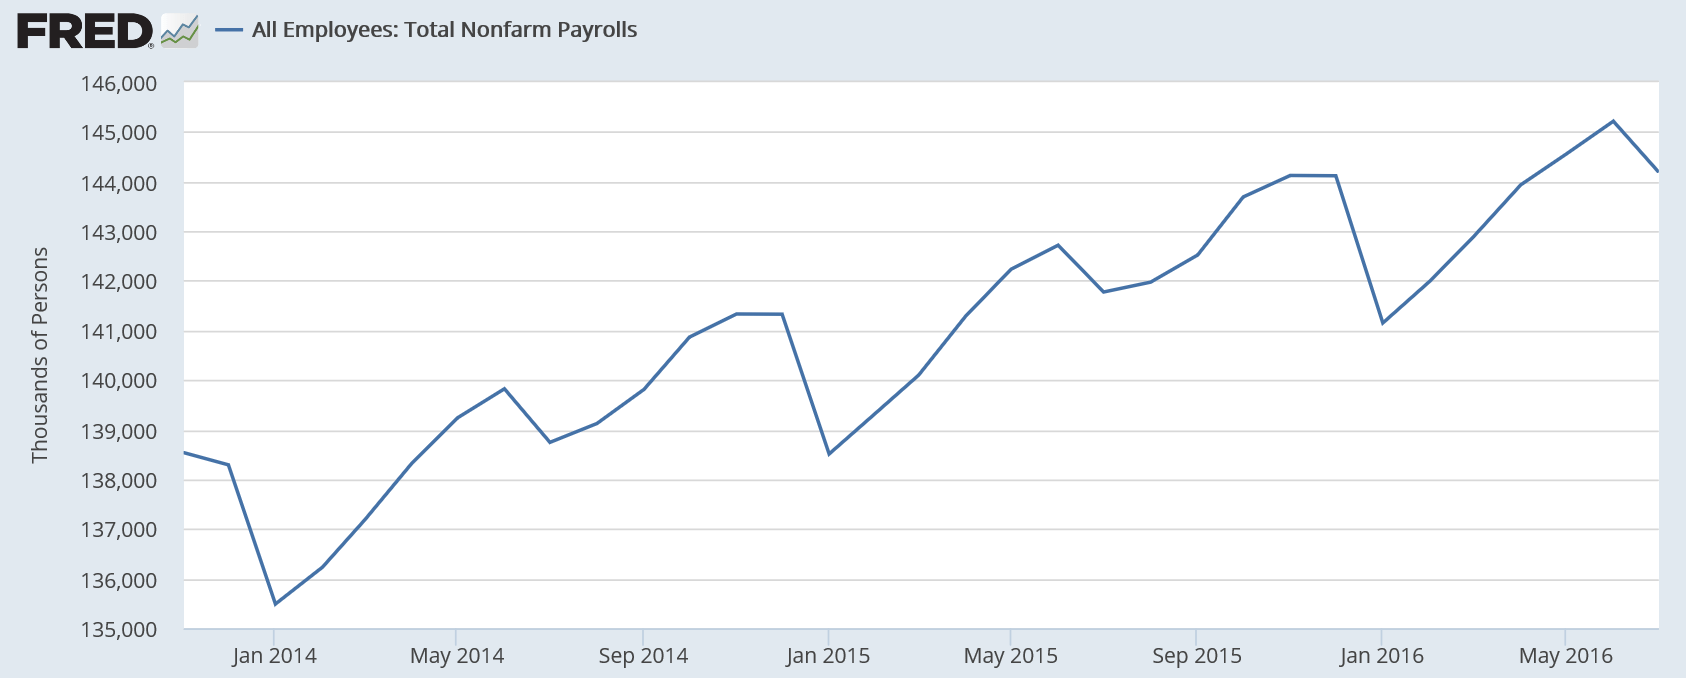
Government hiring contributed 38,000 jobs last month and a total of almost 100,000 over the last three months:
This is the jobs number before seasonal adjustments:
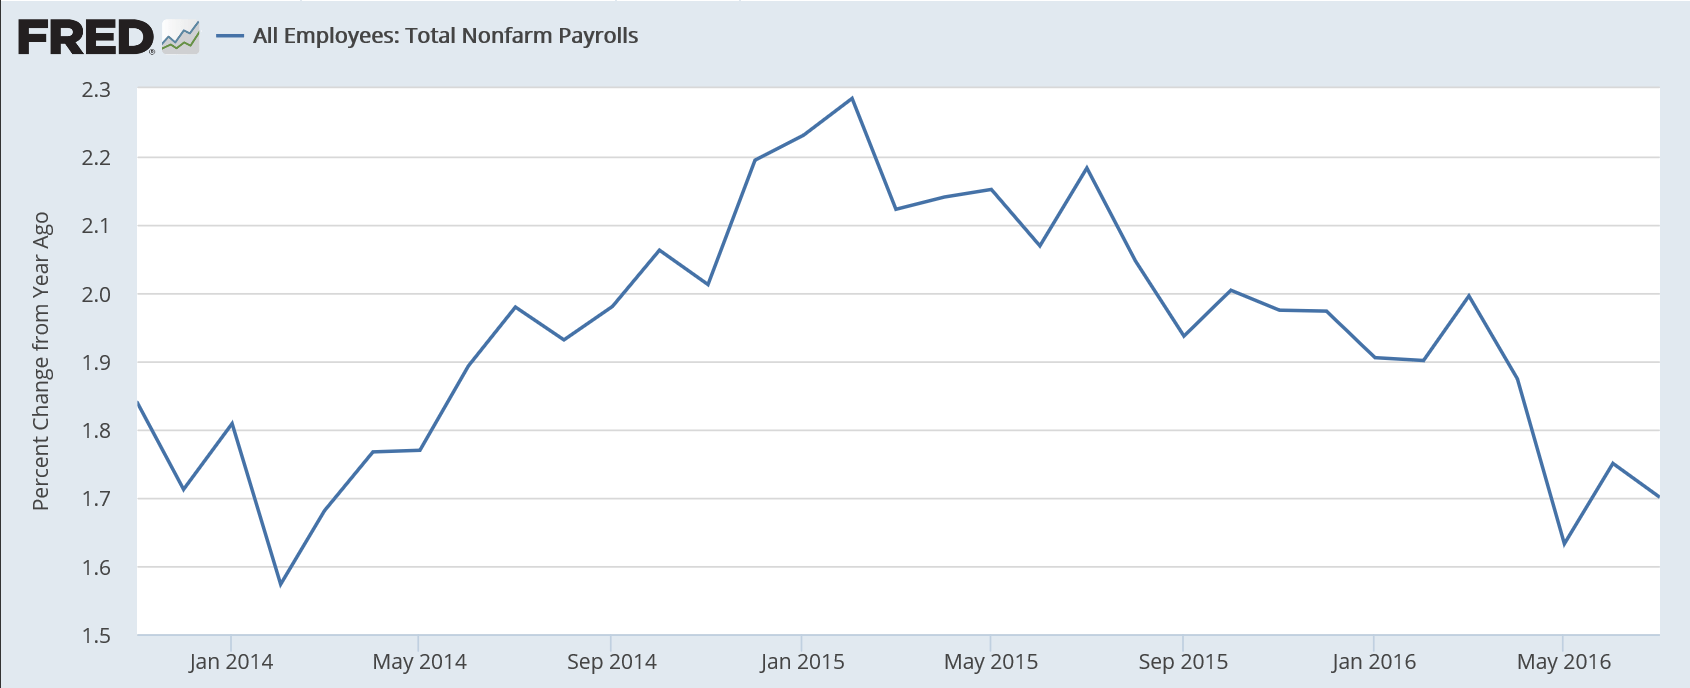
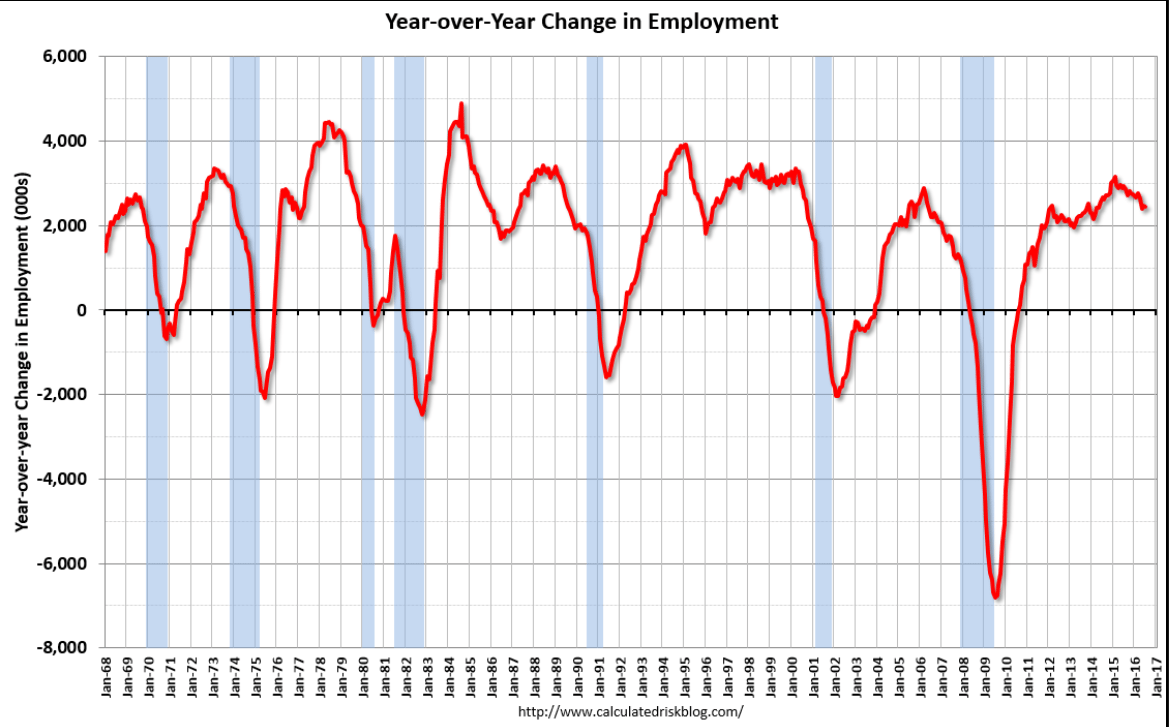
The year over year number ‘takes out’ the seasonal factors:
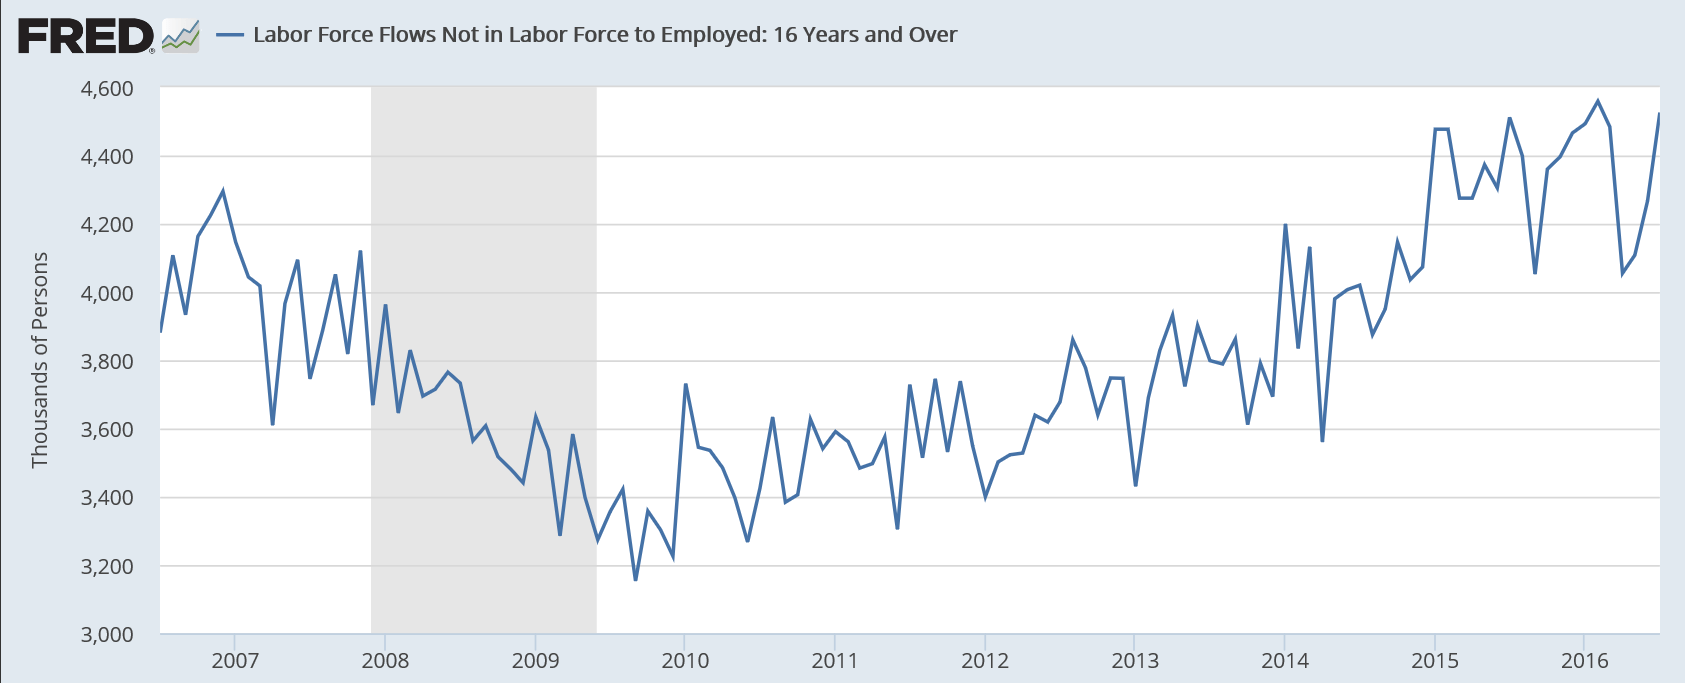
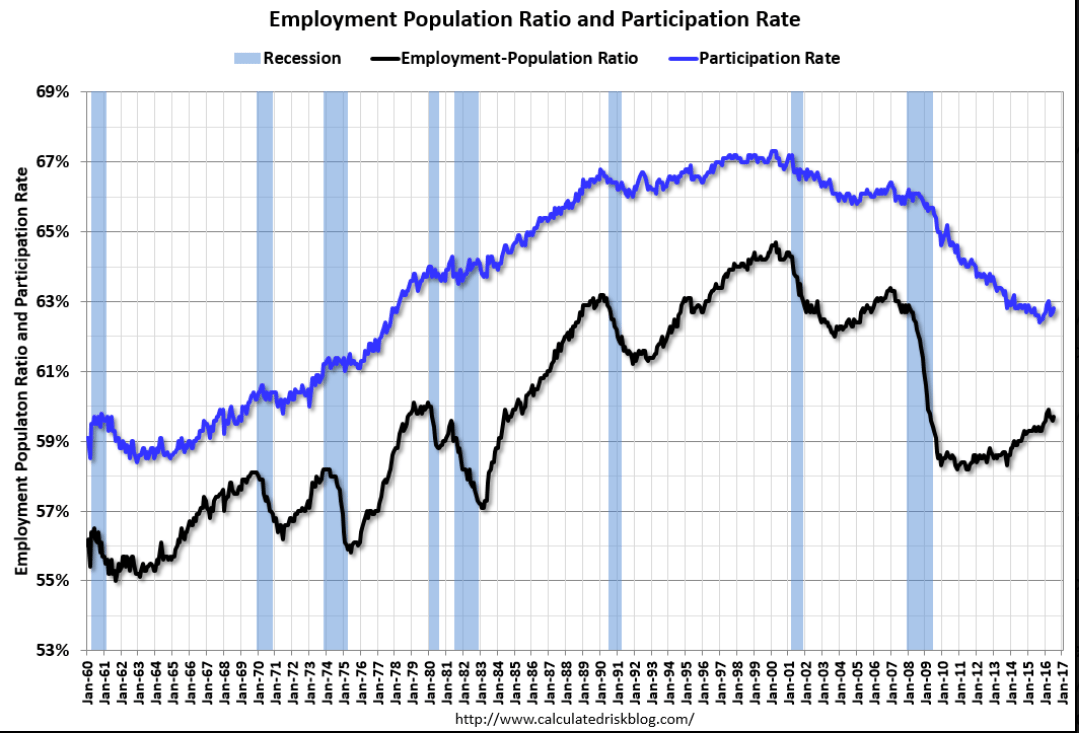
Note how many of the new employees were previously considered to be ‘outside the labor force’ for purposes of calculating the unemployment number:
The duration of unemployment has come down but it’s still higher than it’s ever been before this cycle:
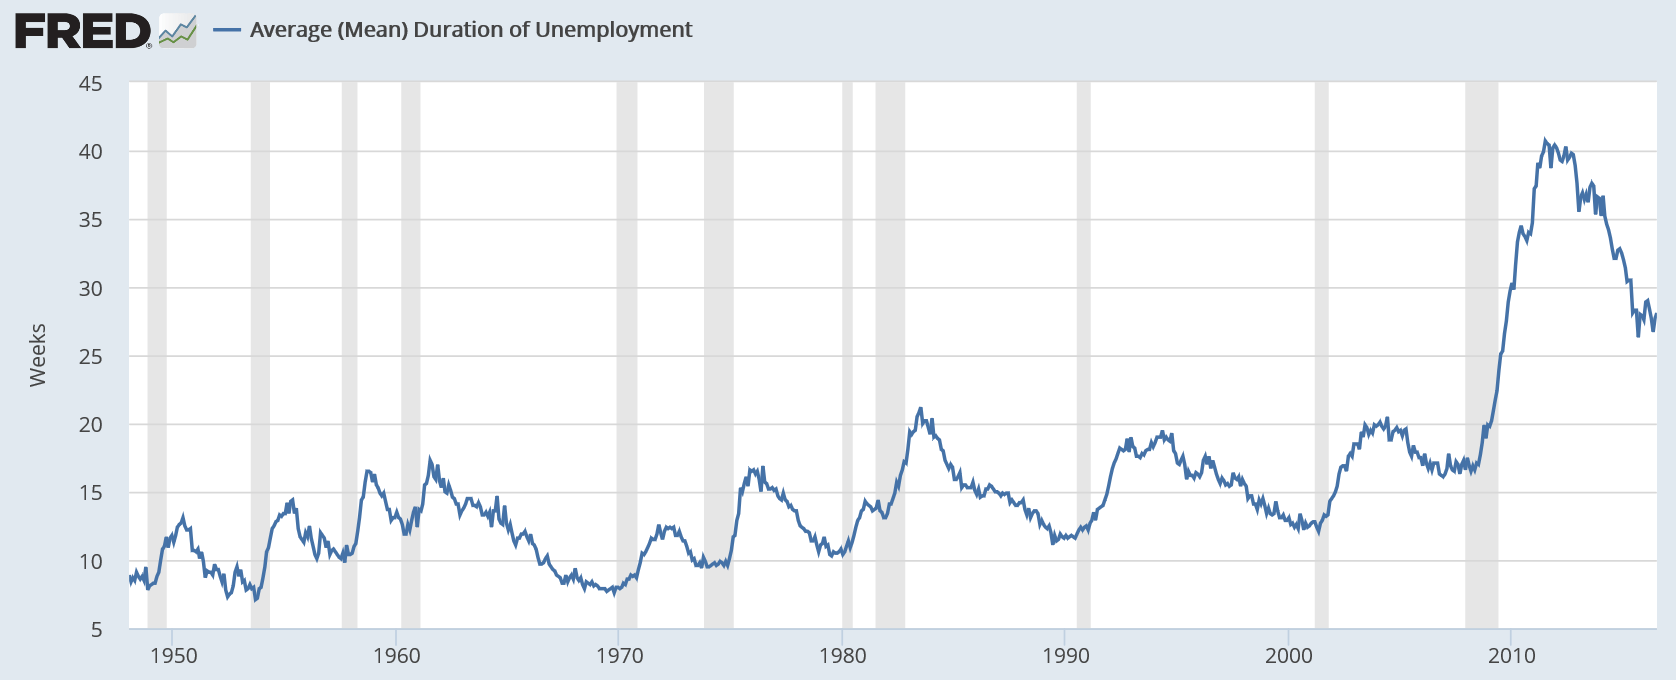
So, as previously discussed, I see serious levels of ‘slack’ remaining, while employment growth continues to decelerate ever since oil capex collapsed in q4 2014. And I see no sign yet that the lost oil capex spending that supported growth before it collapsed is being replaced.
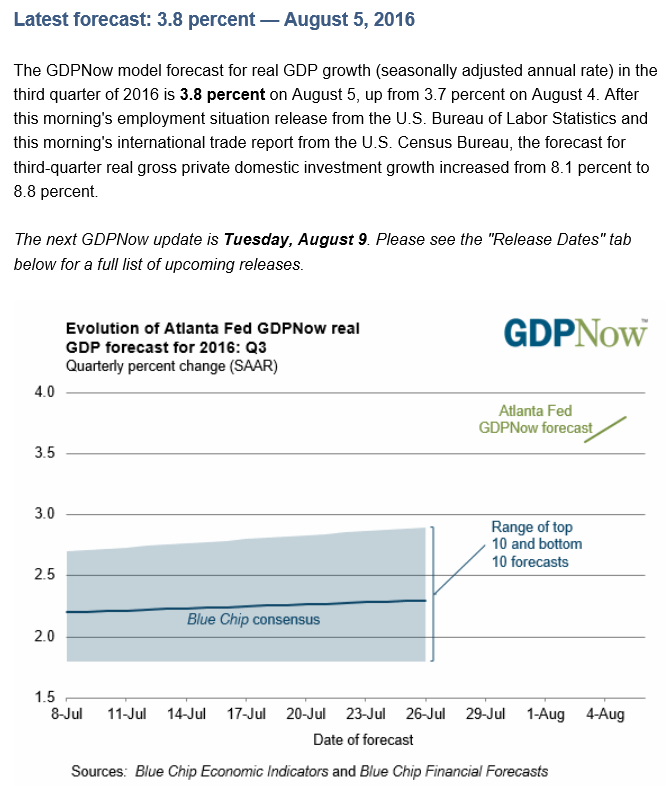
This is based on a few early numbers and assumptions that get modified as more data is released over the next few months. Last quarter also started off very high, and then came down to 1.8% before the first government estimate of 1.2% was released:
Trade, Jobs, SNB buying US stocks, German Factory Orders
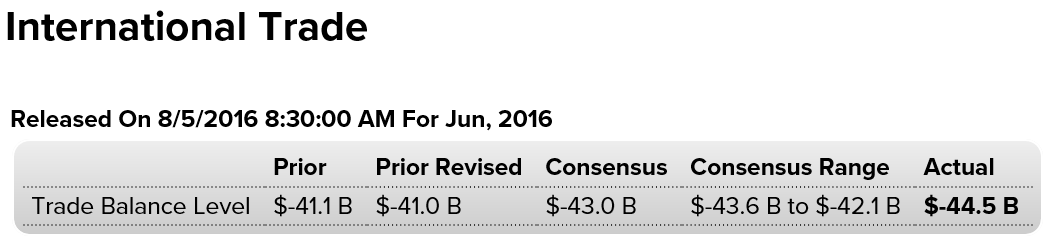
Larger trade deficit than expected for June, lowering Q2 GDP calculations as previously discussed:
Much better than expected and prior month total payrolls were revised up some with private payrolls revised down. The headline unemployment rate was unchanged, while U6 unemployment, the broader measure, moved up a tenth to 9.7, indicating an unexpectedly large increase in the available labor force. More details later today.
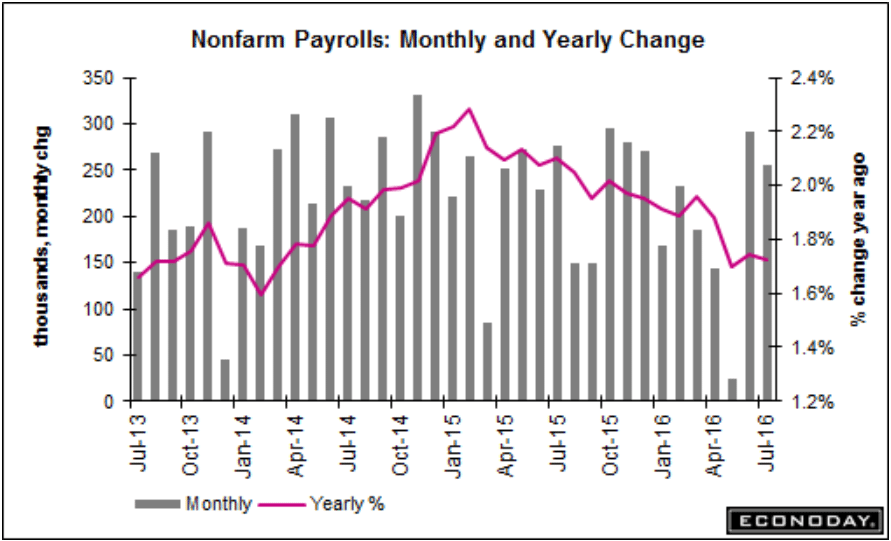
Also, year over year job growth is still decelerating, and, in my humble opinion, enormous ‘slack’ persists:
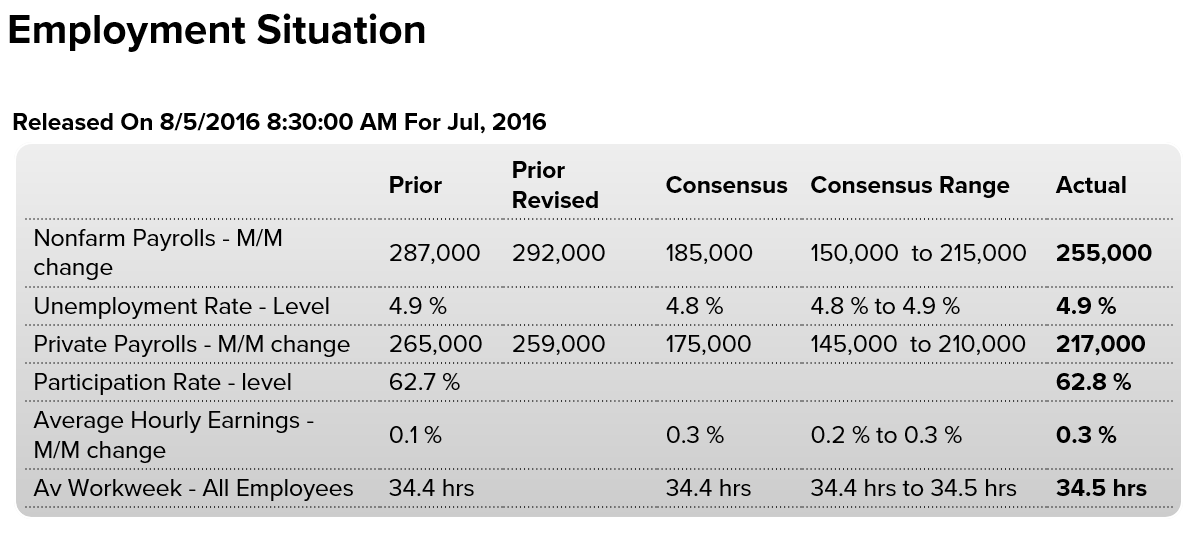
The headline unemployment rate held steady at 4.9 percent, though a more encompassing measure that includes those not actively looking for work and those working part-time for economic reasons moved up a notch to 9.7 percent.
Hourly wages also moved higher, increasing by 8 cents or an annualized pace of 2.6 percent, while the average work week edged up to 34.5 hours.
Economists had been looking for an increase of 180,000 and a decline of the unemployment rate to 4.8 percent from June’s 4.9 percent. June payroll growth initially was reported at 287,000.
Professional and business services led the way with 70,000 new positions, while health care rose 43,000 and Wall Street jobs increased by 18,000. Leisure and hospitality continued to be a big contributor to job growth, adding 45,000.
Jobs were evenly distributed, with full-time positions growing by 306,000 and part-time adding 150,000.
Previous months’ tallies also gained due to revisions. May’s anemic 11,000 gain got bumped up to 24,000 while the strong June number moved from 287,000 to 292,000.
Sometimes the stock market has a life of it’s own, sometimes, for example, going up for no apparent reason. It’s only later that a reason is discovered, and this time turns out the Swiss National Bank has been buying US stocks in very large quantities as part of its reserve management policy. And to buy that much stock ‘at the market’ means the price has to go up sufficiently to attract that many sellers, which itself can create at ‘top’ when that buying ends:
SNB’s U.S. Equity Holdings Hit Record $61.8 Billion Last Quarter
Interesting mix of orders highlighted:
Germany Factory Orders
German industrial orders unexpectedly fell 0.4 percent month-on-month in June of 2016, following an upwardly revised 0.1 percent rise in May and missing market consensus of a 0.6 percent gain. While domestic demand increased by 0.7 percent, foreign orders dropped by 1.2 percent. New orders from the euro area were down 8.5 percent. In contrast, those from other countries were up by 3.8 percent.
Real final domestic demand, Layoffs, Fed tax receipts, Factory orders
This was the component of GDP that was touted as a sign of underlying consumer strength, as per the last quarter over quarter move up:
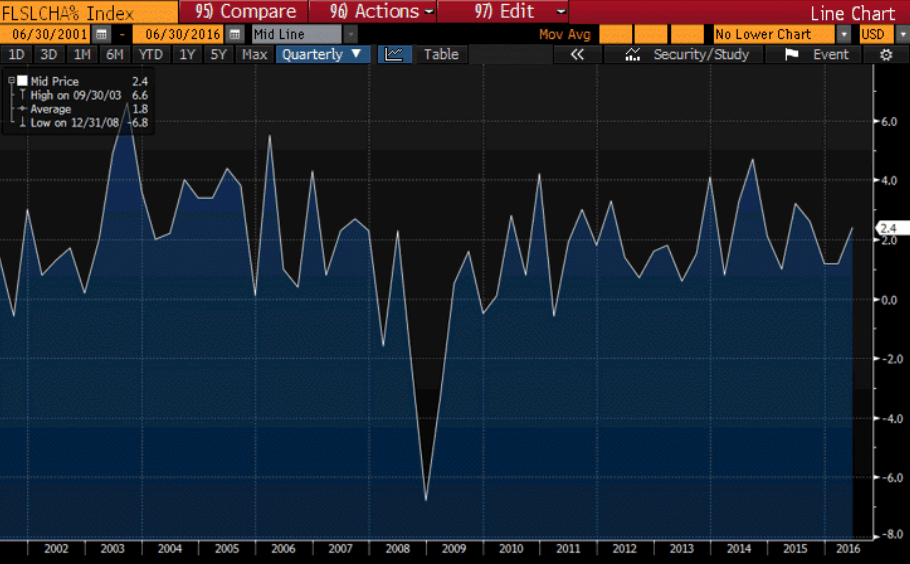
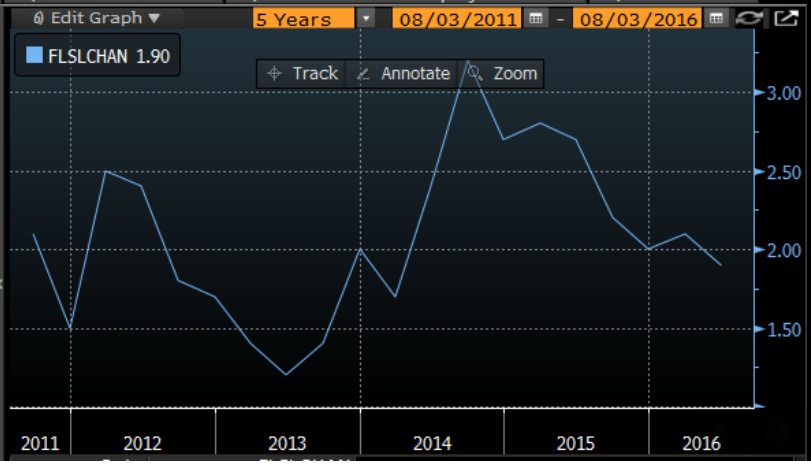
However, the same data looked as year over year change- call it a 12 month moving average- shows that looking past the data’s ‘volatility’ there was a move up during the last phase of the burst of oil related capital expenditures chasing $100 oil followed by a continuous deceleration that began when the oil related capital expenditures collapsed:
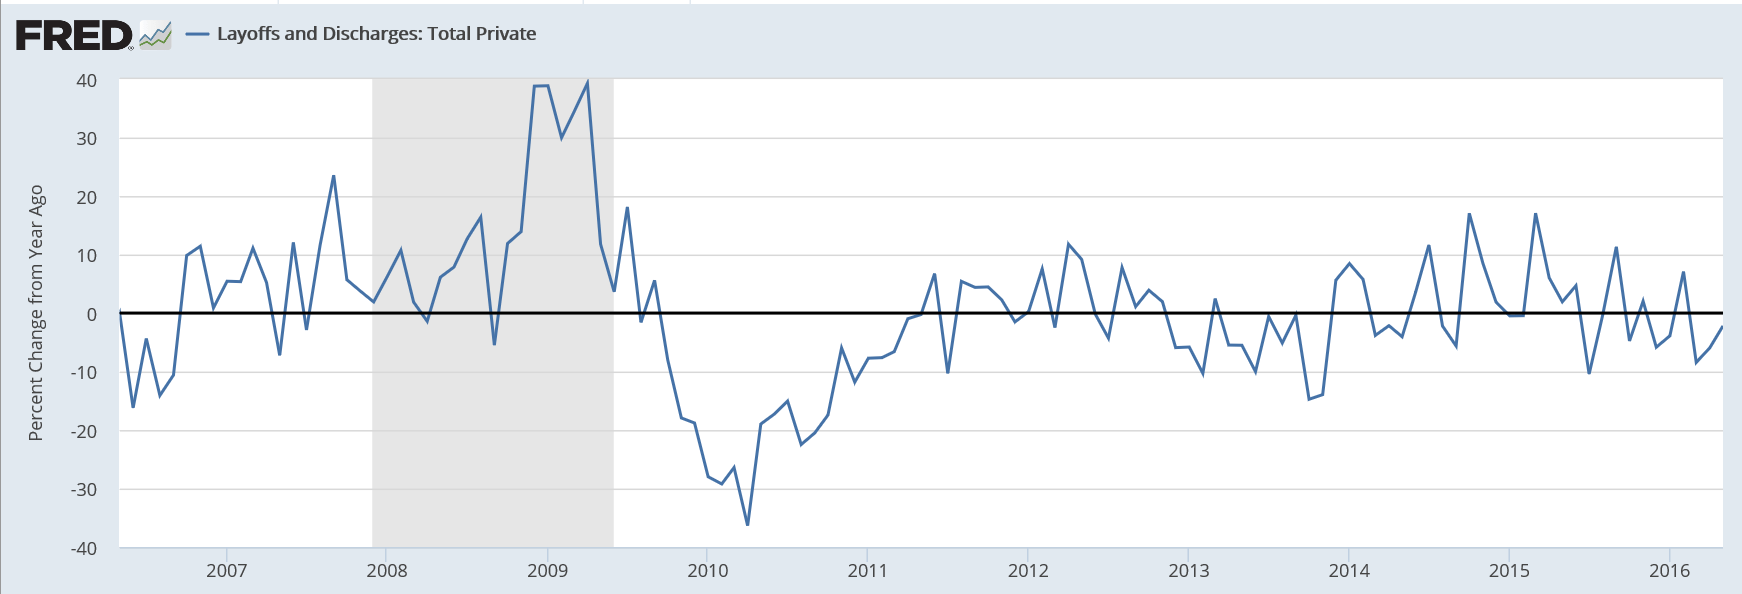
Excess inventory in the service sector is largely about employees. When sales growth slows faster than headcount, it can be said that firms are building (human) inventory. Productivity is output per employee, which can be an indicator of excess capacity as well. And at some point firms make the adjustment to lower sales growth and cut headcount, either directly or through attrition:
Layoffs increased a bit with the oil capex collapse, then moderated. with the adjustment coming from the reduced pace of hiring. However with hiring still growing faster than real GDP growth would dictate, looks to me like the US economy remains ‘over staffed’:

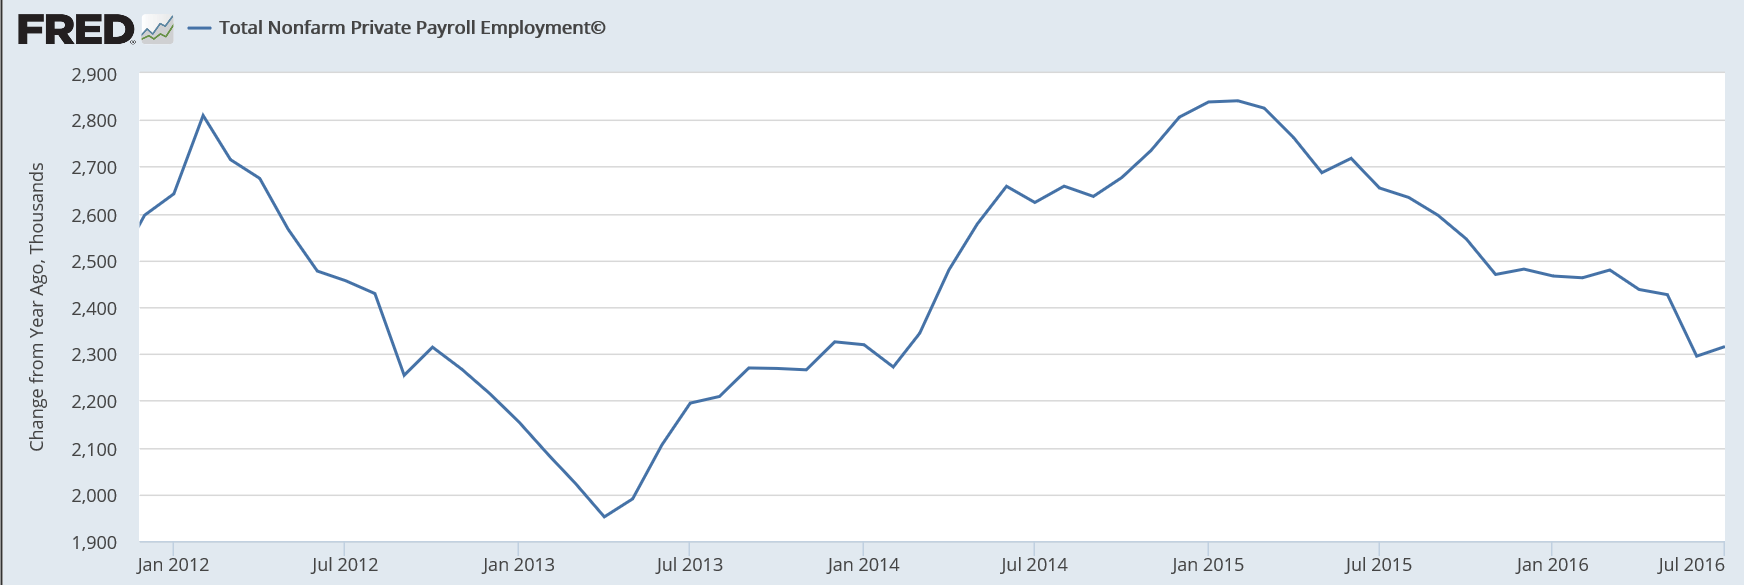
Familiar pattern here- employment growth increased as the shale boom started and reversed when it collapsed. Without some new credit driven boom seems to me the deceleration continues:
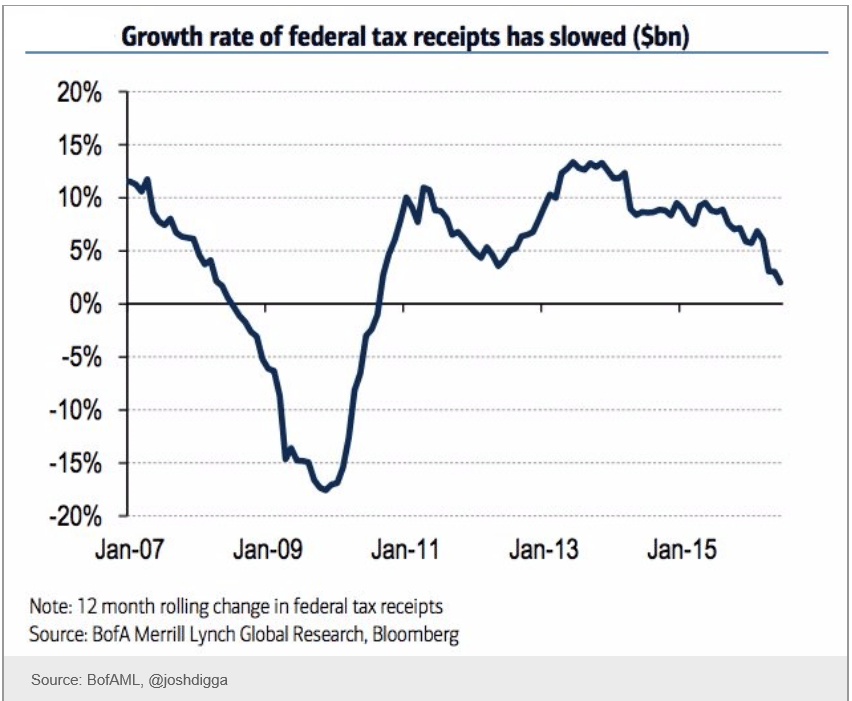
Same pattern here:
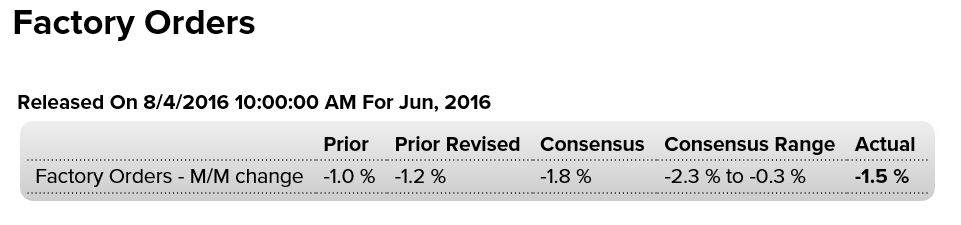
A bit better than expected but prior month revised down:
Highlights
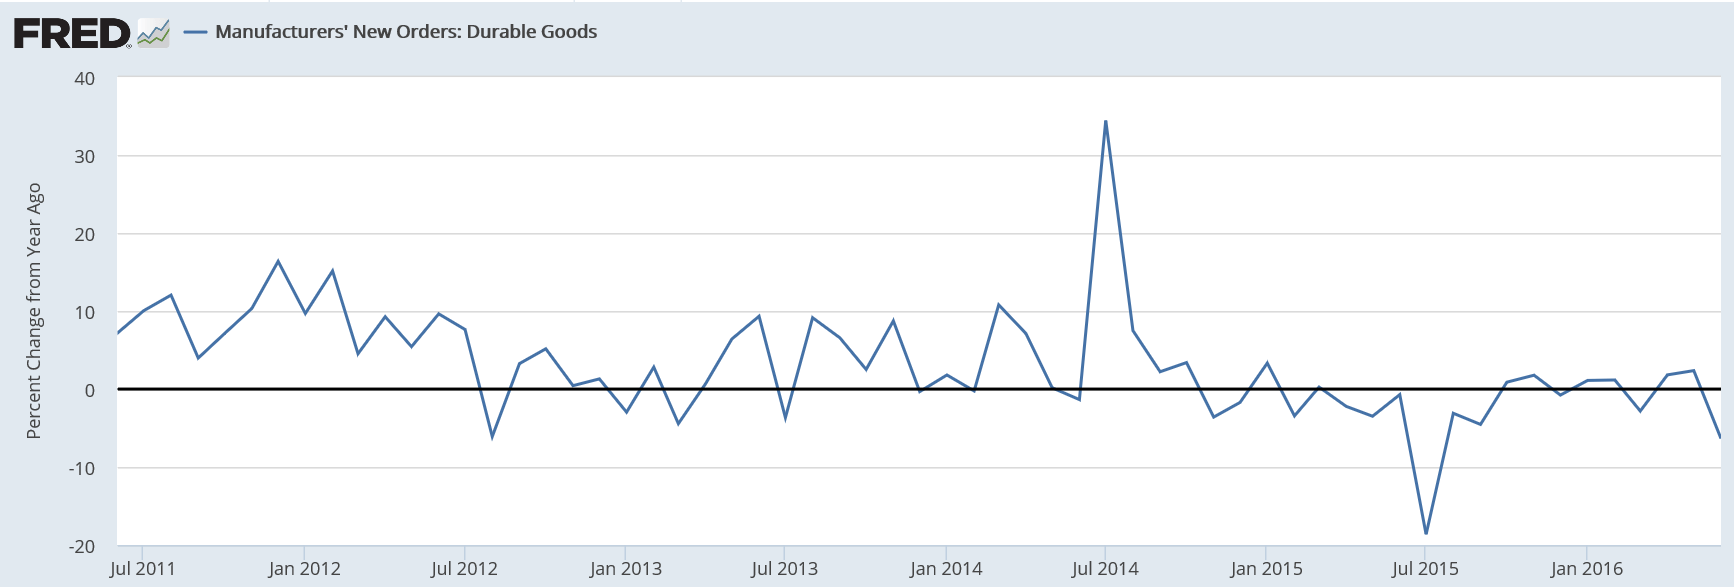
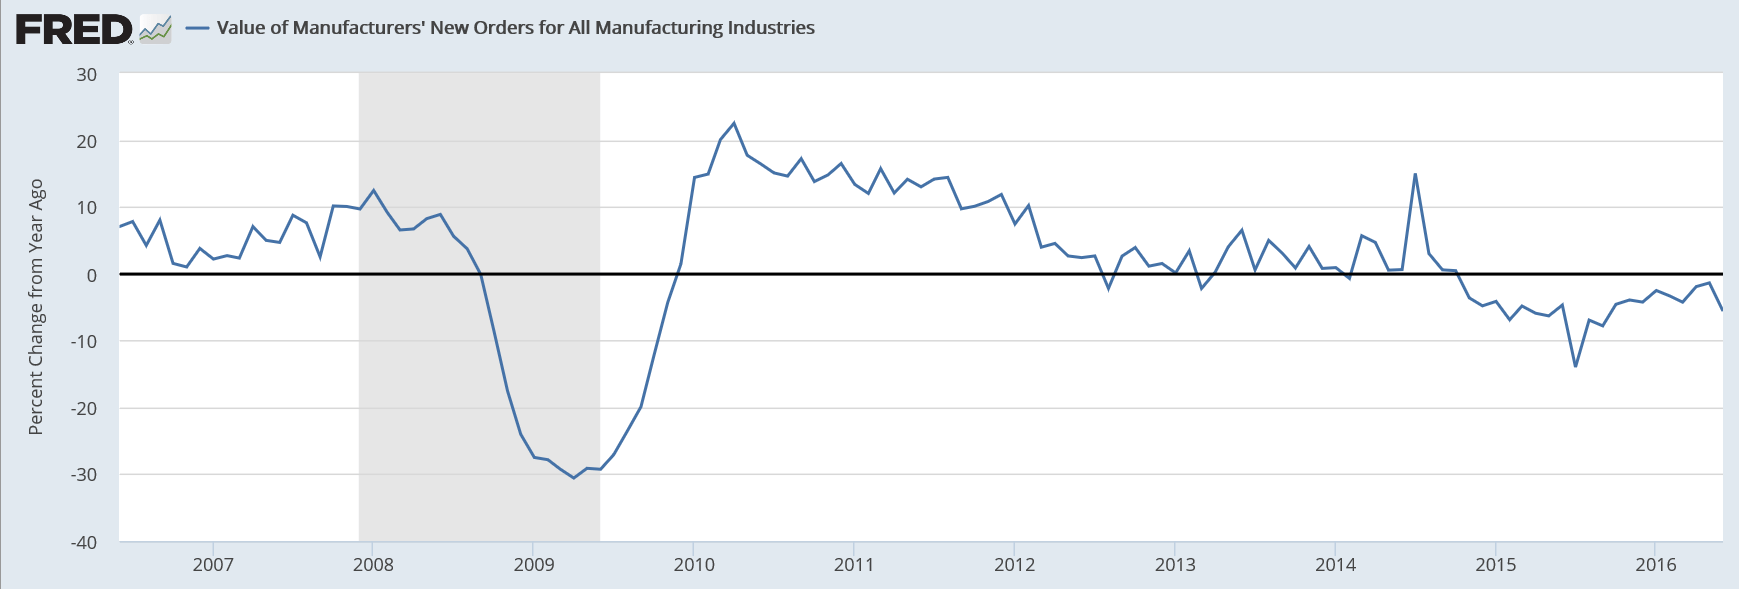
Anecdotal reports on the factory sector have shown isolated strength that actual government data have yet to show. Factory orders fell a sizable 1.5 percent in June following a downward revised 1.2 percent decline in May. Core capital goods (nondefense ex-aircraft) have been especially weak though orders did rise 0.4 percent in June. Shipments for this category, however, slipped 0.2 percent following a downward revised 0.7 percent decline in June in readings that will not boost revision estimates for second-quarter GDP.Orders for nondurable goods were a plus in June, rising 1.0 percent but reflect price effects tied to energy products. Durable goods fell 3.9 percent in the month which is one 1 tenth lower than last week’s advance report for this component. Orders for computers & electronics were especially weak in the month as were orders for transportation equipment with civilian aircraft, which is always volatile month to month but nevertheless has been weakening on trend, falling 59 percent. Vehicles are a plus in the report, with orders up 3.2 percent.
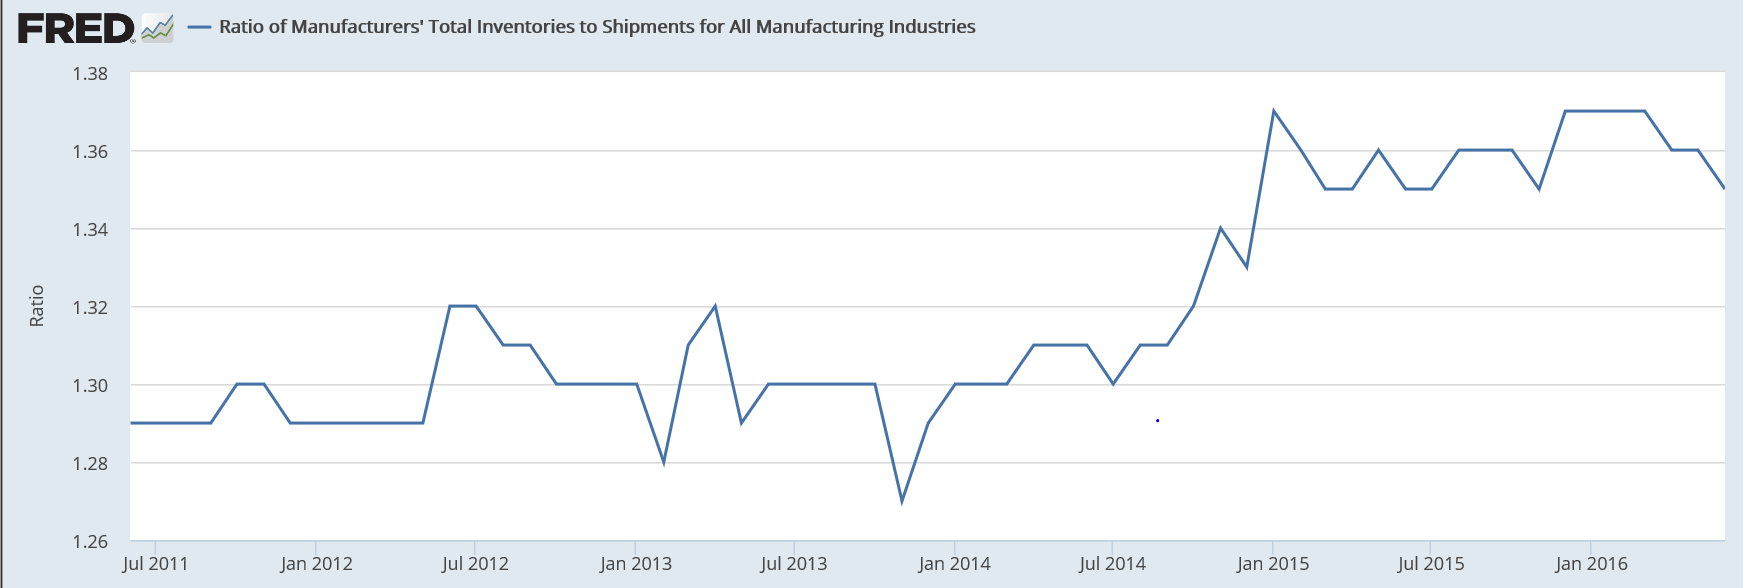
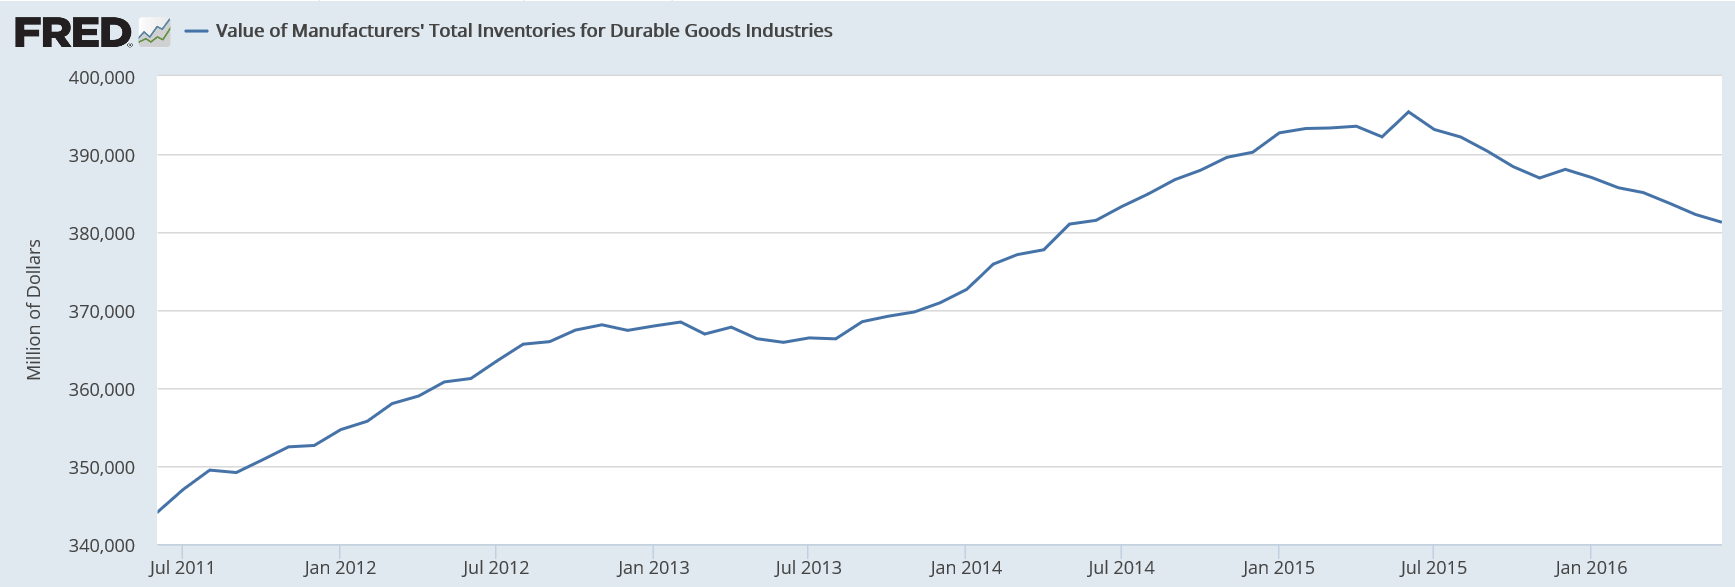
A major negative in the report is a 0.8 percent drop in total unfilled orders where contraction is a negative for factory employment. Total shipments are a positive, up 0.7 percent in a gain that may not be repeated should orders stay weak. A plus is that inventories edged lower, pulling down the inventory-to-shipment ratio to 1.35 from 1.36.
The factory sector, held down by weak exports and weak business investment centered in energy, has shown isolated signs of life but has yet to pull its weight so far this year.
Inventories still way too high relative to shipments:
Inventories coming down but not fast enough to overtake declines in shipments:
Auto sales, Mtg purchase applications, Secular stagnation, PMI services index ISM sesrvices
Lightweight cars and trucks better than expected, but heavy weight truck sales brought down the total:
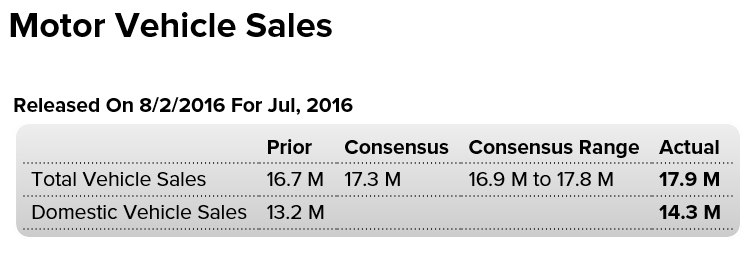
Highlights
July proved to be a very strong month for vehicle sales, pointing to accelerating strength for consumer spending. Vehicles sold at a 17.9 million annualized rate in the month which is far above June’s 16.7 million. Unit sales offer only a rough indication for the motor vehicle component of the retail sales report but July’s indication is unusually strong. Sales are getting a boost from favorable loan terms and aggressive manufacturer incentives.One detail especially pointing to strength for the retail sales report is an outsized gain for North American-made light trucks, to a 9.1 million rate from June’s 8.3 million. Trucks on average cost more than cars which will help the dollar totals of the retail sales report. Motor vehicle sales make up about 20 percent of total retail sales.
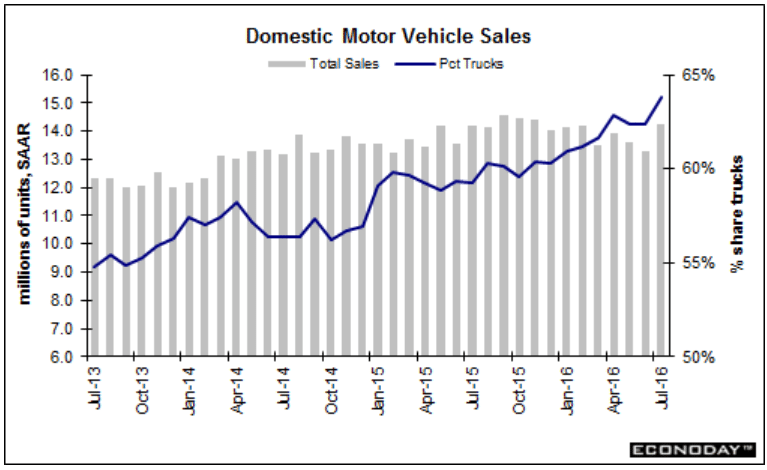
Domestic sales:
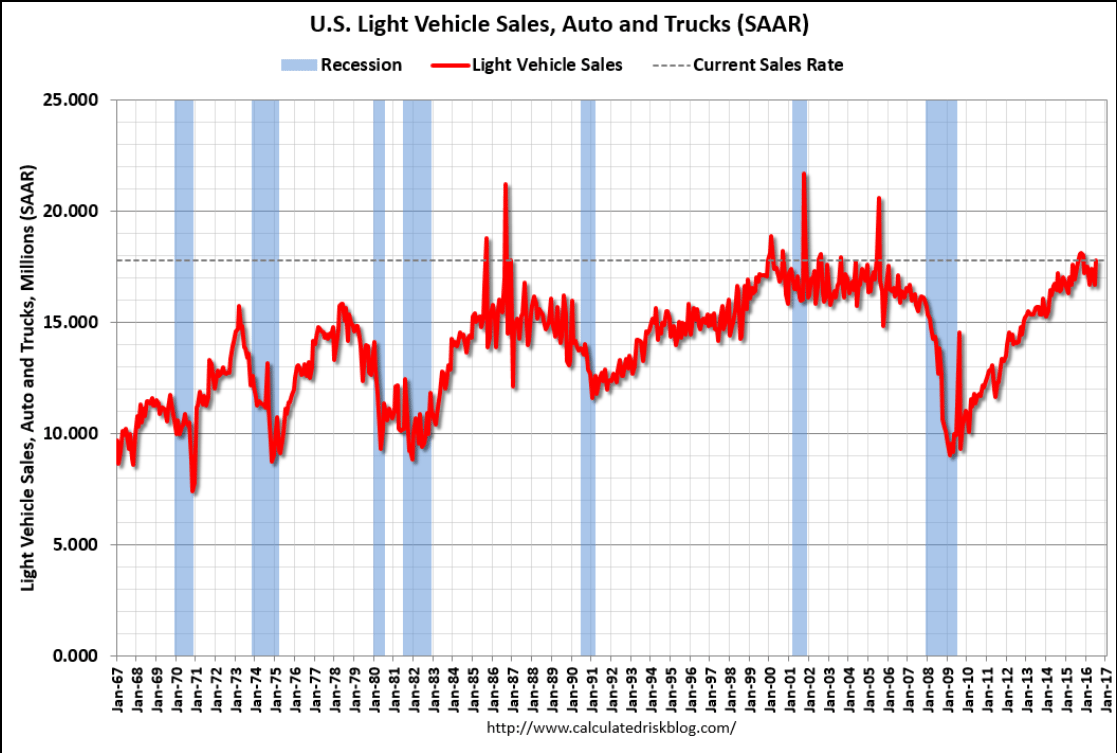
Total domestic and imported light vehicle sales:
Heavy weight truck sales (and these cost a lot more than light weight trucks) brought total vehicle sales down from the prior month:
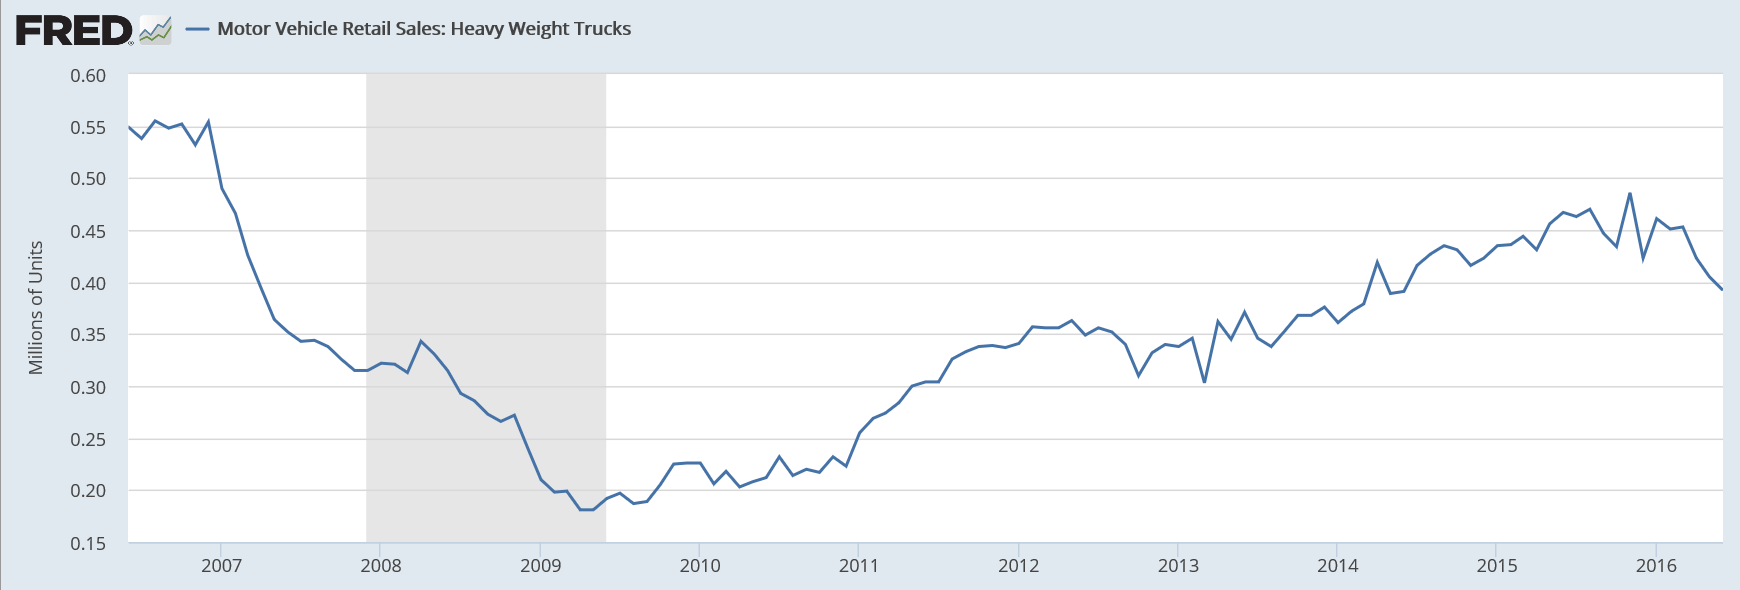
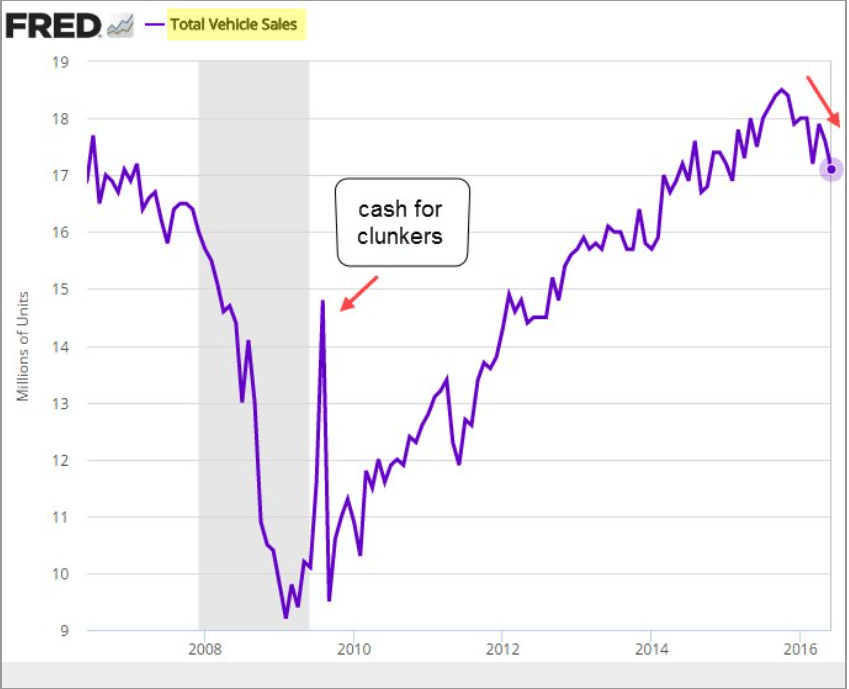
Not good! Down, and the year over year change has been dropping steadily as well:
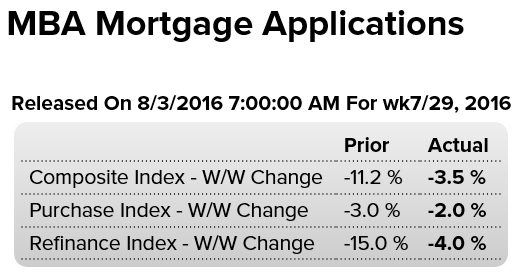
“…the seasonally adjusted Government Purchase Index fell to the lowest level since November 2015. The unadjusted Purchase Index decreased 2 percent compared with the previous week and was 6 percent higher than the same week one year ago.”
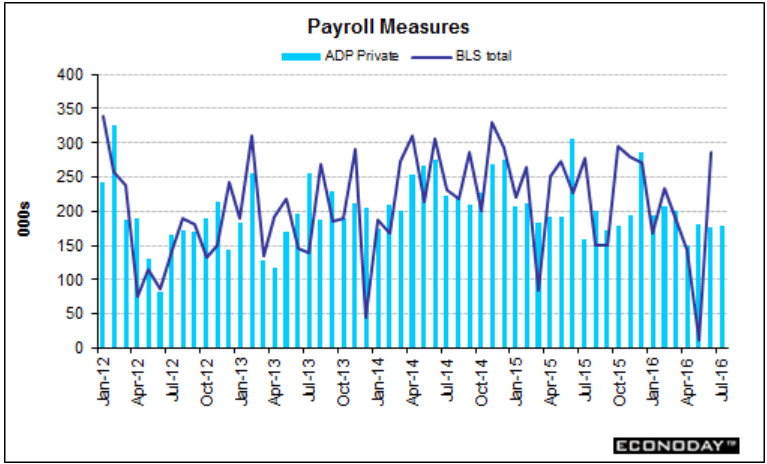
This is a forecast and not a survey:
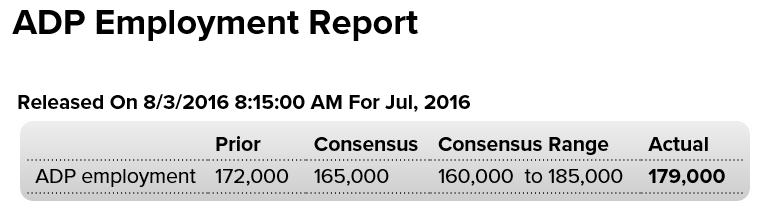
Highlights
Growth in the labor market held firm and steady in July, based on ADP’s 179,000 estimate for private payrolls in Friday’s employment report. The result is near the top-end of the Econoday forecast range and is slightly higher than ADP’s estimate for June. And June proved very strong in the government data, up 265,000. Next indication on Friday’s data will be the ISM’s non-manufacturing employment index to be released later this morning at 10:00 a.m. ET.
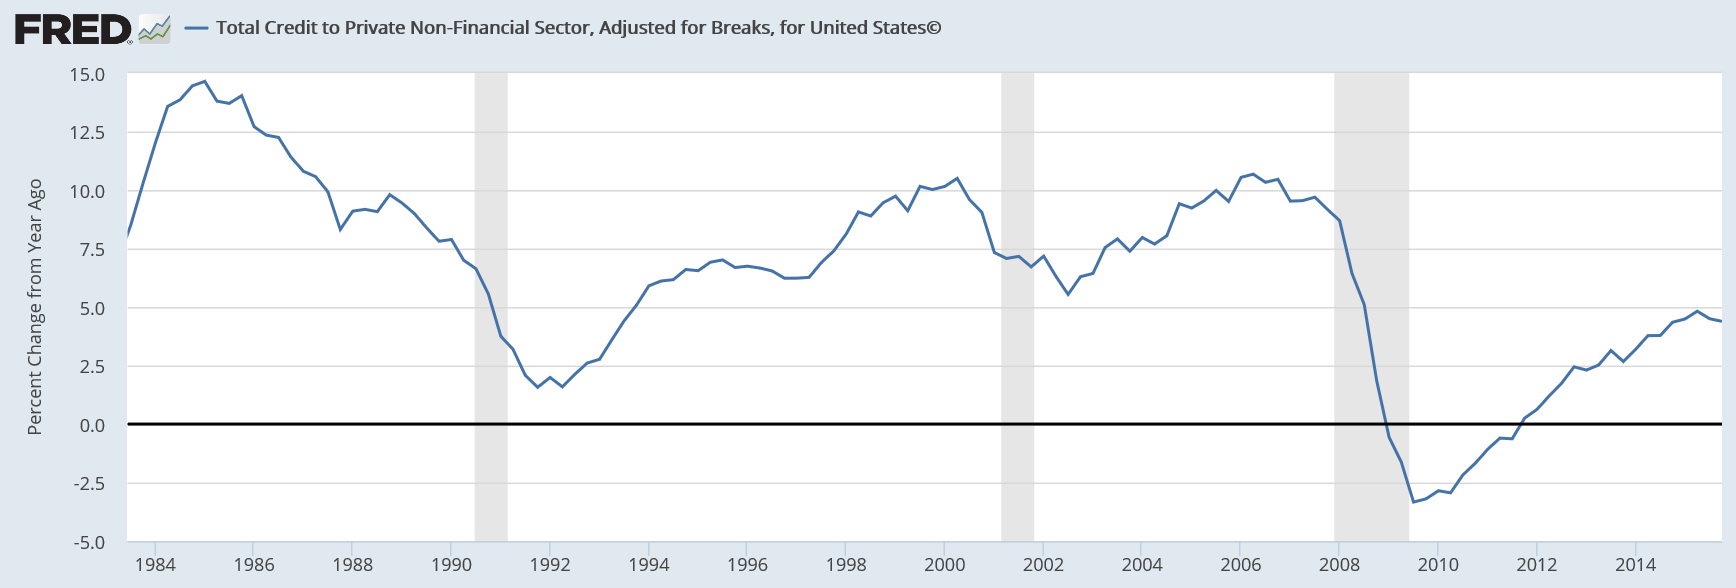
Gradually working it’s way lower:
Secular stagnation is entirely about the lack of private sector credit growth without ‘compensating’ deficits from the public sector. It’s always an unspent income story…
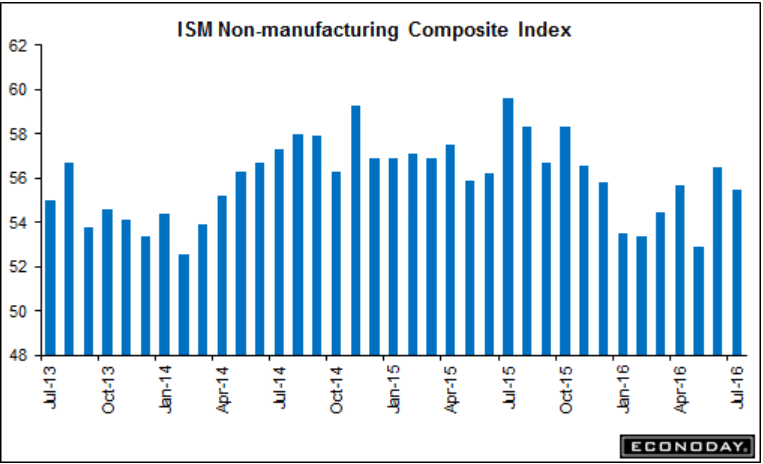
Manufacturing was a bit better but services, the much larger sector, remains at the lows, as previously discussed:
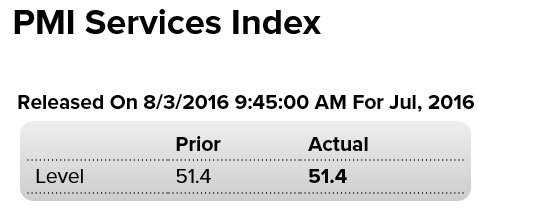
A bit worse than expected:
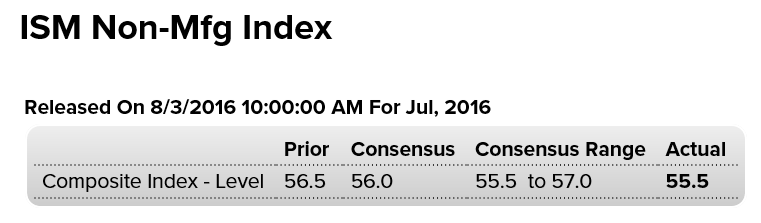
Highlights
Conditions, especially for orders, remain very strong for the ISM’s non-manufacturing sample. The report’s composite index did slip 1.0 point to 55.5 which is slightly below expectations but new orders rose in the month, up 4 tenths to 60.3 for the best showing since October last year. The bulk of the decline in the composite is due to a 3 point drop in delivery times which, in a signal of easing constraints in the supply chain, slowed only slightly in the month.
The other negative factor for the composite is a noticeable dip in employment, down 1.3 points to a very soft 51.4. This reading, in contrast to other advance indications, is not pointing to much strength for Friday’s employment report. But other readings are very positive including business activity at 59.3, export orders at 55.5, and total backlog orders at 51.0 for a 4.5 point gain.
The order strength in this report points to early third-quarter acceleration for the bulk of the U.S. economy.
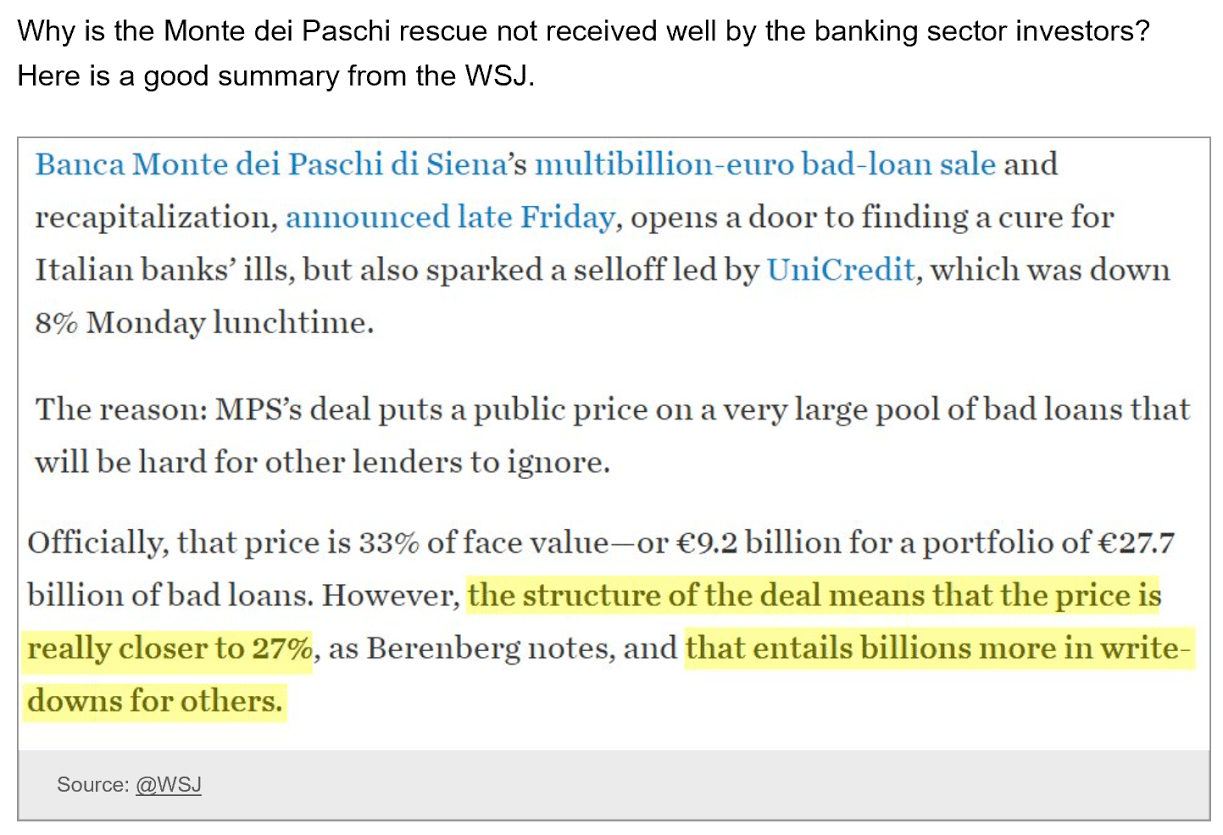
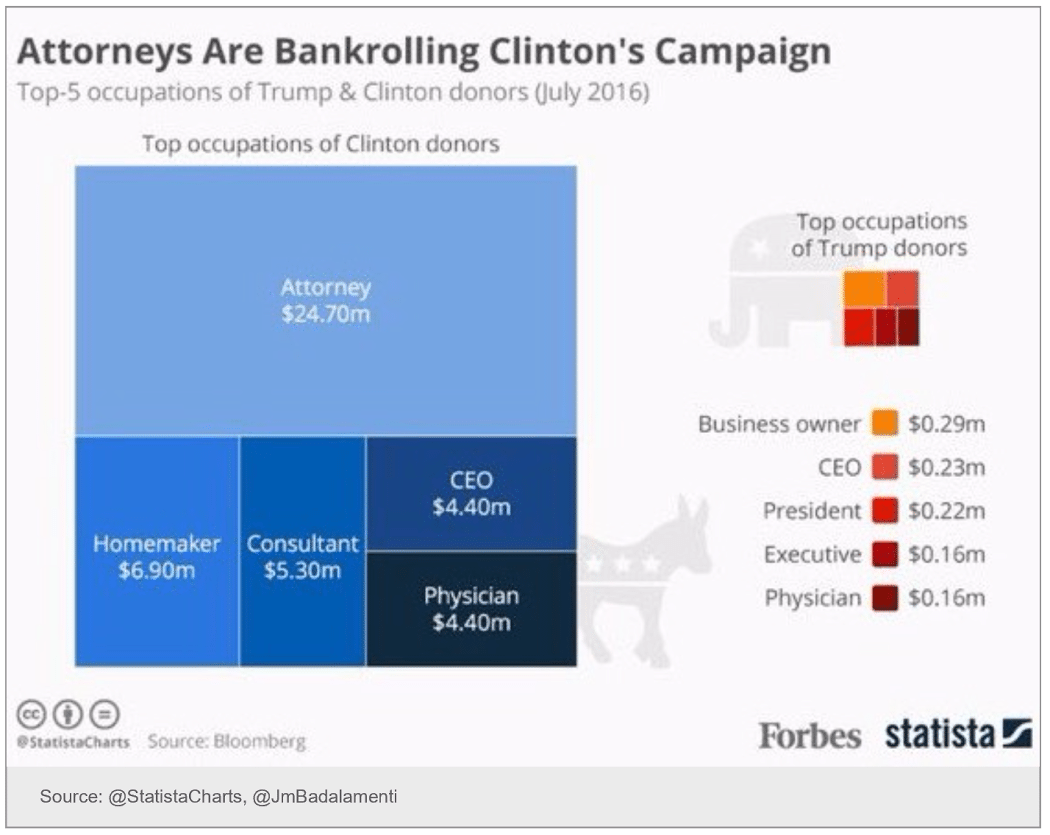
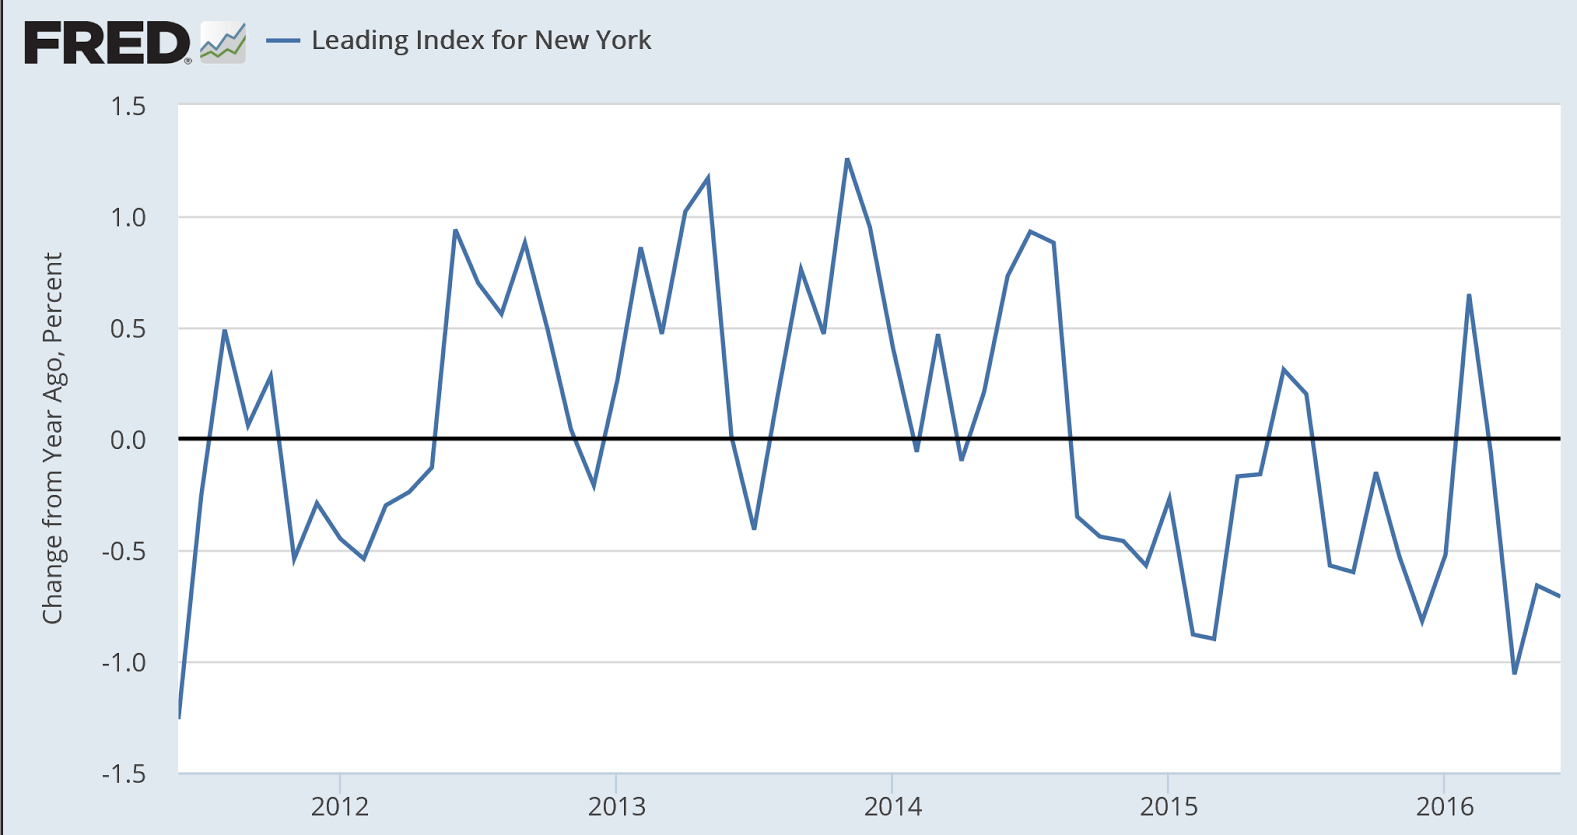
Italian banks, Campaign finance, NY ISM, July vehicle sales
Even this shows deceleration since the oil capex collapse:
Early preview, not looking good:
U.S. July auto sales miss estimates as pent-up demand slackens
By Bernie Woodall
August 2 (Reuters) — DETROIT: Four major automakers in the U.S. market on Tuesday reported July vehicle sales slightly below expectations as the pent-up demand that has helped drive sales since 2009 plays itself out.
In a continuing trend, consumers shunned passenger cars in favor of SUVs and pickup trucks.
General Motors Co sales fell 2 percent to 267,258 vehicles, at the low end of analysts’ expectations. GM is No. 1 in U.S. auto sales.
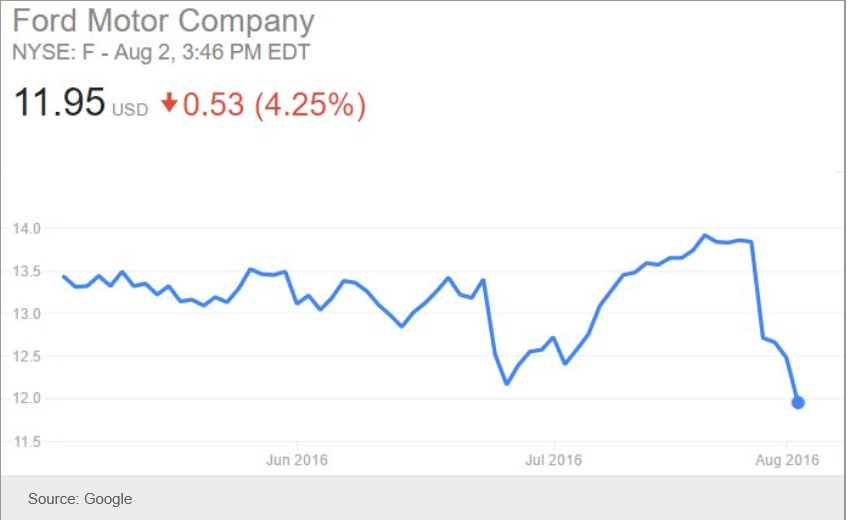
Ford Motor Co , No. 2 in U.S. auto sales, said its sales fell 3 percent in July at 216,479 vehicles, which was less than analysts had expected.
GM and U.S.-traded shares of Fiat Chrysler dropped about 4 percent while Ford fell 3.4 percent.
Ford last week became the first major auto manufacturer to predict an end to increasing annual sales since 2009, a forecast that many Wall Street analysts had been making for months.
Fiat Chrysler Automobiles NV said its sales rose 0.3 percent.
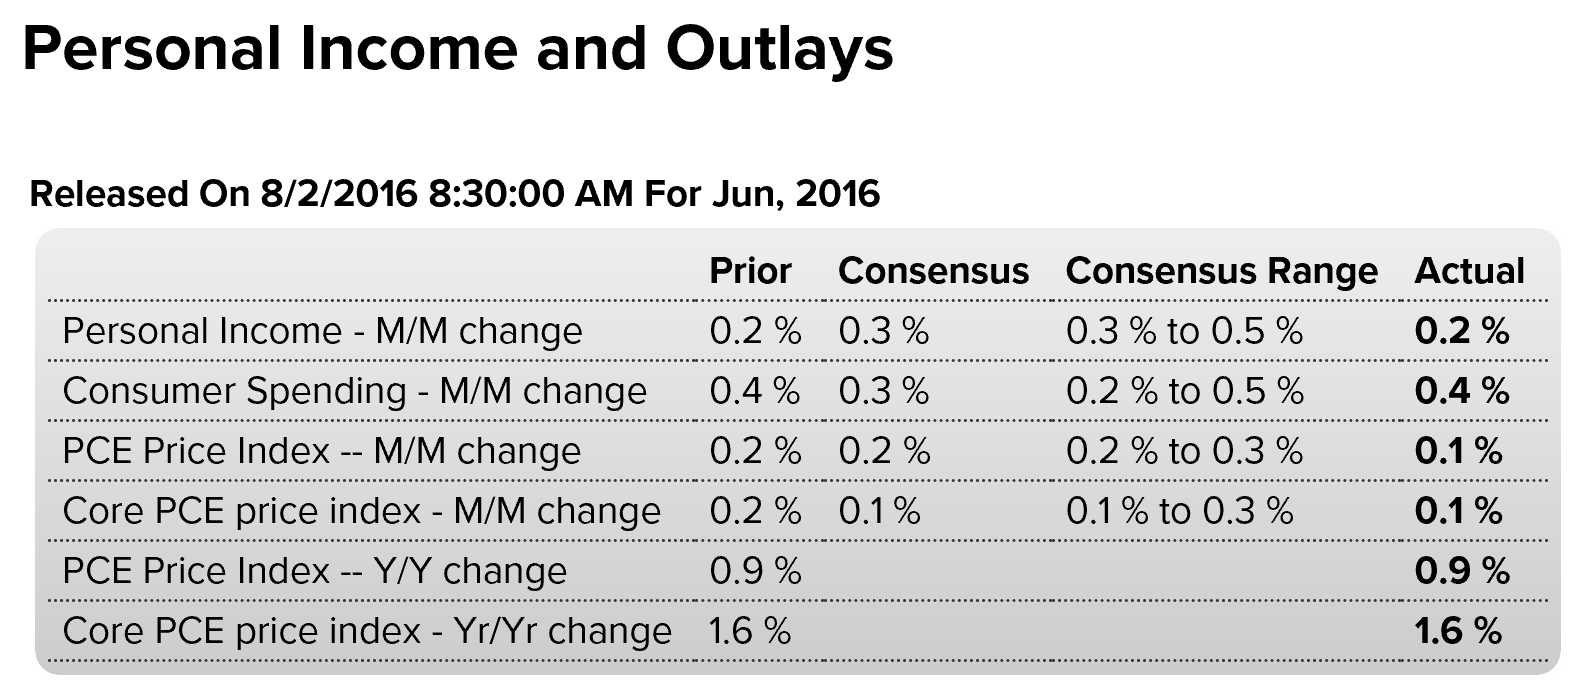
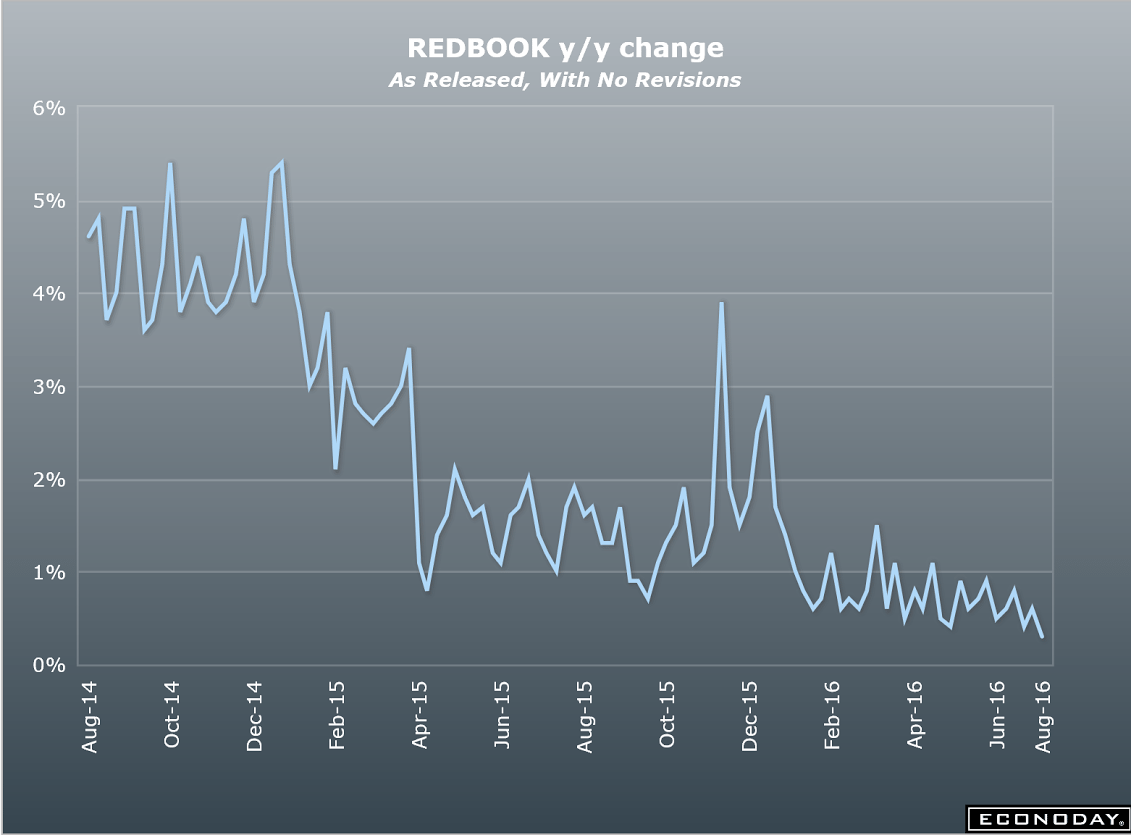
Personal income and outlays, Redbook retail sales, Saudi price setting
Income a tenth lower than expected and remains depressed, spending was a tenth better than expected and up on higher energy prices. So looks to me like a mini ‘dip into savings’ that works against retail sales, etc. but just a guess.
Prices a touch softer than expected and remain well below Fed’s target.
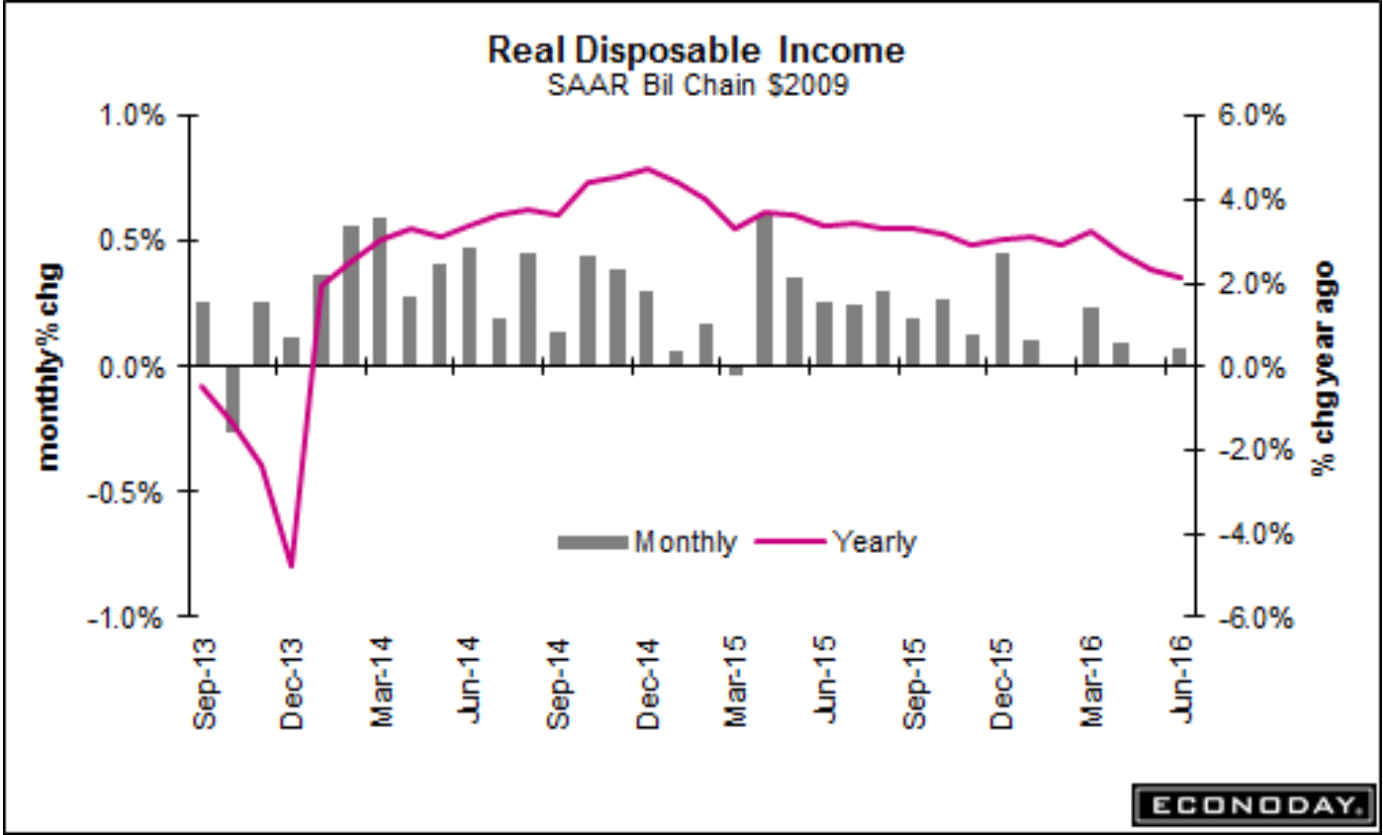
And note the deceleration of the annual growth of real disposable personal income as per the chart, which is down to stall speed:
Highlights
The consumer continues to spend though income isn’t that strong. Personal income, for a second month in a row, inched 0.2 percent higher in June, in contrast to spending which, also for a second month in a row, rose 0.4 percent. The gain in spending was funded to a degree by savings as the savings rate is down 2 tenths to 5.3 percent.There isn’t much positive movement in inflation data with both the overall PCE index and the core index (ex-food ex-energy) up only 0.1 percent. Year-on-year shows no improvement at all with the overall rate unchanged at plus 0.9 percent and unchanged at plus 1.6 percent for the core.
Turning back to income, wages & salaries did improve a bit, up 1 tenth for a plus 0.3 percent gain. Details on spending show an outsized 0.7 percent increase in nondurables in a gain, however, tied in part to higher oil prices, not increased demand. Service spending rose a very solid 0.5 percent for a second straight month while durable goods fell 0.3 percent in June following a 0.4 percent decline in May, both reflecting weak vehicle sales. Durable goods are a sleeper here for July, possibly bouncing back should vehicle sales prove strong (July unit vehicle sales will be posted through the day).
This report is moderate. The strength in spending needs to continue for the economy but spending won’t have much legs if income doesn’t pick up.
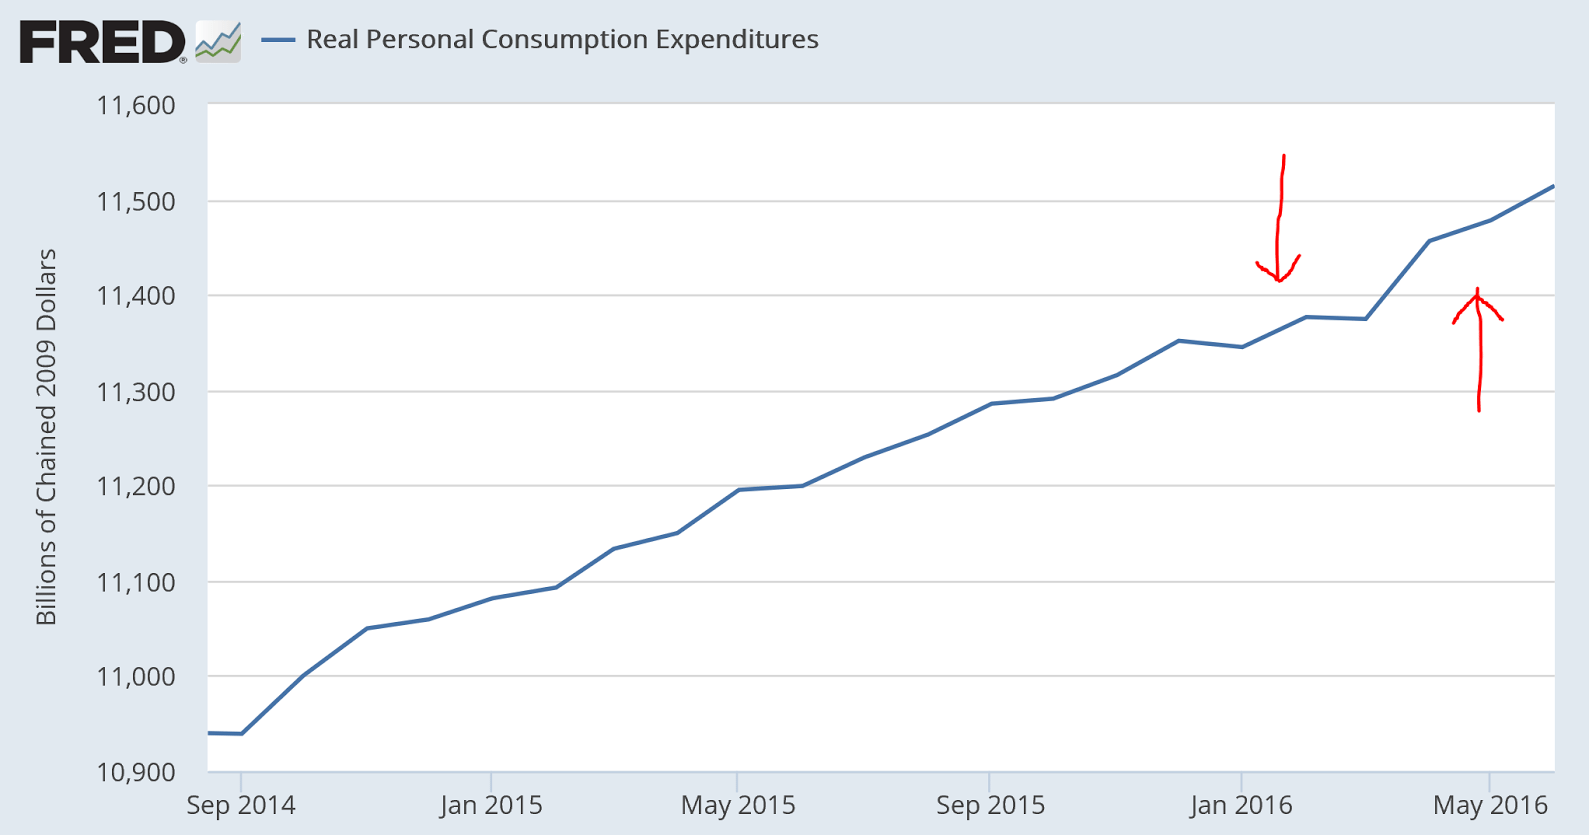
Note the general deceleration in consumption after oil capex collapsed:
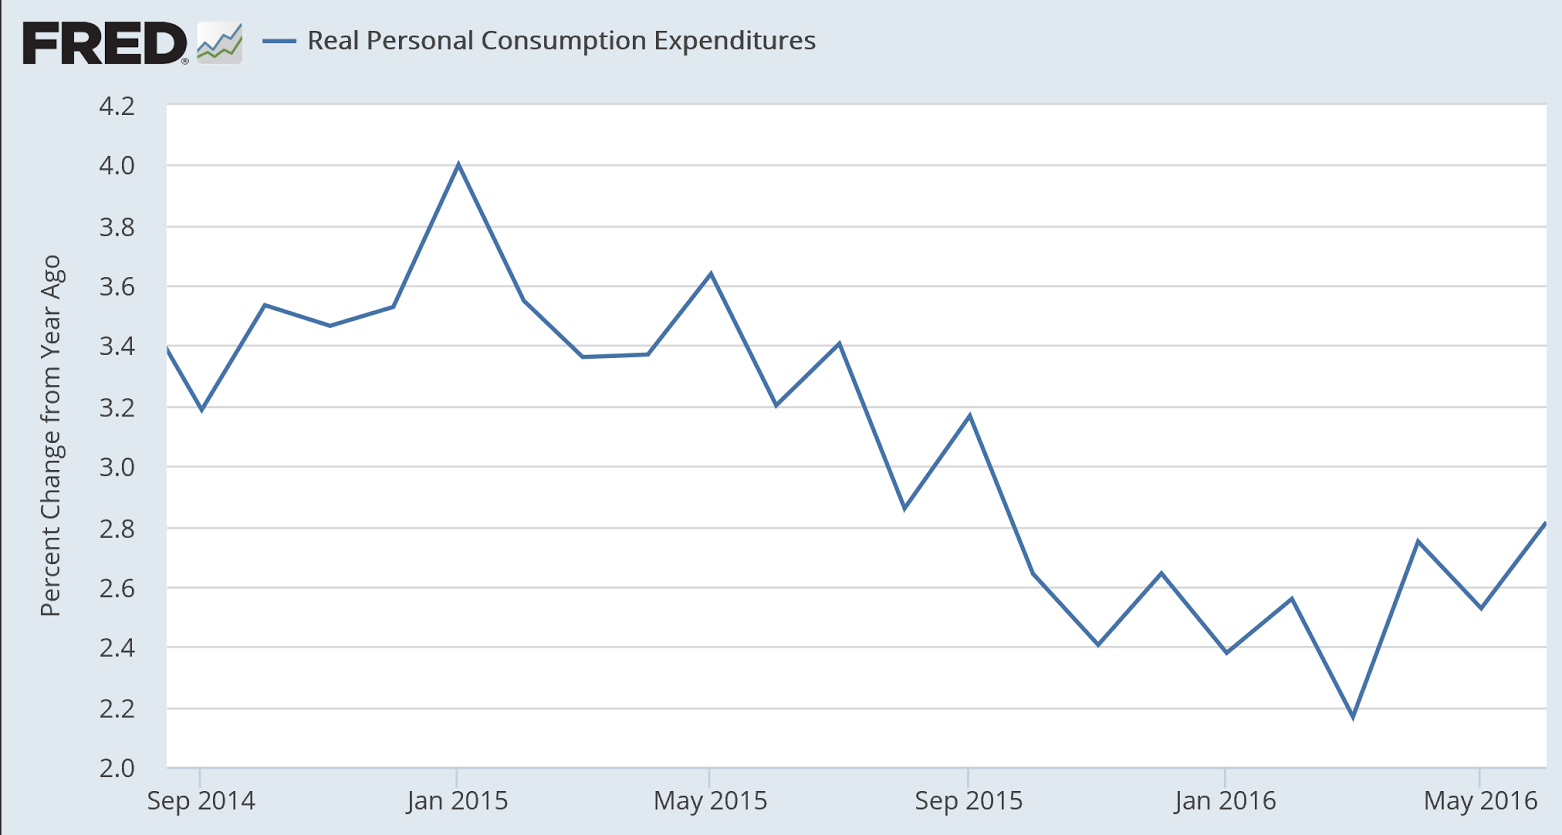
And the latest mini move up came after a mini dip:
And this keeps getting worse, most recently perhaps due to the increased spending on energy?
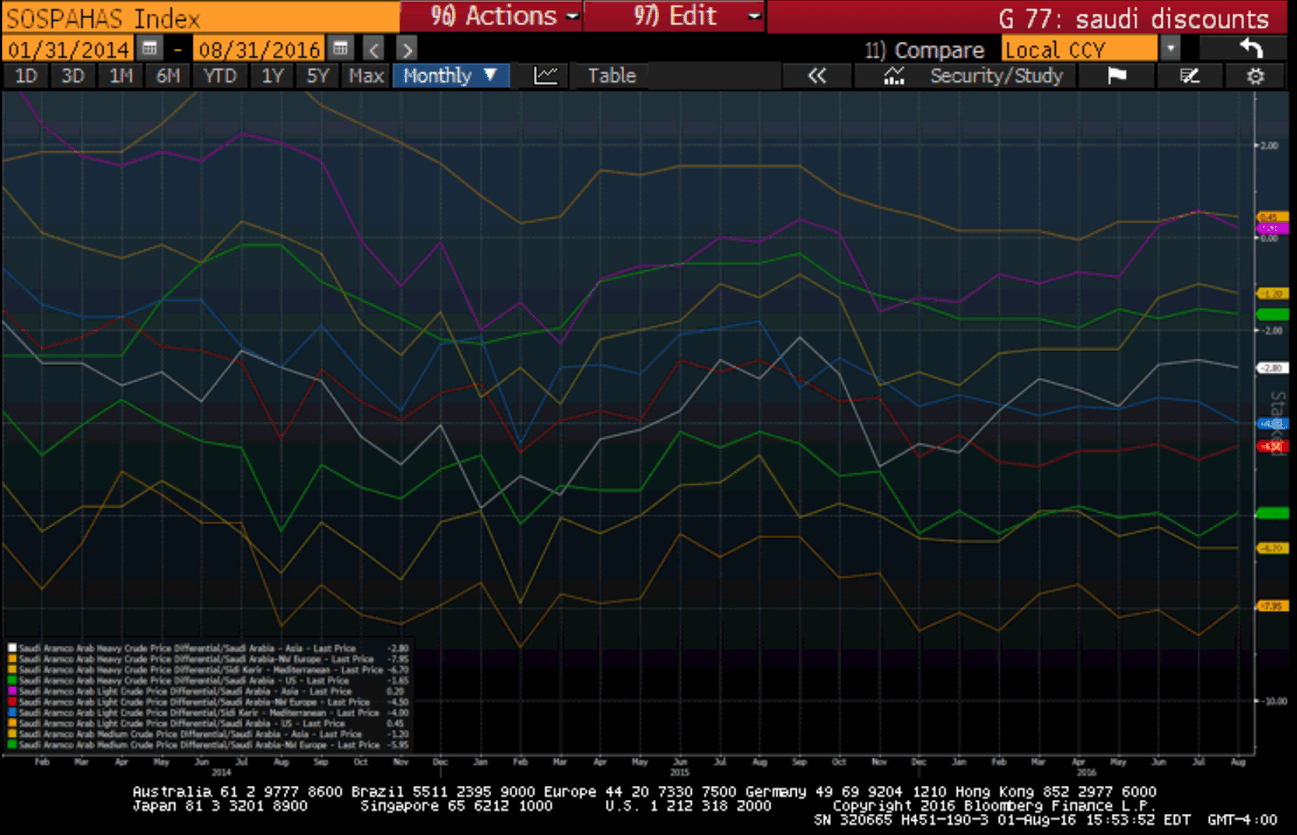
Seems when the rig count went up they cut prices, as per my post a few weeks ago, and it’s still ongoing:
Saudi Arabia Cuts Oil Price to Asia as Iran Battle Heats Up
By Sam Wilkin
August 2 (Bloomberg) — Saudi Aramco, the world’s largest oil exporter, lowered the pricing terms for Arab Light crude sold to Asia by the most in 10 months, signaling Saudi Arabia has no plans to back down while OPEC rival Iran tries to regain market share amid a global
State-owned Saudi Arabian Oil Co. said Sunday it will sell cargoes of Arab Light in September at $1.10 a barrel below Asia’s regional benchmark. That is a pricing cut of $1.30 from August, the biggest drop since November, according to data compiled by Bloomberg. The company was expected to lower the pricing by $1 a barrel, according to the median estimate in a Bloomberg survey of eight refiners and traders.
This is the last Saudi discount chart before the most recent announcements: