Personal income and spending, ISM Chicago, Consumer sentiment, Atlanta Fed GDP forecast

The consumer isn’t ‘coming back’ until after deficit spending, public or private, increases to offset unspent income, and ‘putting money into savings’ (below) is better described as ‘increasing borrowing less’. Also, consumption spending includes health care premiums and utility bills, and when they go up it tends to later take away from spending on other things:
93001

Highlights

August was a soft month for the consumer, both for income and especially for spending. Income rose only 0.2 percent in the month as wages & salaries, which had been on a 4-month surge, could inch only 1 tenth higher in August. Consumer spending, which had also been on a 4-month winning streak, came in unchanged as durable goods declined, largely reflecting monthly weakness in vehicle sales, as did non-durable goods, in part reflecting low fuel prices. Service spending advanced, at plus 0.3 percent, but at a slower rate than prior months. Despite the weakness in income, the consumer put money into savings which are at a 5.7 percent rate for a 1 tenth gain and a special factor that held down spending.

Inflation readings do show more life with the PCE price index up 0.1 percent and the core up 0.2 percent, both 1 tenth better than the prior month. Year-on-year, the overall measure rose 2 tenths to 1.0 percent with the core up 1 tenth to 1.7 percent and inching toward the Fed’s 2 percent goal.

For policy makers, what strength there is in prices is probably offset by the softness in income and spending. But the results of this report are no surprise, ultimately reflecting what was only a moderate gain for payrolls in August.

93002
The shale boom reversed the slide into recession, the shale bust reversed the shale boom and it’s back down again:

93003
Both up a bit more than expected:

93004

93005
Down again, for reasons previously discussed, likely more to come for same reasons:

93006

Pending home sales, Auto sales, Wholesale trade

Still on the downward glide path since the collapse in oil capex:

92901

Highlights

Existing home sales, in sharp contrast to new home sales, haven’t been able to build any strength this year and today’s pending home sales report points to outright weakness in the coming months. The pending index fell a very steep 2.4 percent in August with 3 of 4 regions positing monthly declines. The exception is the Northeast which rose 1.3 percent in the month and is the only region in the plus column for the year-on-year rate, at 5.9 percent. But this report is not about strength but weakness, weakness that persists despite very low mortgage rates and strength in the labor market.

92902
Housing and autos are the two main sources of consumer credit growth and neither looking so good:

Kelley Blue Book sees September U.S. auto sales down 2 percent

By Bernie Woodall

Sept 28 (Reuters) — Auto industry consultancy Kelley Blue Book said on Wednesday that it expected that September U.S. auto sales fell 2 percent from a year ago, at 1.41 million vehicles, for a seasonally adjusted annualized rate of 17.4 million vehicles. Major auto manufacturers will report U.S. sales for September on Monday.

Inventories still coming down, with no sign yet of the reversal most have forecast for q3:

92903

Highlights

Wholesale inventories fell a preliminary 0.1 percent in August with nondurables down 0.6 percent in what likely reflects price weakness for energy products. Inventories of durables in the wholesale sector rose 0.1 percent in the month. This report also includes preliminary data on retail inventories which rose 0.5 percent in the month and reflecting a 1.0 percent jump in vehicles.

Durable goods orders, Trucking tonnage index

Continues in contraction year over year, and revisions likely to cause further downward GDP revisions:

92801

Highlights

The headline, at a monthly zero percent, is flat and so are the indications from the bulk of the August durable goods report. Excluding transportation, orders slipped 0.4 percent. This reading excludes a 22 percent downswing in civilian aircraft orders that is offset in part, however, by a solid 0.7 percent gain for vehicle orders. Readings on core capital goods (nondefense excluding aircraft) are mixed with orders up 0.6 percent, which points to shipment strength ahead, but current shipments are down -0.4 to extend a long string of declines going back to May. The weakness here in shipments is a negative for business investment in the GDP report.

Aside from vehicles and a strong gain for defense capital goods, good news is hard to find in today’s report. Total shipments are down 0.4 percent following no change in July while unfilled orders, which last posted a gain in April, fell 0.1 percent. Inventories did fall, down 0.1 percent, but not enough to keep the inventory-to-shipments ratio from rising to a less lean 1.66 from July’s 1.65.

Another negative in the report is a downward revision to July where the gain in total orders is shaved 8 tenths to 3.6 percent. But July was still a very strong month and the August results, though flat, are better than expected. Still, the data point to more of the same for the factory sector, a flat trajectory reflecting weakness in global demand and specific weakness in business investment.

92802
Back up some:

92803

State tax receipts, Redbook retail sales, Case-Shiller house prices, PMI services, Richmond Fed manufacturing, consumer confidence

This too has followed the shale boom/bust cycle and is headed lower:

92701
No recovery here:

92702
This looks back over the last three months and seems to be decelerating from already modest levels:

92703

92704
Up a bit but still low:

92705
The flash Markit US Services PMI came in at 51.9 in September of 2016 from 51 in August, reaching the highest figure in five months and above market expectations of 51.1. Activity picked up for the first time in three months due to ongoing new business growth while new orders, employment and inflationary pressures eased.
92706
Still contracting:

92707
Here some good news! But as per the chart something changed after the collapse in oil capex? Maybe because confidence is one man, one vote, not one dollar, one vote?
92709

92708

New home sales, Dallas Fed

Settling back down. Without permit growth this isn’t going anywhere;

92601

Highlights

New home sales may have fallen back by a monthly 7.6 percent in August, but the 609,000 annualized rate is still above Econoday’s consensus for 598,000. And a major plus in the report is a surprise 5,000 upward revision to July which now stands at a cycle high of 659,000 and a monthly gain from June of 13.8 percent. The volatility of this series had made a downward revision to July a major risk in today’s report.

Prices are coming down which points to builder discounting. The median, at $284,000, is down 3.1 percent on the month and down 5.4 percent on the year. Prices aren’t getting much lift from stubbornly low supply which is at 4.6 months. Total new homes for sale, at 235,000, did rise in the month but only slightly. Year-on-year, supply is up 8.3 percent which, however, is far under the 20.6 percent gain in year-on-year sales.

Sales strength is coming out of the West, a focused region for builders where the 162,000 annualized rate is up 8.0 percent on the month and a whopping 35.0 percent on the year. All other regions show monthly declines including the largest region which is the South where the 343,000 rate is down 12.3 on the month but still up 15.9 percent on the year.

This is a very positive report which underscores the accelerating strength of the new home market, strength that is making up for less far momentum on the resale side.

92602

92603

Highlights

The Dallas production index, at 16.7 in today’s September report, continues to remain positive despite weakness in underlying demand. The general activity index remains in the negative column, at minus 3.7 to extend its long uninterrupted negative streak that started with the 2014 collapse in oil prices. New orders are at minus 2.9 this month with backlog orders at minus 1.1. Hiring is flat and the Dallas sample continues to draw down inventories, in part reflecting the month’s strength in production but also tight management given what are only modestly positive expectations in future business strength. Price data show weakness in selling prices but gains for wages & benefits. This report isn’t uniformly negative and joins what have been similarly weak but still mixed reports from other regional Feds this month.

Rail traffic, Philly Fed state index, NY Fed nowcast

Rail Week Ending 17 September 2016: Data Looks Better This Week

Week 37 of 2016 shows same week total rail traffic (from same week one year ago) contracted according to the Association of American Railroads (AAR) traffic data. However, the data was an improvement over last week.

Not looking so good:
92501

This one’s coming down as well:

September 23, 2016: Highlights

  • The FRBNY Staff Nowcast stands at 2.3% and 1.2% for 2016:Q3 and 2016:Q4, respectively.
  • Negative news since the report was last published two weeks ago pushed the nowcast down 0.5 percentage point for both Q3 and Q4.
  • The largest negative contributions over the last two weeks came from manufacturing, retail sales, and housing and construction data.
  • KC Fed, Recent presentation

    Better, apart from employment and prices, which happen to be the Fed’s mandate. So interesting that the KC Fed President wants to hike rates:

    92301

    Highlights

    Just about every month the Kansas City manufacturing index is in the negative column, but not in September which comes in at plus 6 for the second positive reading this year and the best reading since December 2014. New orders are sharply higher, at plus 12 vs August’s minus 7 with backlogs holding steady. Production and shipments are especially strong this month, at plus 15 and plus 16 vs negative readings in August. Employment, however, is still contracting, at minus 3. Prices are very soft especially selling prices which are at minus 7 for a second straight month. Kansas City, like the Dallas region, has been getting hit hard by low energy and commodity prices though this report does mark a rare respite.

    Slides from yesterday’s presentation:

    us-macro-update

    Fed comments, Chicago Fed, Existing home sales

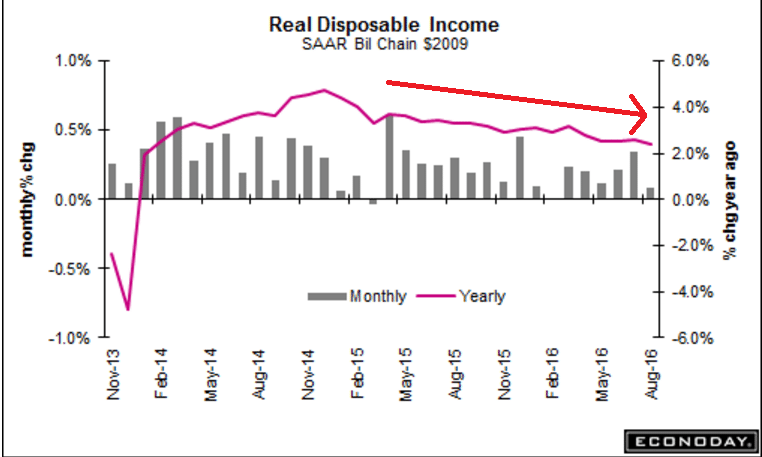
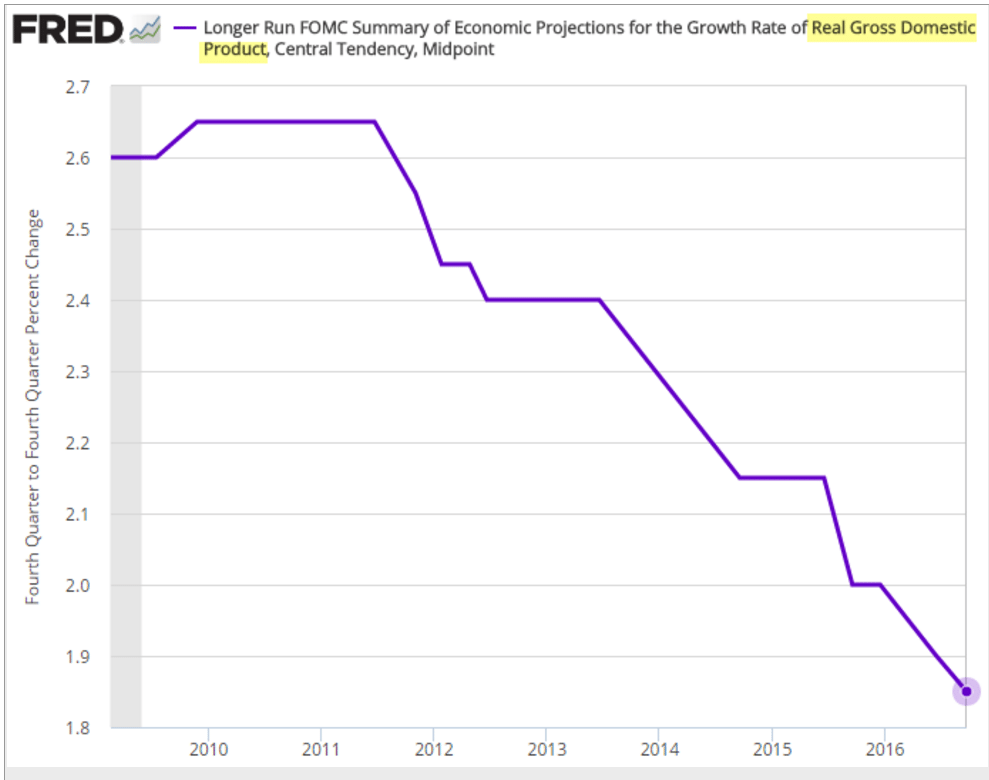
    So growth and employment prospects are lower than those of their prior meeting, when they didn’t raise rates. And their forecasts continue to decelerate:

    Fed Trims Interest-Rate, Growth Forecasts

    By Michael S. Derby

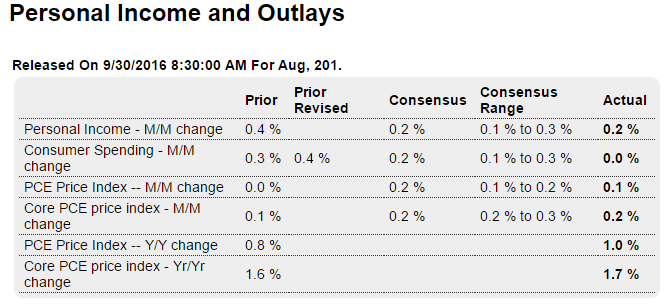
    Sept 21 (WSJ) — Federal Reserve officials cut their growth forecast for this year to 1.8%, from 2.0% in June, and held steady their view for next year at 2.0%. Notably, they lowered their long-run view on the economy’s growth rate to 1.8% from 2%. In their forecasts, central bankers’ median projection for the jobless rate this year rose slightly to 4.8%, versus 4.7% in June. For 2017 officials see the jobless rate, now at 4.9%, coming in at 4.6%. The long run jobless rate is still seen at 4.8%. For this year they project the personal-consumption expenditures price index to come in at 1.3%, from June’s 1.4%, with 2017 inflation at 1.9%. Inflation will go back to desired 2% levels in 2018.

    92201
    Seems the Fed is still doesn’t understand that it’s always an unspent income story.

    Fed chief Yellen’s news conference after FOMC meeting

    By Andrea Ricci

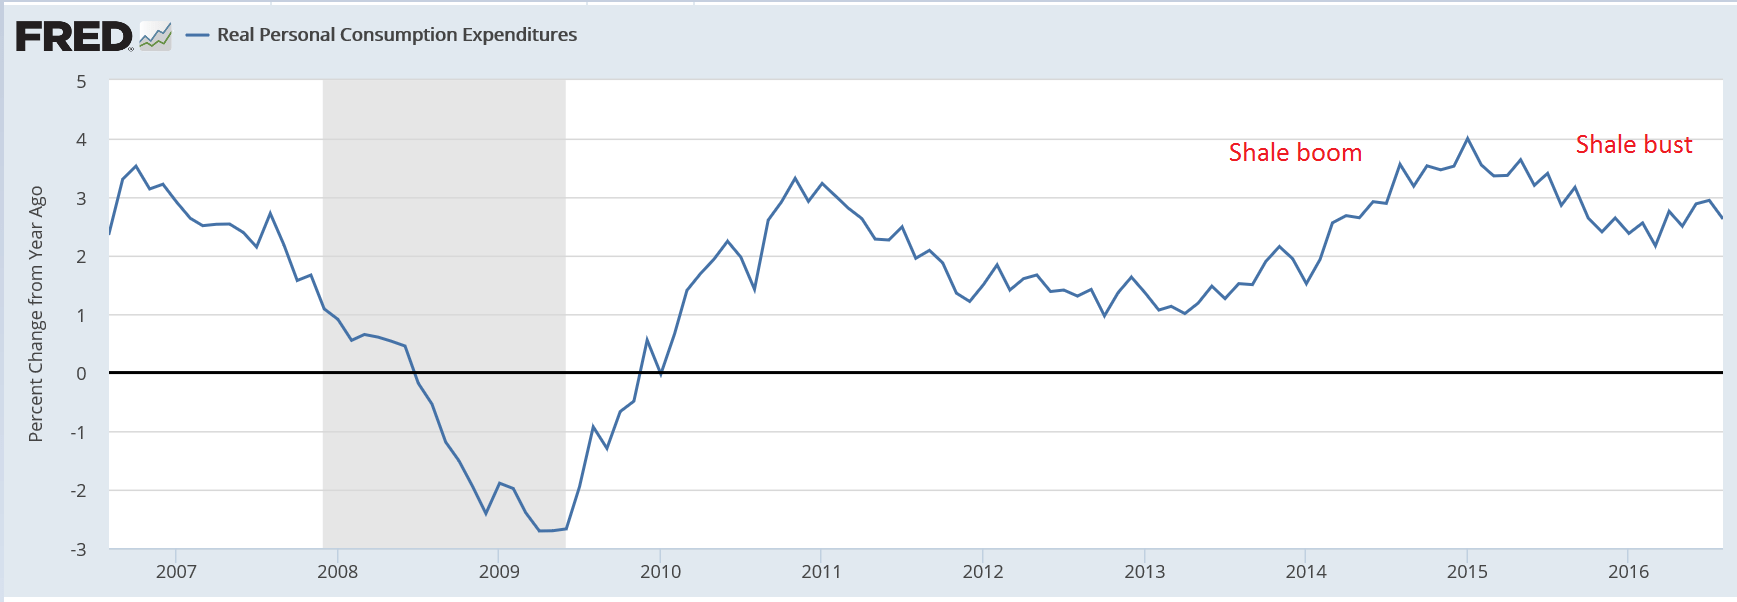
    Sept 21 (Reuters) — “Investment spending really has been quite weak for some time and we are really not certain exactly what is causing that. Part of it of course has been the huge contraction in drilling activity associated with falling oil prices, but the weakness in investment spending extends beyond that sector and I’m not certain of exactly what explains that … I’m not aware of evidence that suggests that it’s political uncertainty.” “Since monetary policy is only modestly accommodative, there appears little risk of falling behind the curve in the near future, and gradual increases in the federal funds rate will likely be sufficient to get to a neutral policy stance over the next few years.

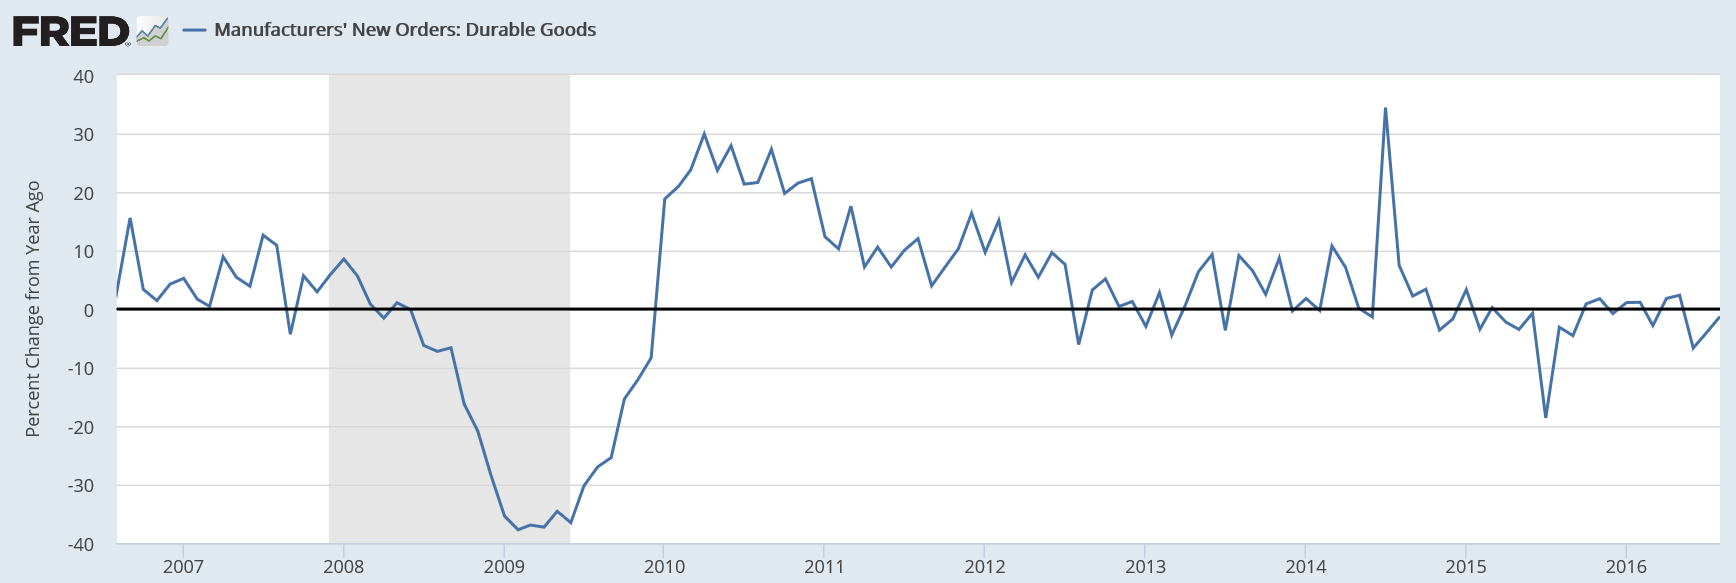
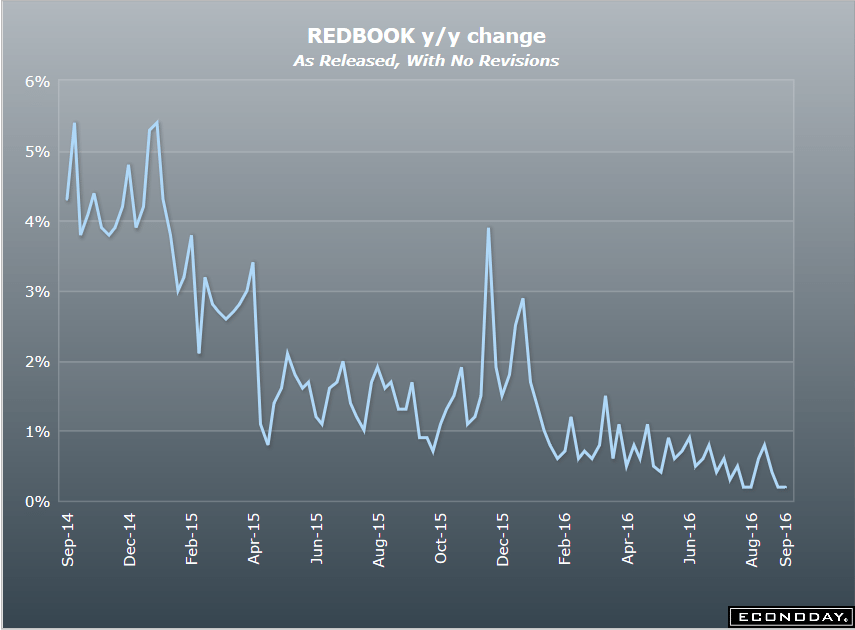
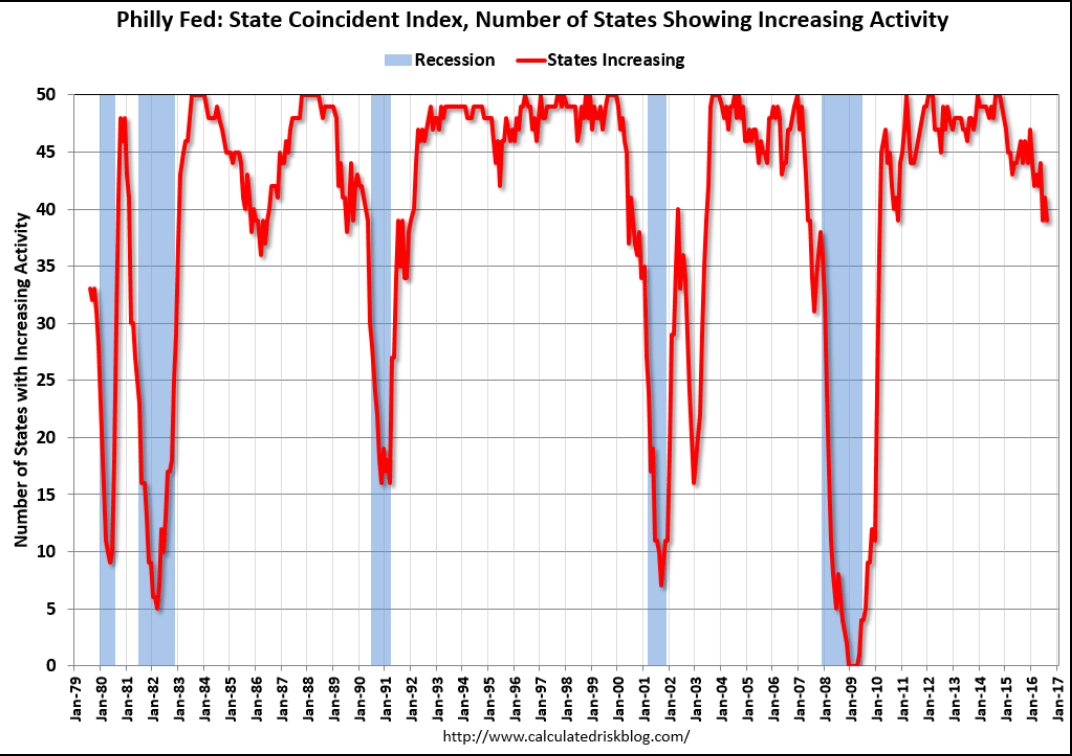
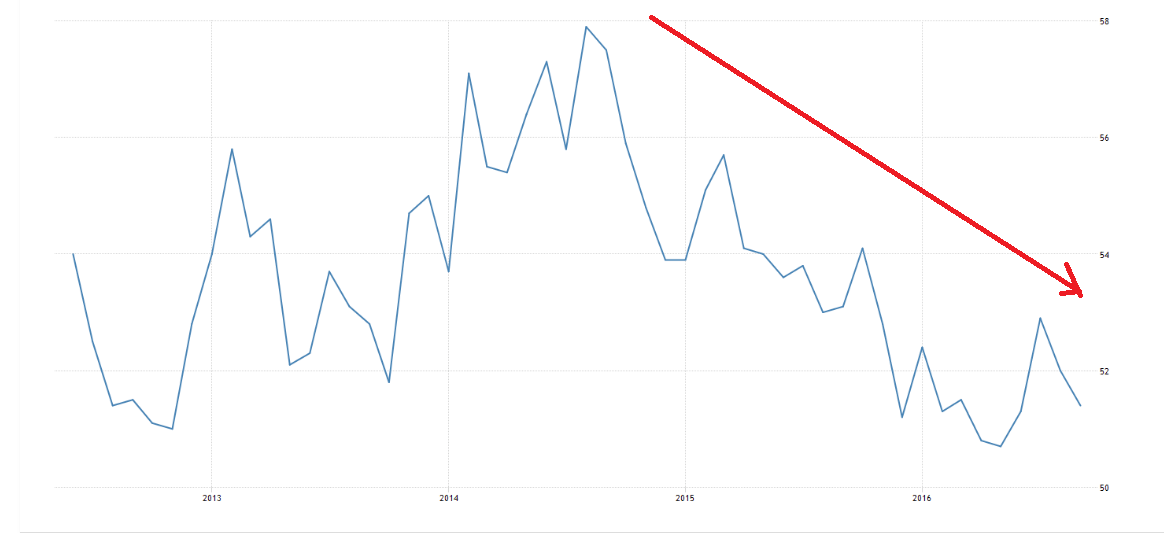
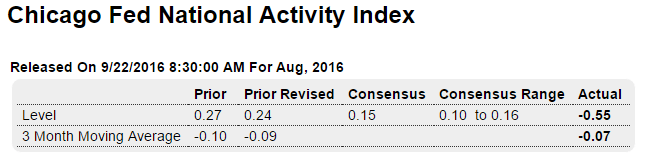
    3 month average remains in negative territory:

    92202

    Highlights

    August was a soft month for the bulk of the economy, a monthly dip that is now confirmed by the national activity index which fell to minus 0.55 from July’s revised plus 0.24. All four main components posted monthly declines and all four are in the negative column. Production-related indicators, after a brief pop higher into the plus column in July, pulled the index down 0.33 in the month. The decline here largely reflects broad weakness in the August production industrial report. Employment-related indicators came in at minus 0.09 followed by personal consumption & housing, at minus 0.08, and sales, orders & inventories at minus 0.05. What indications we have for September are limited but do include this morning’s dip in jobless claims which is a positive indication for the month’s employment component.

    Another disappointment for the hawks:

    92203

    Highlights

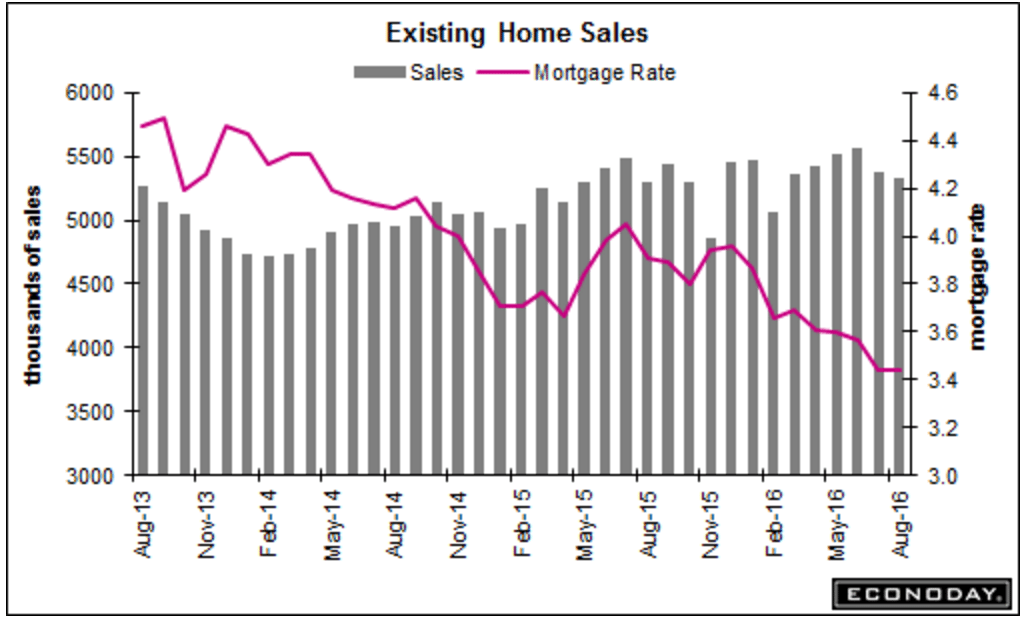
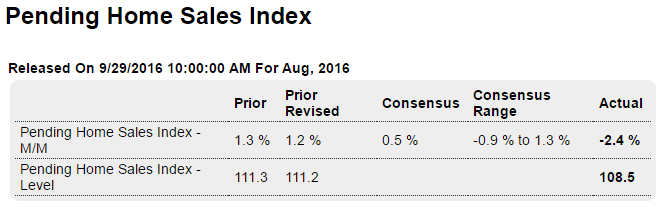
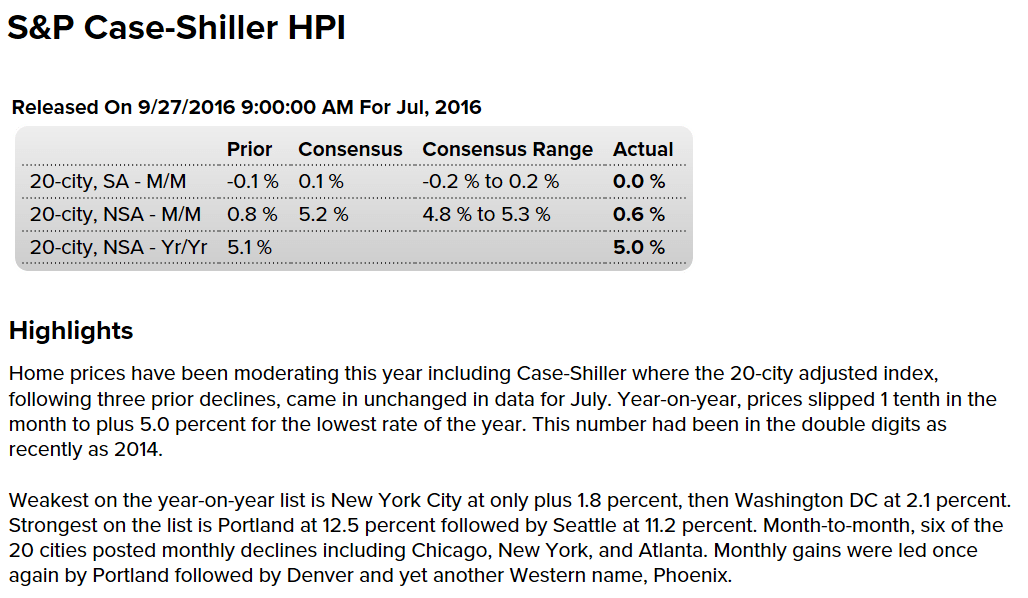
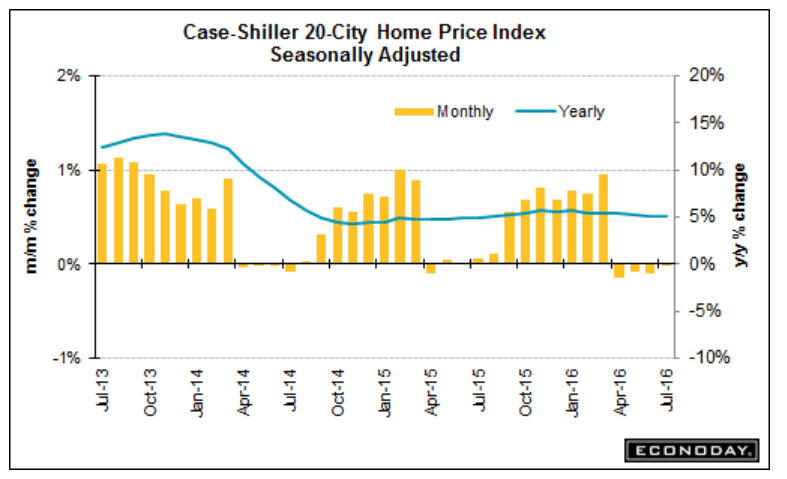
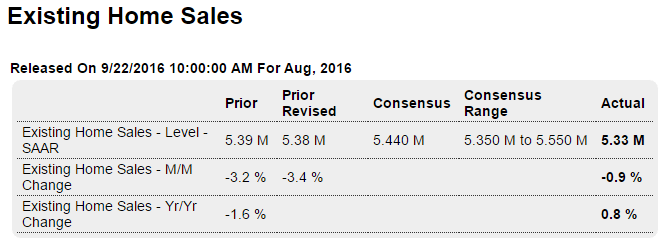
    Prices are soft and resales aren’t coming into the market. Existing home sales fell a monthly 0.9 percent in August to a 5.33 million annualized rate, roughly the same rate where it was a year ago at 5.29 million for a thin 0.8 percent gain. And the single-family component isn’t showing much life, down 2.3 percent in the month and up only 0.6 percent on the year. Saving the August report are condos which jumped 10.5 percent in the month to a 630,000 rate for a year-on-year gain of 1.6 percent.

    Supply is very thin and is holding down sales. Supply on a monthly basis is at 4.6 months with 3.3 percent fewer existing homes for sale, at 2.04 million from July’s 2.11 million. Prices aren’t offering great incentives for possible sellers, with the median down 1.3 percent in the month to $240,200 for a year-on-year rate of 5.1 percent which, however, is still respectable in a low wage growth economy.

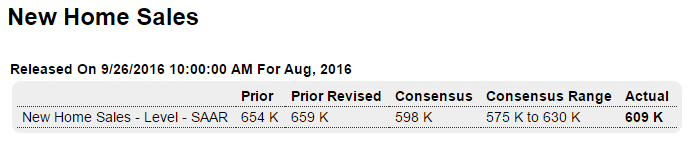
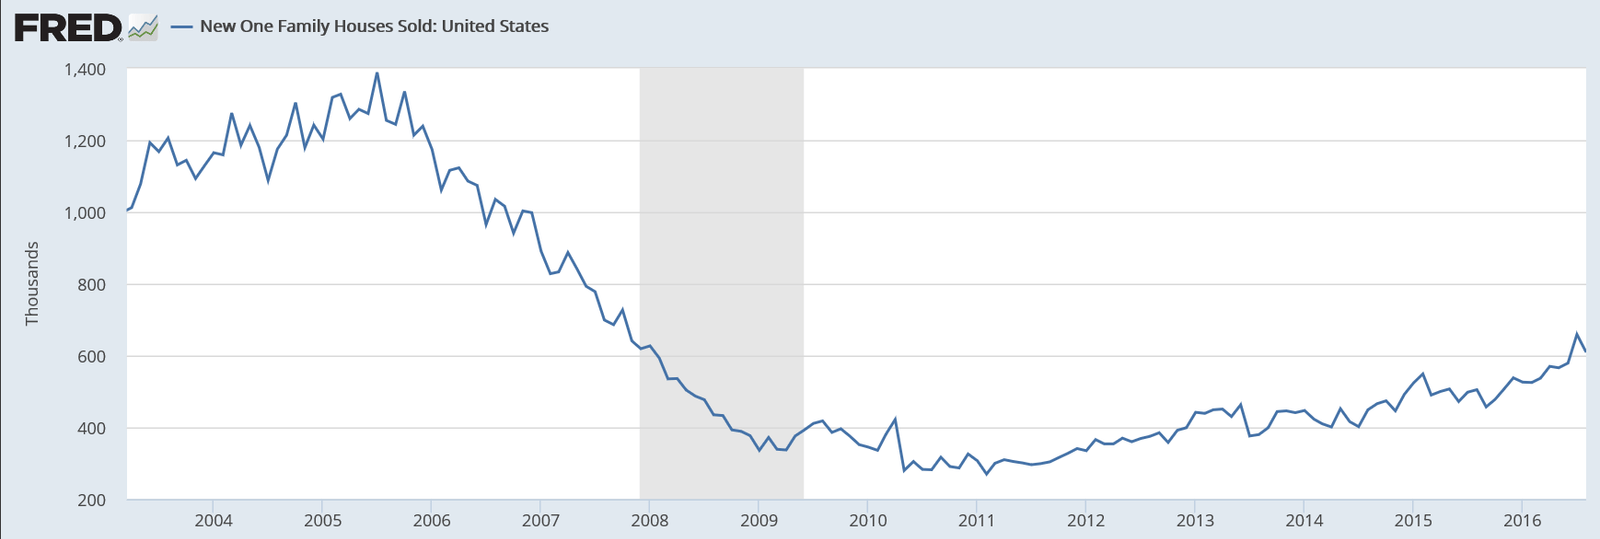
    There hasn’t been a lot of action this year in the resale market though the new home market is definitely showing life and, by itself, is likely to make housing a modest positive for the 2016 economy. In a final note, regional sales data are evenly balanced in today’s report, ranging from no year-on-year change for the Northeast to only a 0.9 percent gain for the South.

    92204