Credit check, Consumer credit, Wholesale sales, Rail traffic

From bad to much worse:

Highlights

Consumer credit rose a nearly as-expected $15.2 billion in February with January revised $2.1 billion higher to $10.9 billion. Revolving credit perked up with a $2.9 billion gain following January’s $2.6 billion decline. Nonrevolving credit, which includes vehicle financing and also student loans, rose $12.3 billion which is on the slow side for this reading. Credit growth isn’t robust but is steady and constructive for the economy.

Analyst Opinion of the Consumer Credit Situation

Not only does this data set suffer from backward revision (moderate to significant enough to change trends), but the use of compounding (projecting monthly change as annual change) by the Federal Reserve to determine consumer credit growth rates exaggerates the volatility in this data. The data in February was not significantly different than January’s – and consumer credit growth is around 6.4% year-over-year.

  • the default rate of consumer loans is now growing year-over-year,
  • that the amount of consumer credit outstanding relative to consumer expenditures is at all time highs,
  • Household Debt Payments As A Percent of Disposable Income is near all time lows.
  • Rail traffic seems to have bottomed and is now beginning to improve some from the lower levels:

    Rail Week Ending 01 April 2017: March Totals Up 5.5% Year-over-Year

    Week 13 of 2017 shows same week total rail traffic (from same week one year ago) improved according to the Association of American Railroads (AAR) traffic data. The data this year has big ups and downs but is now trending up.

    Employment report, Atlanta Fed GDP forecast

    Looking at the chart today’s number looks entirely consistent with the near linear rate of deceleration since oil capex collapsed about 2 1/2 years ago or so. And so far there’s no reason to expect the trend to reverse:

    Highlights

    Throw ADP out, it was the weather in March! Or at least the Category 3 storm that swept the Northeast may explain a much weaker-than-expected 98,000 increase in March nonfarm payrolls. This compares with Econoday’s consensus for 175,000 and a low estimate of 125,000. It is also the weakest reading since May last year.

    But there is one standout sign of strength in the report and that’s the unemployment rate which fell a very sharp 2 tenths to 4.5 percent as the number of unemployed fell by 326,000 to 7.2 million. This is the lowest unemployment rate since the height of the last expansion in April 2007 and it raises the issue of wage inflation which, however, has yet to build. Average hourly earnings rose only 0.2 percent in the month for a year-on-year rate that, at 2.7 percent, is down 1 tenth in the month and further away from the 3 percent line.

    Lack of highly skilled entrants is one likely reason for the lack of wage traction but soft economic conditions may also be a factor. The average workweek slipped in the month to 34.3 hours from 34.4 hours with manufacturing declining to 40.6 hours from 40.8. For manufacturing production, this points to an abrupt and unexpected interruption and one perhaps consistent with heavy weather.

    Retail trade fell 30,000 in March following February’s 31,000 decline. Trade & transportation payrolls decreased 27,000 following a 16,000 decline. But both manufacturing and mining show useful gains, at 11,000 each and with construction, despite the weather, still rising 6,000. The government hiring freeze put in place in late January didn’t hurt March payrolls for this reading which rose 9,000.

    The big storm hit during the sample week of the employment report and apparently delayed new hiring, or at least that will be today’s takeaway. Though there may be a snapback ahead for April payrolls and despite the drop in the number of unemployed, the report does tone down the economic outlook and hints at March trouble for consumer spending which had already opened the year off softly.

    Not looking good/who would’ve thought?
    ;)

    Saudi pricing, Euro fx rate, Tooth fairy index, NY Times Trump interview

    Looks like Saudis are moving to lower prices?

    Saudi Aramco Said to Cut Pricing For May Arab Light Oil to Asia

    By Serene Cheong and Sharon Cho

    Apr 5 (Bloomberg) — Saudi Aramco sets Arab Light crude differential at 45c/bbl discount to Oman-Dubai benchmark for May sales to Asia, say people with knowledge of matter who asked not to be identified because the information is confidential.

  • That’s a 30c/bbl decrease from April OSP
  • NOTE: Co. was expected to decrease Arab Light differential by 35c/bbl for May sales to Asia, according to Bloomberg News survey Link
  • May Arab Super Light price cut by 20c to $3.75/bbl premium
  • May Arab Extra Light price reduced by 35c to 60c/bbl premium
  • May Arab Medium price unchanged at 85c/bbl discount
  • May Arab Heavy price unchanged at $2.60/bbl discount
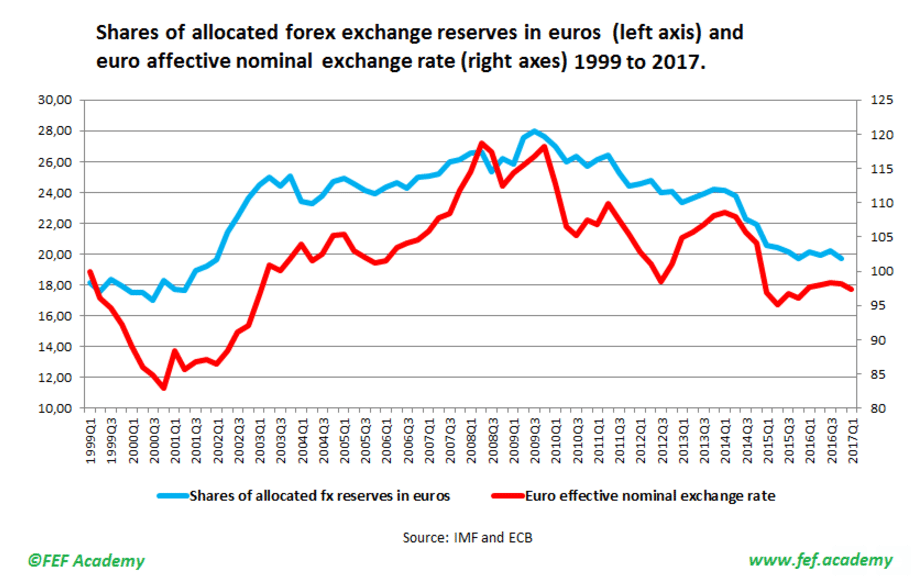
  • An indication that the fx value of the euro has been a function of foreign government buying and selling:

    Partial Transcript: Trump’s Interview With The Times

    WASHINGTON — The following is a partial transcript of President Trump’s interview with The New York Times’s Maggie Haberman and Glenn Thrush. It has been lightly edited for content and clarity, and omits several off-the-record comments and asides.

    At least six White House aides were sitting in: Gary D. Cohn, President Trump’s lead economic adviser and a former president of Goldman Sachs; Reed Cordish, an assistant to the president; Sean Spicer, the press secretary; Hope Hicks, a long-serving Trump aide; and eventually Vice President Mike Pence and the chief of staff, Reince Priebus.

    MAGGIE HABERMAN, White House correspondent: Seems like it’s actually not been a terrible process for [Judge Neil M.] Gorsuch, right? I mean, it’s been pretty smooth.

    PRESIDENT TRUMP: It’s never an easy process. I think it’s been very smooth considering there’s tremendous hostility on the other side. I think it’s been pretty smooth.

    HABERMAN: You talk to Democrats privately that will admit —

    TRUMP: I do.

    HABERMAN: But do they admit to you that they don’t actually have a huge objection to Gorsuch, they think that he’s probably —

    Continue reading the main story
    TRUMP: They do. They admit that.

    HABERMAN: Right. In private.

    TRUMP: Elijah Cummings [a Democratic representative from Maryland] was in my office and he said, “You will go down as one of the great presidents in the history of our country.”

    HABERMAN: Really.

    TRUMP: And then he went out and I watched him on television yesterday and I said, “Was that the same man?”

    [Laughter.]

    TRUMP: But I said, and I liked him, but I said that was really nice. He said, in a group of people, “You will go down as one of the great presidents in the history of our country.” And then I watched him on television and I said, “Is that the same man that said that to me?”

    GLENN THRUSH, White House correspondent: Why do you think Democrats feel the need to oppose Gorsuch? What do you think the politics is?

    TRUMP: Well, I think that some of it had to do with the election. They thought they were going to win. You know, winning the Electoral College is, for a Republican, is close to impossible and I won it quite easily. And I think they are still recovering from that, but they are recovering now. I think the Susan Rice thing is a massive story. I think it’s a massive, massive story. All over the world, I mean other than The New York Times.

    HABERMAN: We’ve written about it twice.

    TRUMP: Huh?

    HABERMAN: We’ve written about it twice.

    TRUMP: Yeah, it’s a bigger story than you know. I think —

    HABERMAN: You mean there’s more information that we’re not aware of?

    TRUMP: I think that it’s going to be the biggest story.

    THRUSH: Why? What do you think —

    TRUMP: Take a look at what’s happening. I mean, first of all her performance was horrible yesterday on television even though she was interviewed by Hillary Clinton’s P.R. person, Andrea Mitchell [the NBC News journalist]. Course you’ve been accused of that also.

    HABERMAN: Mostly by you, though.

    TRUMP: No, no, no. Mostly by a lot of people. So you know, we’ll see what happens, but it looks like it’s breaking into a massive story.

    THRUSH: What do you think are — what other shoes are there to drop on this?

    HABERMAN: Yeah, what else could we learn on this?

    TRUMP: I think you’re going to see a lot. I think you’ll see a lot.

    HABERMAN: In terms of what she did and in terms of [unintelligible]?

    TRUMP: I think in terms of what other people have done also.

    HABERMAN: Really?

    TRUMP: I think it’s one of the biggest stories. The Russia story is a total hoax. There has been absolutely nothing coming out of that. But what, you know, what various things led into it was the story that we’re talking about, the Susan Rice. What’s happened is terrible. I’ve never seen people so indignant, including many Democrats who are friends of mine. I’ve never seen them acting this way. Because that’s really an affront on them, you know, they are talking about civil liberties. It’s such an affront, what took place.

    THRUSH: What other people do you think will get ensnared in this? Can you give us a sense? How far this might extend —

    HABERMAN: From the previous administration.

    TRUMP: I think from the previous administration.

    THRUSH: How far up do you think this goes? Chief of staff?

    TRUMP: I don’t want to say, but —

    THRUSH: President?

    TRUMP: I don’t want to say, but you know who. You know what was going on. You probably know better than anybody. I mean, I frankly think The Times is missing a big thing by not writing it because you’re missing out on the biggest story there is.

    [Mr. Trump makes a comment off the record, and mentions the Fox News host Bill O’Reilly.]

    THRUSH: We’re back on the record?

    HABERMAN: Yeah, back on the record, do you think that he’s being unfairly treated? I mean, I watched it because I was curious how he was dealing with everything.

    TRUMP: I think he’s a person I know well. He’s a good person. I think he may, you know, I think he shouldn’t have settled, personally, I think he shouldn’t have settled.

    HABERMAN: How come?

    TRUMP: Because you — should have taken it all the way. No, I know Bill. Bill’s a good person.

    HABERMAN: Yeah.

    TRUMP: I don’t think Bill would do anything wrong.

    HOPE HICKS, White House director of strategic communications: Can we get to infrastructure? [Laughter.] Because I know we are sensitive about time.

    HABERMAN: I understand. I just want to ask one last follow-up on that note, and then we’ll move on, not on O’Reilly.

    TRUMP: You certainly covered O’Reilly big. Not Susan Rice, boy, O’Reilly [unintelligible]. He’s taking my place. He’s taking my place.

    HABERMAN: Sir, if you could give us more information about Rice. If the administration would give us more information —

    TRUMP: No, you have a lot of information. No, you have so much information.

    HABERMAN: If you would have given it to us last week, we would have written it. Would you declassify some of the information so that —

    TRUMP: I don’t want to talk about that.

    HABERMAN: No? O.K.

    TRUMP: No. I just don’t want to talk about that. It’s such an important story for our country, for the world. What took place.

    HABERMAN: Why not talk about it then? With all due respect.

    TRUMP: At the right time, I will be.

    THRUSH: One last thing on that. Have you actually seen intelligence that leads you to believe that people other than Susan Rice are involved.

    TRUMP: I don’t want to comment on anything about — other than to say I think it’s a — I think it’s truly one of the big stories of our time.

    THRUSH: Do you think she might have committed a crime?

    TRUMP: Do I think?

    THRUSH: Yeah.

    TRUMP: Yes, I think.

    HABERMAN: On infrastructure, just generally speaking, there’s been a lot of reports floating around about this package that you’re looking at. Can you give us the broad outlooks?

    TRUMP: We want to do a great infrastructure plan, and on that side I will say that we’re going to have, I believe, tremendous Democrat support. We are also going to have some good Republican support, and I think it’s going to be one of the very bipartisan bills and it’s going to happen. I may put it in with health care.

    FROM CUMMINGS:

    “During my meeting with the president and on several occasions since then, I have said repeatedly that he could be a great president if … if … he takes steps to truly represent all Americans rather than continuing on the divisive and harmful path he is currently on,” Cummings said in a statement Thursday.

    At that same meeting, Cummings said that he confronted Trump about his unfounded claims of massive voter fraud and the offensive way in which he characterized the black community during his campaign.

    “When we hear those words about carnage and we are living in depressed situations, I told him it was very hurtful,” Cummings said last month.

    ADP employment, PMI services, ISM services

    Higher than expected but last month was revised down by 53,000 (and same could happen of course for this month). And this is just a forecast for the Friday jobs report, not a hard number. Also note that as per the chart the annual growth rate has been declining and it’s too soon to say that the decline has reversed:

    Highlights

    The March employment report may not prove as impressive as February or January but it still looks to be very strong, based on ADP’s 263,000 estimate for private payrolls. The consensus before ADP’s result was calling for a 170,000 rise in March private payrolls which would follow gains of 227,000 and 221,000 in the two prior months. Details in the ADP report include a strong 49,000 gain for construction and a 30,000 increase for manufacturing. Professional & business services are another strong positive, up 57,000. This report will ease concern that heavy weather in the mid-month sample week for March may skew Friday’s report lower.


    Trumped up expectations keep coming off:

    Highlights

    Markit Economics’ U.S. manufacturing sample has reported a loss of momentum as is its U.S. service sample. The services PMI slowed to 52.8 in March, down 1 tenth from the mid-month flash and down a full point from February. This is the lowest rate of plus-50 growth in six months. New orders are at their slowest growth rate in a full year and service providers were keeping busy working down backlogs which are at a 9-month low. Employment growth is at a 5-month low. Despite the slowing in activity, wages and input costs are on the rise as are selling prices though only modestly.

    This report points to a quarter-end fizzle for the bulk of the economy. Watch for ISM non-manufacturing later this morning at 10:00 a.m. ET, a report that, in sharp contrast to this report, has been running at a very solid clip.

    Highlights

    Slowing in employment is a warning signal in the March ISM non-manufacturing report where the headline composite slowed to a 5-month low of 55.2. Employment growth slowed abruptly in the month, down 3.6 points to 51.6 and a 7-month low. This contrasts sharply with ADP’s very strong report earlier this morning and underlines concern that March’s heavy weather may have held down the labor market.

    New orders also slowed in the month, down 2.3 points to what however is still a very strong 58.9. New export orders are the standout positive in the report, up 5.5 points to 62.5 which is the first 60 score in 4 years and the best result since May 2007. Backlog orders also slowed but again not by much, down 1 point at 53.0 which remains constructive for this reading. Business activity also slowed and inventories, in another indication of slowing, were drawn down. Supplier deliveries also slowed but only slightly yet still could be a hint of weather effects.

    The big gain for export orders is a reminder that foreign demand for U.S. services is very strong in what is a major contrast with soft demand for U.S. goods. But the overall slowing centered in employment makes this report an unwelcome signal of weakness going into Friday’s jobs data.

    Trade, Manufacturing new orders, Redbook retail sales, GDP forecasts

    The trade deficit was a bit less than expected, all due to lower imports. The question is whether this means there were more domestic purchases, whether this is an indicator of lower aggregate demand:

    Highlights
    In favorable news for first-quarter GDP, the nation’s trade gap hit Econoday’s low estimate in February at $43.6 billion and reflects a 1.8 percent drop in imports but only a 0.2 percent gain for exports. The goods deficit came in at $65.0 billion vs $64.8 billion in last week’s advance report for February with the services surplus at $21.4 billion which is unchanged from January (there’s no advance report for services).

    It has been strong demand for foreign consumer goods and foreign autos that has been a central factor behind the nation’s trade deficits, and the news in February, at least in terms of the deficit, is positive. Imports of consumer goods fell to $49.0 billion which is down a very sizable $3.1 billion from January. Imports of autos fell to $29.1 billion for a $2.7 billion decline. Offsets include a $1.3 billion rise in crude oil imports to $13.0 billion reflecting a sharp monthly increase of $1.31 per barrel to $45.25 along with a slight rise in volumes per day.

    The export side, despite the fractional gain, is less constructive. Exports of capital goods extended their flat-to-lower trend, down $0.6 billion in the month to $42.9 billion and due entirely to civilian aircraft. Exports of foods fell $0.7 billion with nonmonetary gold down $0.4 billion. A positive is a $0.7 billion upturn in exports of consumer goods to $17.1 billion. Less positive, however, is a flat month for services where exports were unchanged at $64.4 billion with the surplus relative to $43.0 billion in service imports once again flat at $21.4 billion. Services have been the strength of the U.S. trade picture.

    Country data show the trade deficit with China at $23 billion in the month followed by the EU at $9.4 billion, Mexico at $5.8 billion, Japan at $4.7 billion and Canada at $2.1 billion. Note that country data are unadjusted which makes monthly comparisons difficult especially given February’s 28 days vs January’s 31 days.

    For GDP these data are very positive and help offset not only January’s large trade deficit but also what’s evolving as a weak quarter for domestic consumer spending. For cross-border trade, this report is not upbeat, showing less demand for goods and services both here and abroad.

    Manufacturing continues to drift sideways, as per the chart. And note that vehicle sales have softened considerably since this report and aircraft orders are likely to revert:

    Highlights

    Factory orders may not be showing the same kind of strength that the ISM and Philly Fed are pointing to but they are solid, hitting Econoday’s February consensus at a 1.0 percent gain. Adding to the strength is a 3-tenth upward revision to January which is now at a 1.5 percent gain that follows December’s unrevised 1.3 percent rise.

    The durables side of the report, up 1.8 percent in the month (revised from 1.7 percent in last week’s advance data), reflects a second month of outsized strength for aircraft, at a 56 percent monthly gain vs January’s 188 percent surge. But durables also include a respectable 0.3 percent gain for vehicles. Nondurable goods inched 0.2 percent higher on strength in chemicals (there is no advance report for nondurables).

    But there are cracks that perhaps betray the strength and one is a second weak month for core capital goods (nondefense ex-aircraft) where orders fell 0.1 percent after managing only a 0.2 percent gain in January. Yet given strength of prior orders, shipments of core capital goods — which are an input into first-quarter GDP — rose a very solid 1.0 percent to help offset January’s disappointing 0.4 percent decline. This is an important positive for first-quarter GDP which had been slipping.

    Turning back to weaknesses, total unfilled orders were unchanged in February to extend a nearly yearlong streak of disappointment. Lack of unfilled orders will not spark demand for factory hiring. Inventories rose 0.2 percent in line with a 0.3 percent rise in total shipments to keep the inventory-to-shipments ratio unchanged at 1.31.

    Another question in this report is the two months of reliance on aircraft orders where strength cannot be expected to extend indefinitely, to say the least for this volatile component. And this morning’s trade report poses further questions especially for capital goods exports which have been stubbornly flat. Still, on a total basis, factory orders are showing the directional lift that advance anecdotal reports have been signaling with rare strength.

    Note how the charts show we’ve yet to recover to 2008 levels, and these numbers are not adjusted for inflation:


    This measure of retail sales growth collapsed when oil capex collapsed and remains depressed:


    Note how the other forecasts have been working their way down towards the Atlanta Fed’s forecast:

    Vehicle sales, Construction spending, PMI, ISM

    Big drop, and in line with collapsing bank loan reports:

    Highlights

    First-quarter GDP will take another hit, this time from March vehicle sales which like February and January proved weak. But the March data is unusually weak, down 5.7 in the month to a 16.6 million annualized rate that is a 2-year low. Sales of North American-made and imports both suffered, at 13.3 and 3.4 million rates, with light trucks and autos both down. Vehicle sales seem to have been pulled forward into December which was an unusually strong month and which helped the fourth quarter at the expense of the first quarter.


    Worse than expected though last month not as bad as reported, and the already low annual growth numbers continue to weaken, as per the chart:

    Highlights
    Construction spending rose a very solid 0.8 percent in February and was led by residential construction where spending on single-family homes rose 1.2 percent for a second straight month and multi-family spending rose 2.0 percent following January’s 4.0 percent surge.

    Nonresidential construction is holding back the total, down 0.3 percent in the month and reflecting weakness in the transportation, commercial, and manufacturing components. Federal spending was also down for a second straight month, 2.8 percent lower following a 5.6 percent drop in January.

    Year-on-year rates show the negative pull from government spending which was down 8.8 percent at the Federal level and down 8.0 percent at the state & local level. Total yearly spending is up a modest 3.0 percent with single-family homes up 3.4 percent and multi-family units, reflecting the high cost of housing and demand for rentals, again leading the way up 10.6 percent.

    The construction sector hasn’t been on fire but continues to post passable numbers, and momentum may begin to build at least for the housing sector as permits for both single- and multi-family units are on the climb.


    Markit purchasing managers index survey shows trumped up expectations continue to fade:


    ISM survey coming off a bit as well:

    Credit check

    Yikes! Check out that 2nd derivative!
    ;)

    Sure looks like something bad happened early in q416 to an economy already decelerating since oil capex collapsed just over a couple of years ago.

    Seems to me the only thing preventing a stock market collapse is a stock market collapse…
    ;)

    Personal income and spending, Consumer sentiment, Atlanta Fed

    Trumped up expectations are fading a bit while ‘hard data’ continues to fade. And note the real disposable personal income chart which continues its deceleration that began when oil capex collapsed:

    Highlights

    A second month of weak spending on services pulled down on consumer spending which could only manage a 0.1 percent rise in February, one that follows a nearly as weak 0.2 percent gain in January. February’s result is below consensus and at the low end of the Econoday forecast range.

    Income data are more favorable headlined by an as-expected 0.4 percent gain and a very solid 0.5 percent increase in the wages & salaries component. And consumers moved money into the bank as the savings rate climbed 2 tenths for a second straight month to 5.6 percent. Increases in savings are a factor behind the weakness in spending.

    Inflation data are mixed as monthly rates are tame but year-on-year rates, reflecting low prices this time last year, are moving higher. For the first time in nearly 5 years, the PCE price index is over the Federal Reserve’s 2 percent target, up an expected 2 tenths to 2.1 percent. The monthly rate, however, rose only 0.1 percent which if extended into future months would point to easing pressure for the year-on-year as last year’s comparisons become harder.

    The PCE core rose a tame looking 0.2 percent on a monthly basis but here the year-on-year rate is 1 tenth higher at 1.8 percent which is also 1 tenth above Econoday’s consensus. And the rate for January is now revised 1 tenth higher and is also now at 1.8 percent.

    The pressure on the core rate is very delicate for the Federal Reserve which does not expect this reading to accelerate, only stabilize quietly just under or just at the 2 percent line. The gain in income in this report hints at wages perhaps adding to inflationary pressures, a possibility that will be tested in the average hourly earnings reading in next week’s employment report.

    Along with the risk of less-than-tame inflation is the risk of a less-than-excited consumer who, after a vehicle-buying spree in the fourth quarter, may be cutting back and putting money into the bank. This may be good for consumer health and the long-term outlook, but it won’t help first-quarter GDP which, after today’s report, now looks to be decidedly soft.


    The chart hasn’t yet been updated for this latest forecast:

    Border tax comments, Redbook retail sales, International trade, Consumer confidence

    So they used to tell the story about a guy who claimed he could make cars out of wood, and he started a company in Oregon that brought trees into one door of his giant building with new cars coming out of another door, and he wouldn’t let anyone inside to see how it was done. He was given a award for innovation and widely acclaimed, until one day someone got inside and saw he was shipping the trees out the back to Japan and bringing in new Korean cars. He was then arrested and jailed, etc. etc.

    Point is, for the macro economy it didn’t make any immediate difference what was going on behind those closed doors, and that for purposes of understanding one can think of a nation’s foreign trade as similar to a company that takes in all that it can export and delivers back whatever is imported.

    This model also promotes the understanding of how, in real terms, exports are the costs of imports, and optimizing real terms of trade is about getting the most cars for the fewest trees, which is likewise what first-pass productivity is all about for the domestic economy.

    What about the jobs lost due to increased productivity? Well, history shows it used to take 99% of the workforce to grow the food we need to eat to live, and today in the US it takes maybe 1% of the workforce to grow enough food to eat with a lot left over to export. Yet unemployment isn’t necessarily any higher today than it was back then. Why? Because there’s always a lot more we think needs to get done than there are people allowed to do it, and unemployment comes from a lack of funding, and not a lack of things to day. Today the service sector dominates, and more so every day, with no lack of services we’d like to have done as far as the eye can see. And unemployment, as currently defined, is necessarily the evidence that for a given level of govt. expenditure the economy is that much over taxed, as a simple point of logic. Not that policy makers understand that, of course…

    Now let’s add a border tax to the model, for the purpose of creating jobs, not withstanding how that premise is categorically ridiculous, as per the prior discussion. But, to quote Don Rumsfeld, ‘We’ve got to fight with the army we’ve got.’ Anyway, a border tax would put a tax on importing the cars to attempt to keep us from buying them so we would have more jobs building cars domestically, and reduce the tax on exporting the trees so we would have more jobs cutting down and shipping out trees.

    Let’s assume that that’s what happened and then look at the consequences. First, we would be shipping out more trees and getting fewer cars. This makes the nation as a whole worse off due to those reduced real terms of trade. The next step is to identify the winners and losers, recognizing the losses to our standard of living are higher than the gains. Best case: we put more people to work growing more trees so we have just as many trees for ourselves, and we’d put more people to work building cars so we’d have just is many cars as before. So what we accomplished is that we are working more to be left with the same amount for ourselves.

    That’s called a drop in productivity, and a decline in our standard of living, since work is an input and a real cost of production. Work itself is not an economic benefit. The economic benefits of work is the output produced. And the whole point of producing output is consumption of some type, either for immediate use or for future use. That is, it makes no economic sense to work and produce output for the purpose of immediately throwing it away.

    So with the above ‘best case’ assumptions, the border tax does work to create jobs, and unemployment is a political problem, which is why the border tax has that element of political appeal. Not that it matters, but my first choice for job creation would be a fiscal adjustment, either a tax cut or spending increase, large enough to promote sufficient spending to increase sales, output, and employment, in order to produce that additional output. That way we have that much more domestic output to consume plus all the imported cars we were buying before the border tax, and we don’t have to give away the extra trees due to the border tax proposal.

    And how does it look from the government’s point of view?
    First, the government expects extra revenue from the tax on the imported cars, net of the revenue lost from tax benefits for exporters. This means less spending power for consumers paying the tax, presumably offset by new tax cuts, making it all revenue neutral, which – through some presumed channels – is theorized to have its own positive consequences.

    So in this ‘best case’ scenario Americans work more and get less, while consumer taxes go up while other taxes go down. Once thought through, that whole topic hardly seems worth a second look?

    But that is only the economic best case scenario. All kinds of other things can happen, with the same model used for purposes of analysis.

    More later…

    This used to run between 3% and 4% before the collapse In oil capex:


    A bit ‘better’ than expected, to use mainstream values, and note the details in the narrative are not so ‘good’:


    Seriously trumped up consumer expectations continue:

    Credit check, Vehicle sales forecast

    Hard to say the credit collapse is over. And as the causation is “bank loans create bank deposits” that component of the ‘money supply’ is decelerating as well:


    The seasonally adjusted rate of sales continues to work it’s way lower:

    From WardsAuto: Forecast: U.S. March Sales to Reach 17-Year High

    A WardsAuto forecast calls for U.S. automakers to deliver 1.61 million light vehicles in March, a 17-year high for the month. The forecasted daily sales rate of 59,776 over 27 days is a best-ever March result. This DSR represents a 2.6% improvement from like-2016 (also 27 days). March is anticipated to be the first month in 2017 to outpace prior-year.

    The report puts the seasonally adjusted annual rate of sales for the month at 17.2 million units, below the 17.4 million SAAR from the first two months of 2017 combined, but well above the 16.6 million from same-month year-ago. …

    Read more at http://www.calculatedriskblog.com/#W3XOqH34aT2gHx1y.99

    And just so happens oil capex collapsed towards the end of 2015, about when vehicle sales flattened. This chart is through Feb. The forecasted 17.2 million sales for March are down from Feb’s 17.4 million: