Fed surveys, Industrial production, Housing market index, Fed’s gdp forecasts

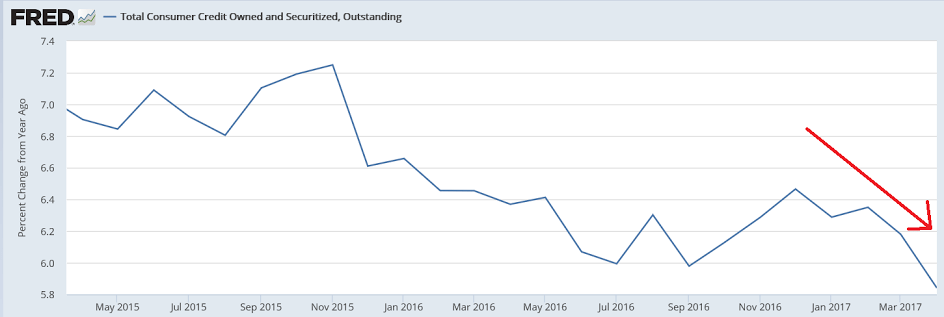
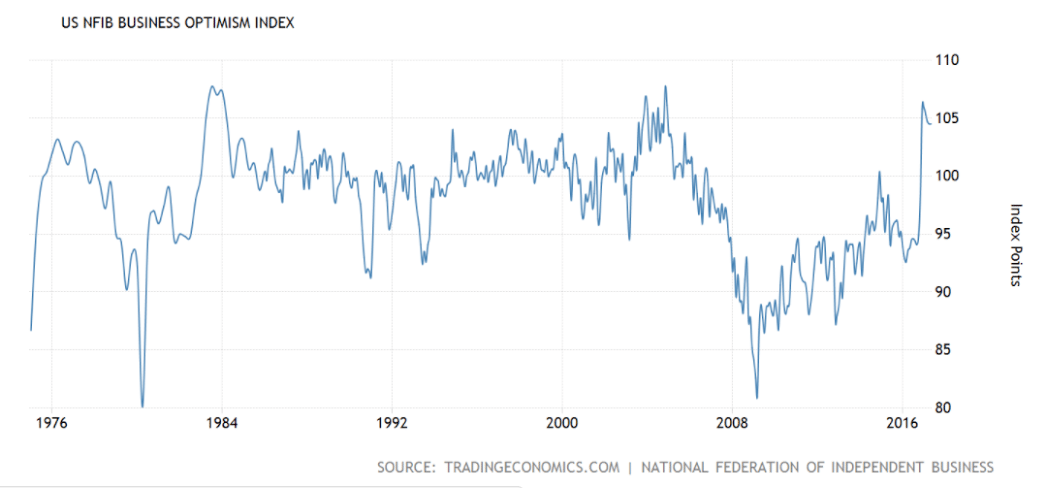
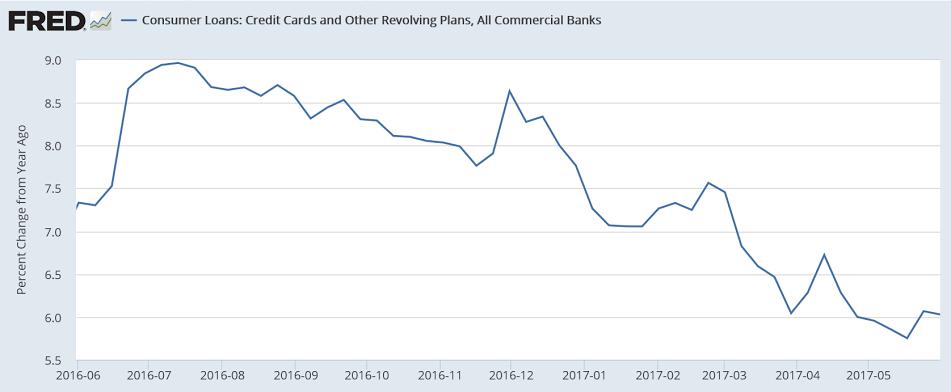
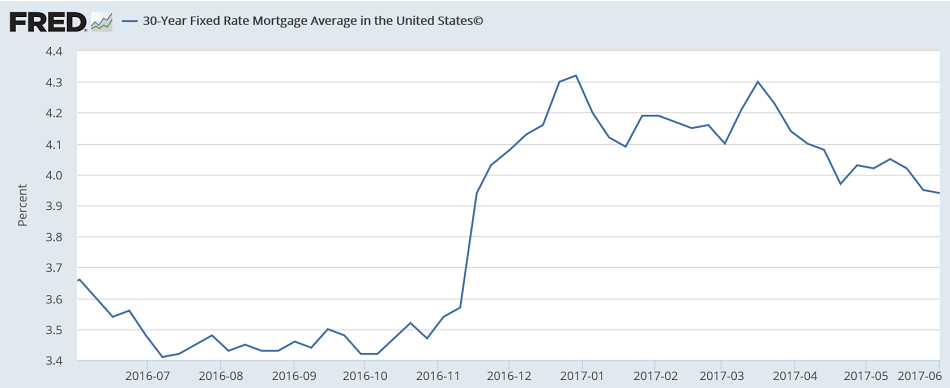
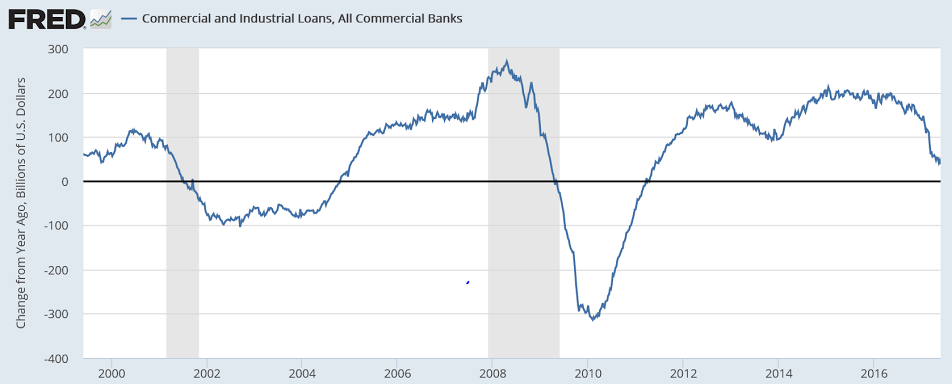
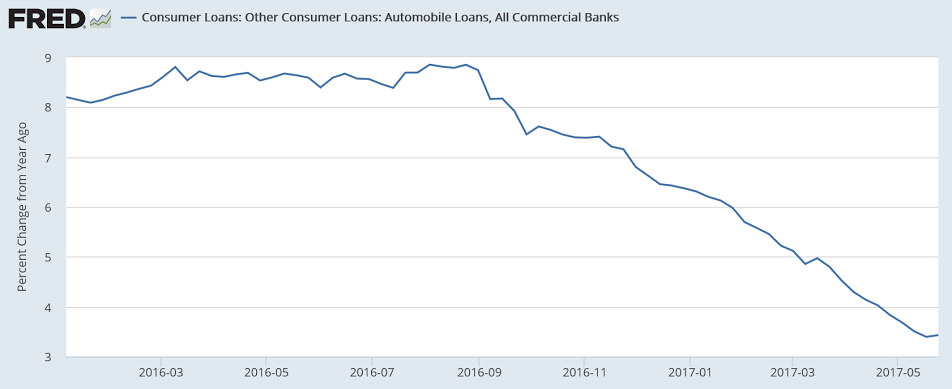
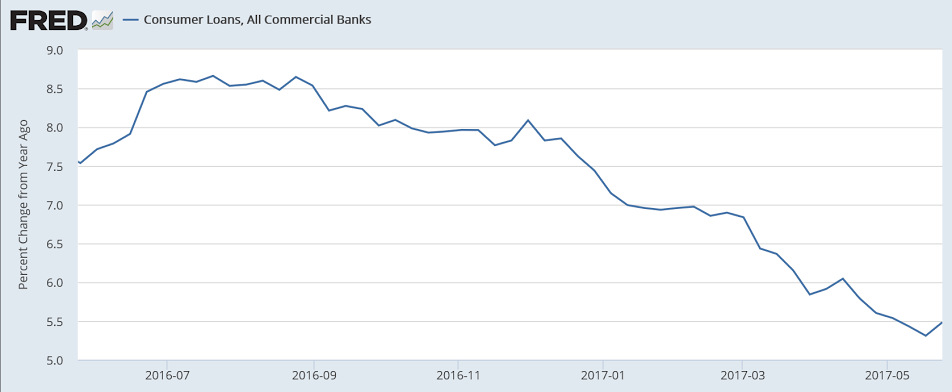
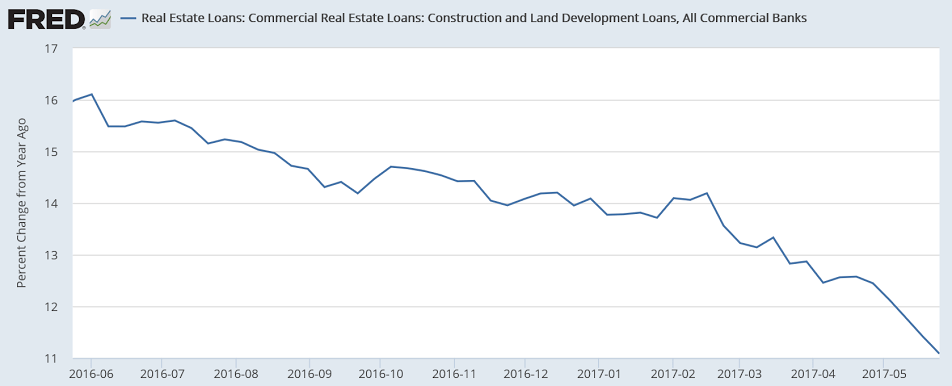
These spiked up with the Presidential election and are only slowly coming back down:


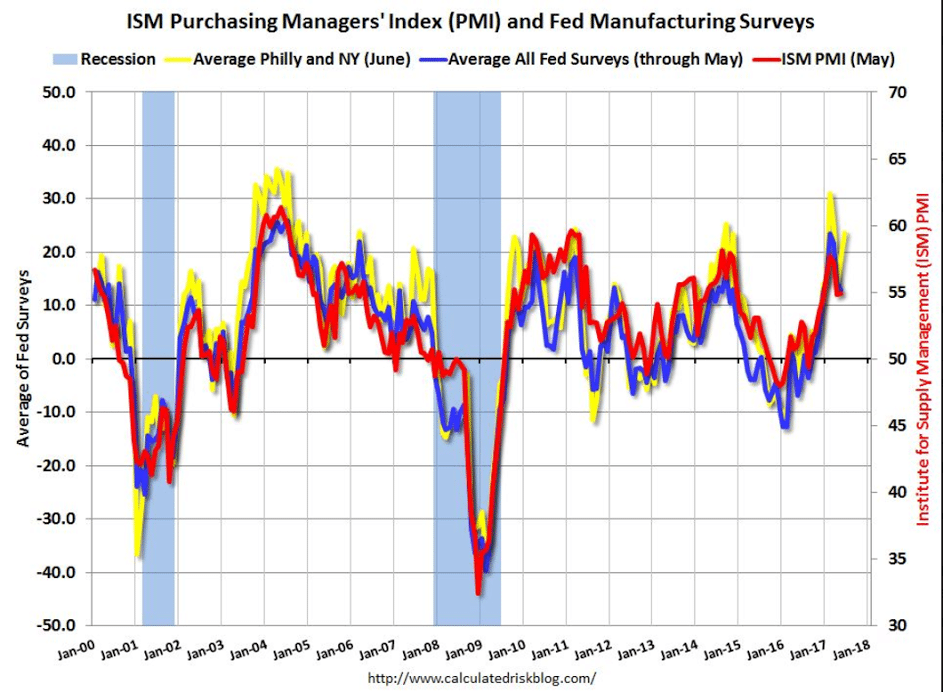
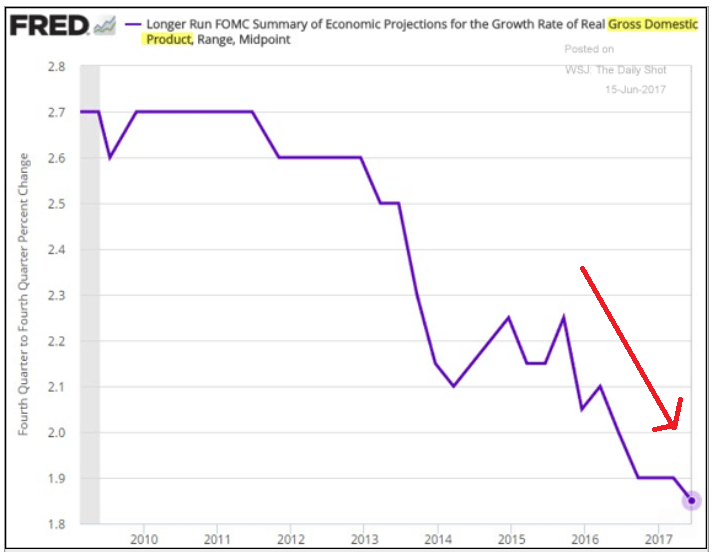
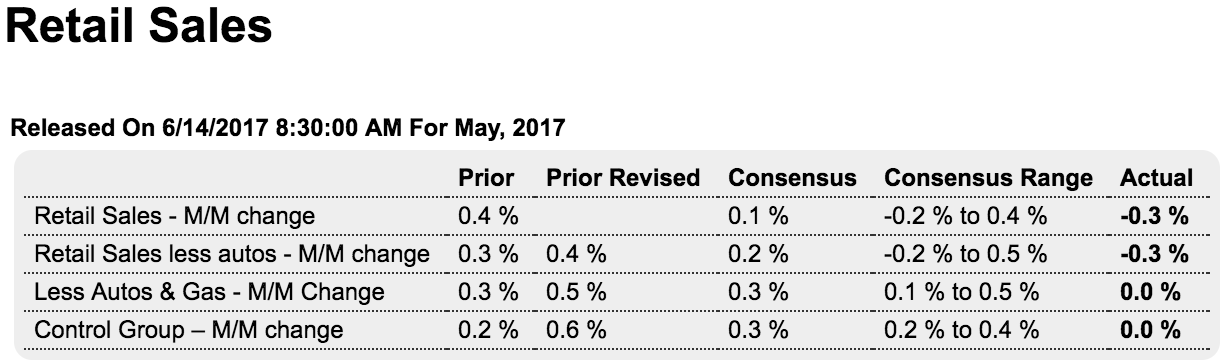
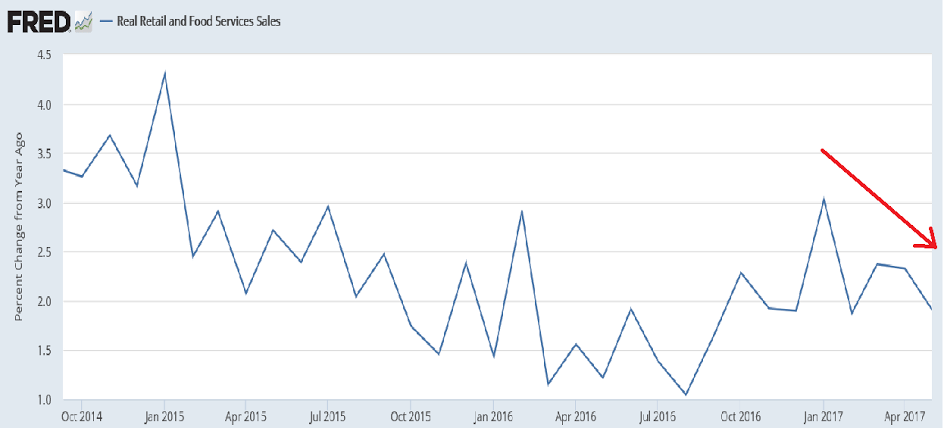
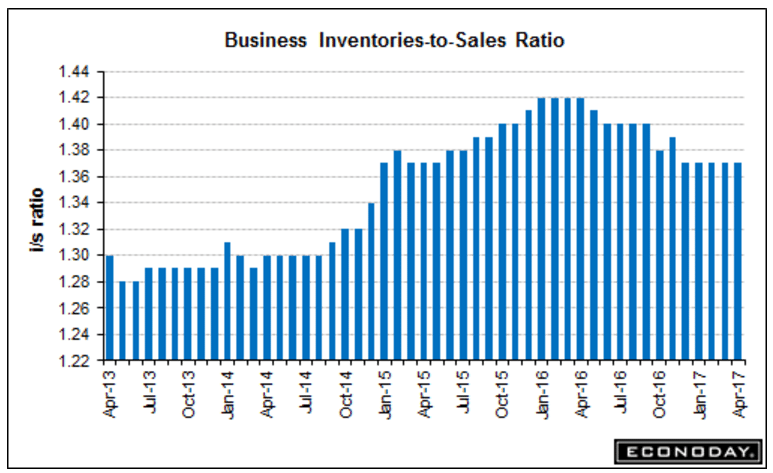
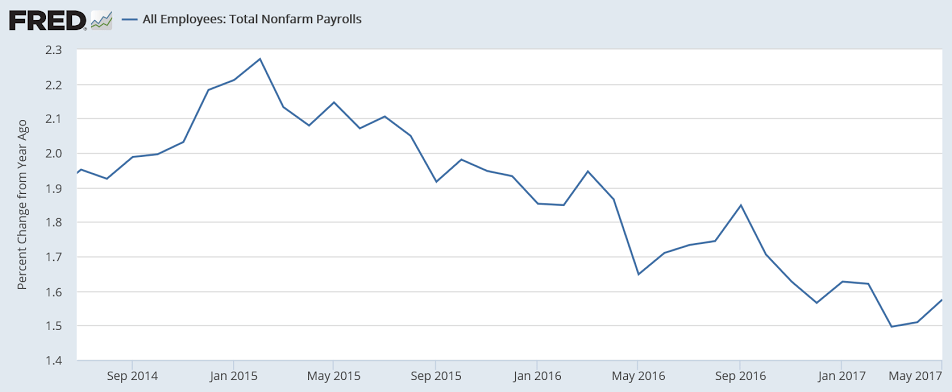
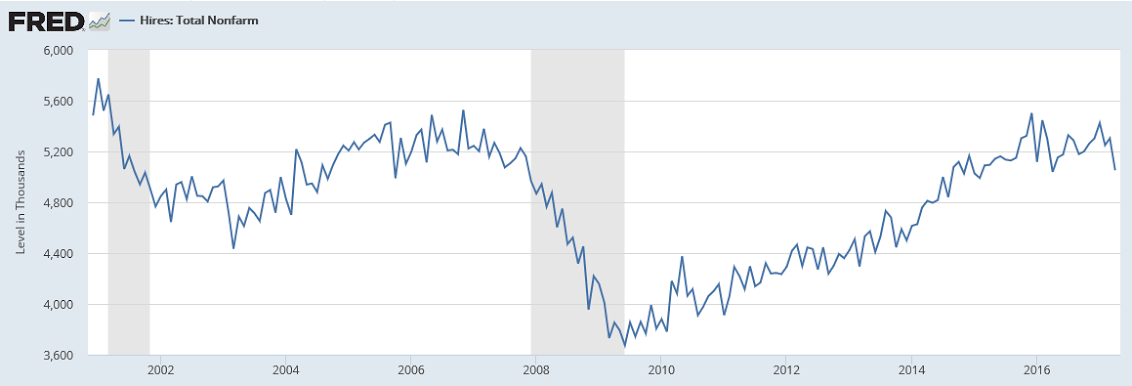
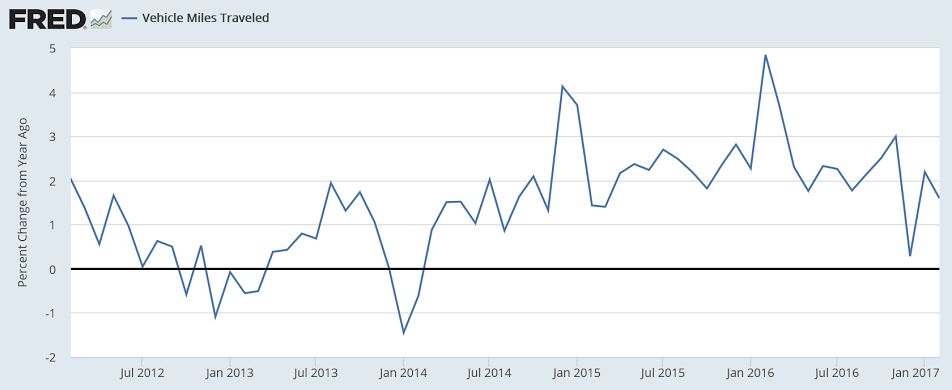
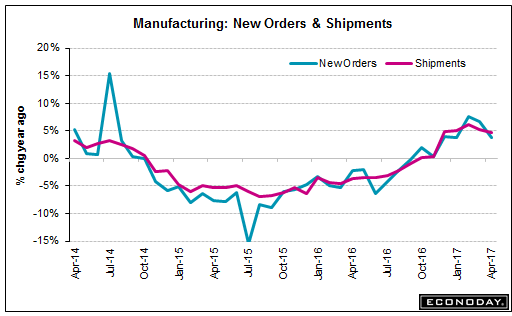
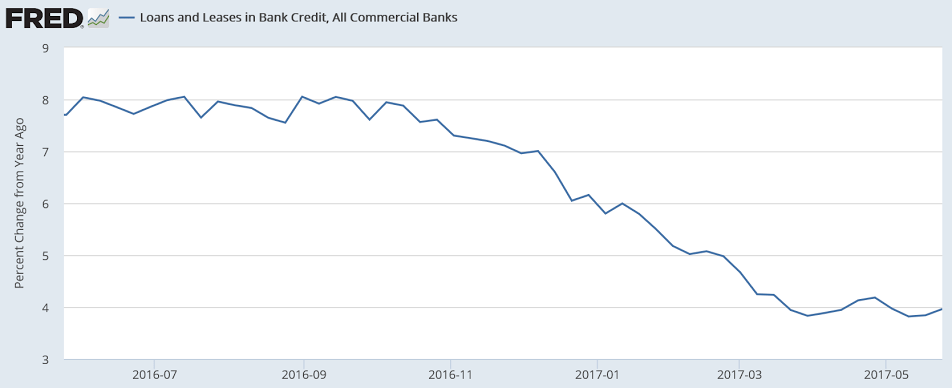
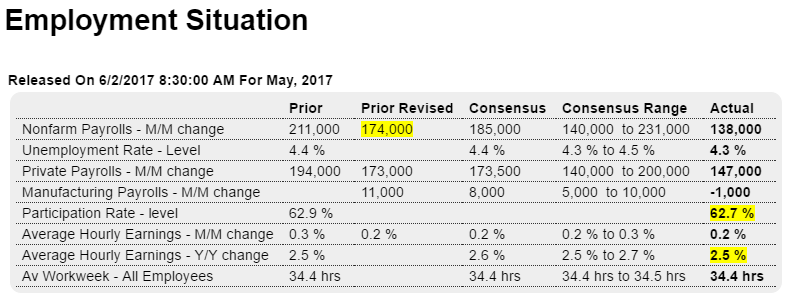
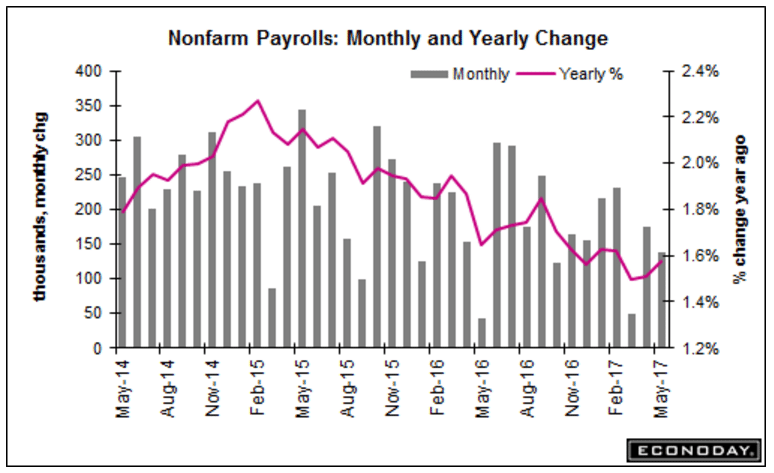
Muddling through at just over a 2% annual rate, but q2 looking weaker than q1:
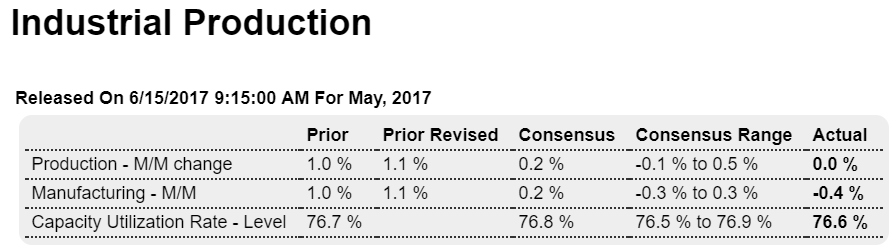
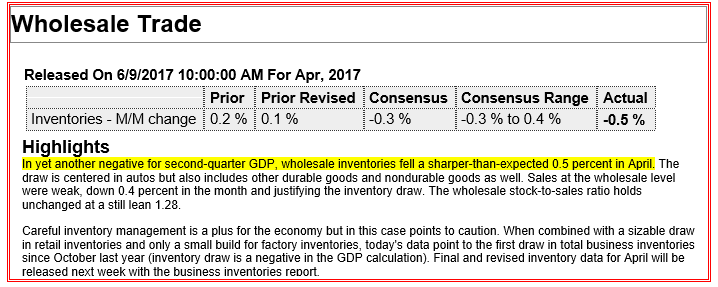
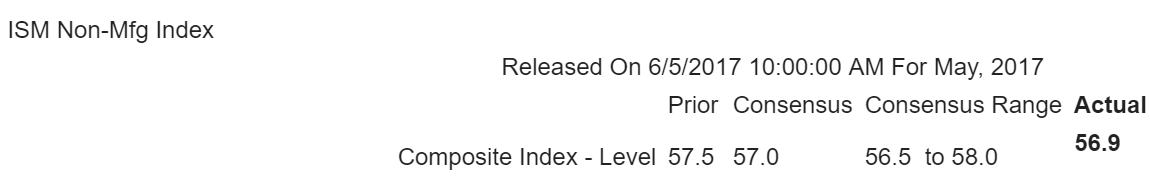
Highlights

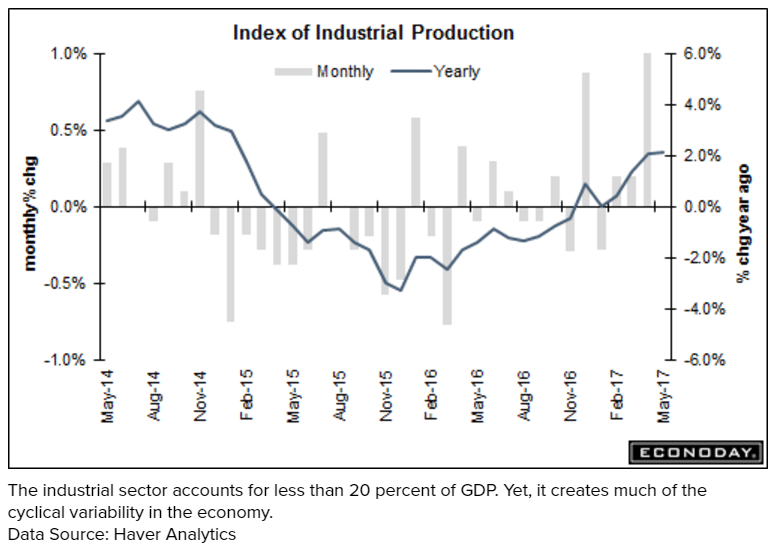
Forget about all the strength in the low sample-sized regional reports. Government data are not pointing to strength at all as manufacturing readings in the May industrial production report are a matter of concern.

Industrial production could manage no better than an unchanged reading in May while the manufacturing component fell 0.4 percent. Both are lower than expected with manufacturing below Econoday’s low estimate.

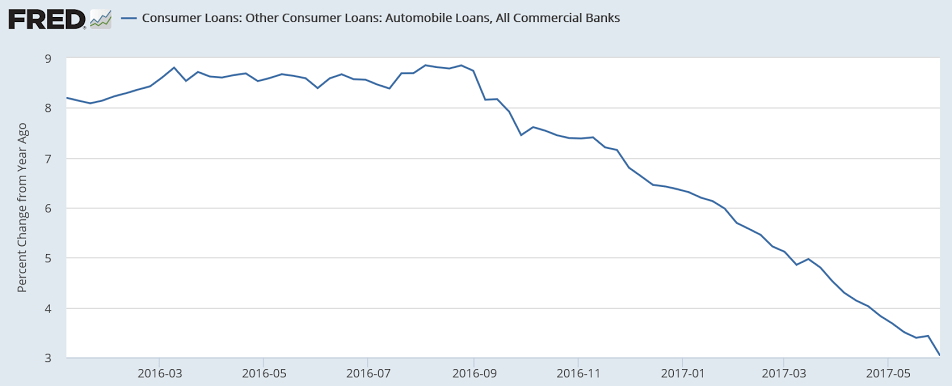
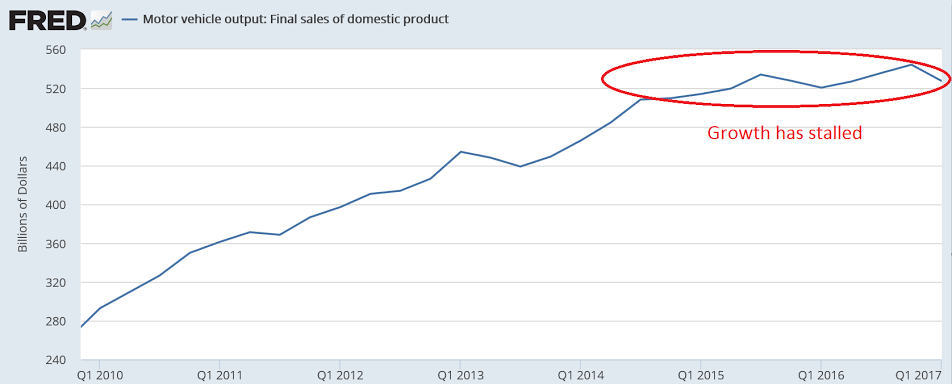
Vehicle production fell sharply in the month, down 2.0 percent in a reminder that consumer spending on autos has been very weak this year. And in a reminder of how weak capital goods data have been, production of business equipment fell 0.7 percent. Hi-tech goods, in yet further confirmation of trouble, were unchanged in the month.

The mining component is a positive in this report, up 1.6 percent for a second straight strong gain, with the utilities component also positive, at plus 0.4 percent.

But manufacturing makes up the vast bulk of the nation’s industrial sector and today’s report makes April’s strength look very isolated. This report is bad news for durables data yet to be released not to mention factory payrolls.

Note that traditional non-NAICS numbers for industrial production may differ marginally from NAICS basis figures.

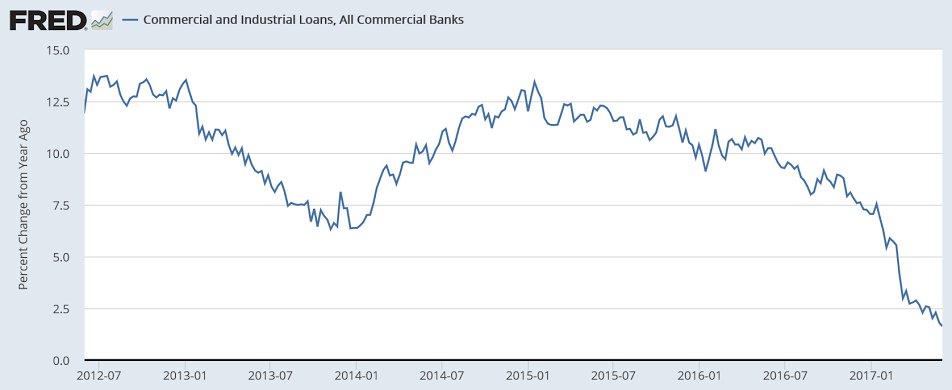
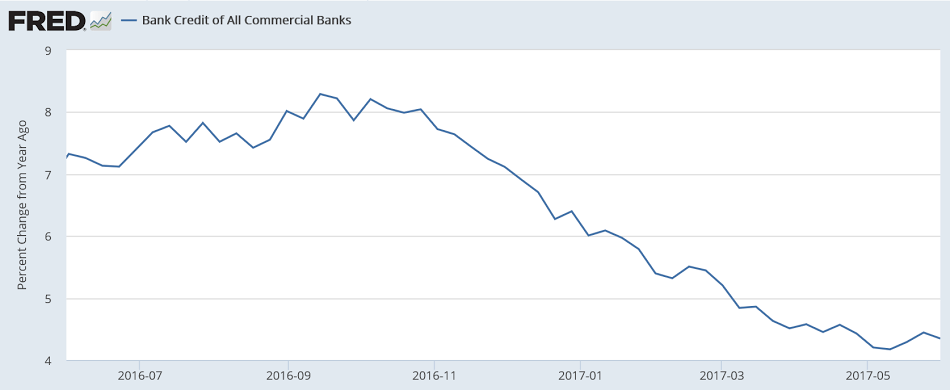
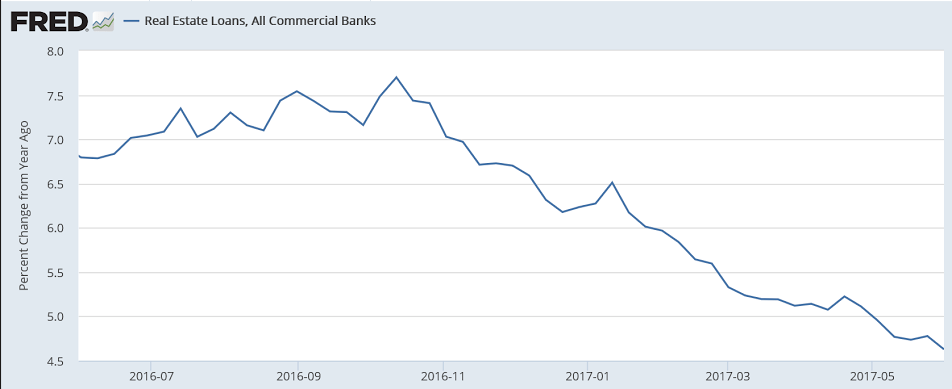
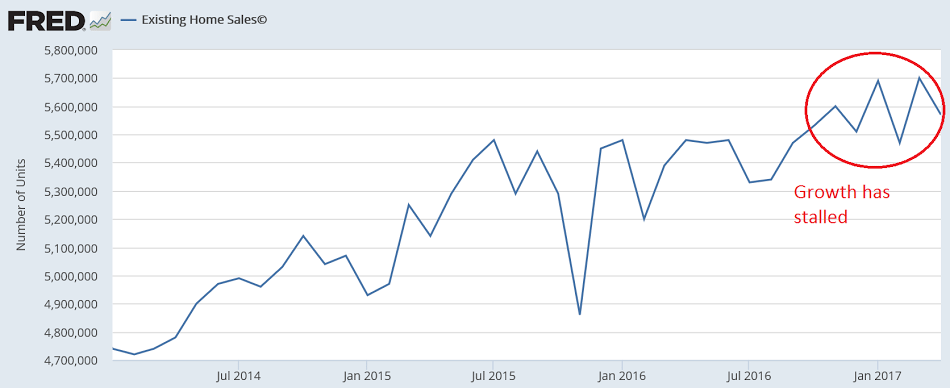
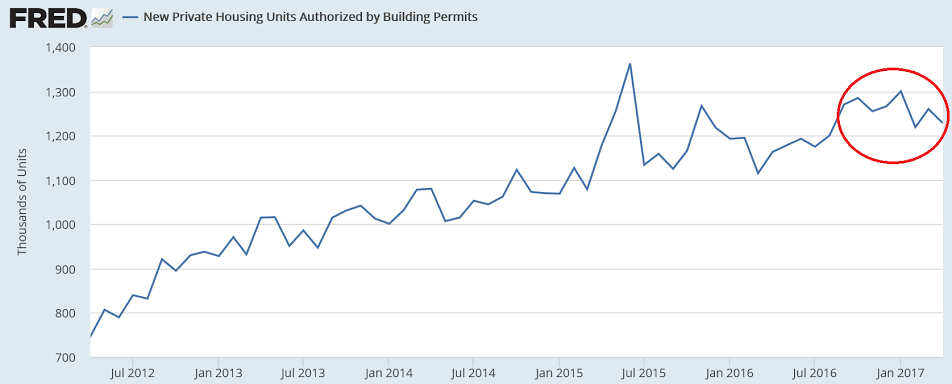
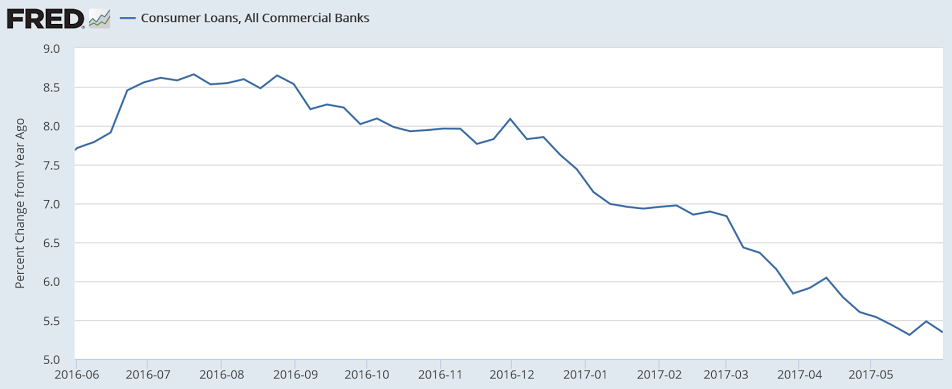
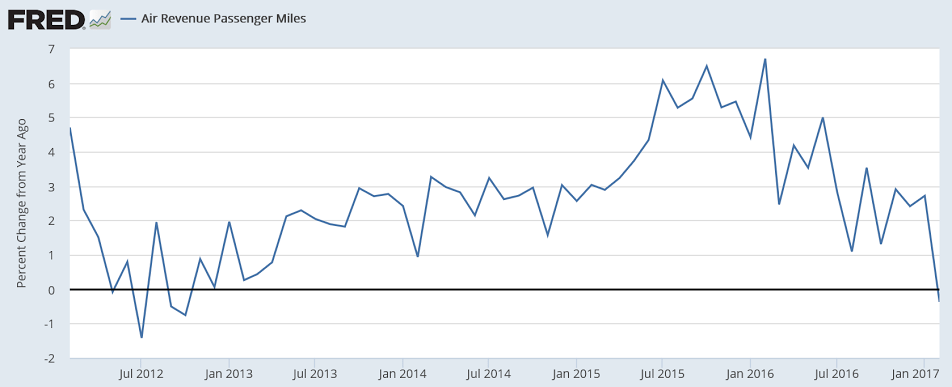
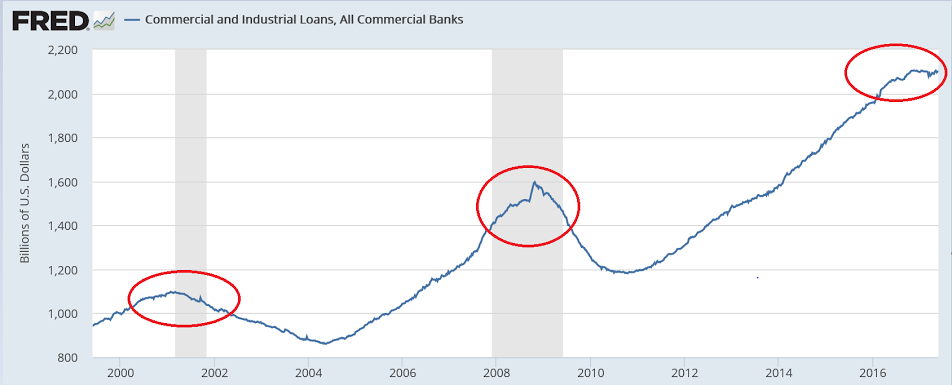
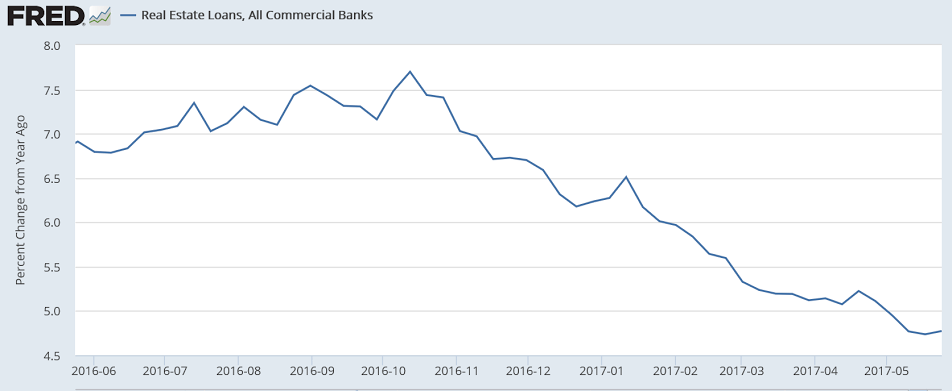
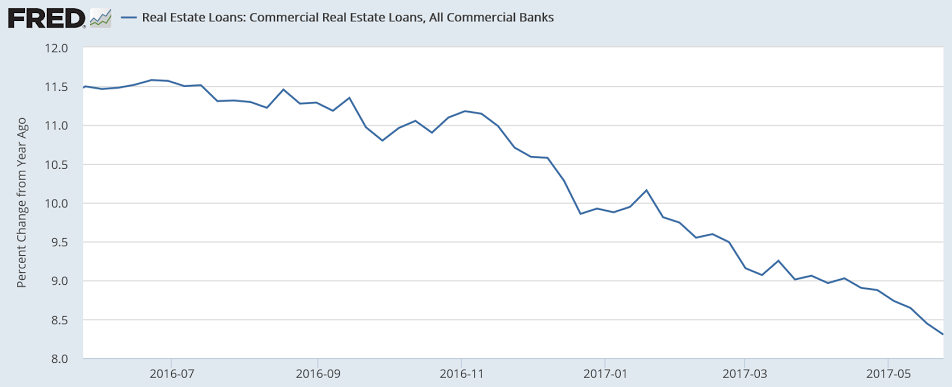
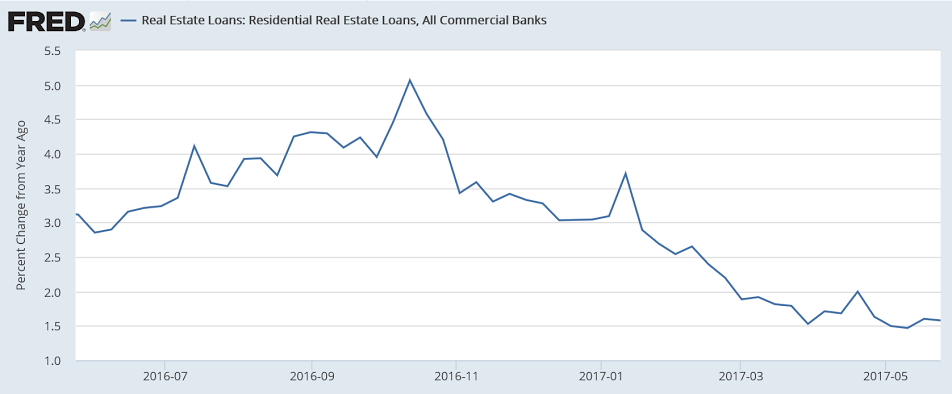
Housing is sagging in line with sagging bank real estate lending:
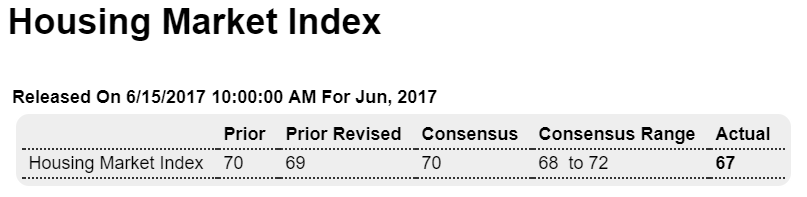
Highlights

Home builders have been very optimistic this year but are a little less upbeat this month. The housing market index slipped to 67 in June, down 2 points from a downward revised 69 in May and just below Econoday’s low estimate. But expectations for future sales, at 76, remain unusually strong with current sales also unusually strong at 73. The one component, however, that had been coming to life is back below 50 as traffic fell 2 points to 49. Lack of traffic, and here the emphasis is on first-time buyers, does not point to renewed strength for home sales data which started the year very strong but have since slowed. Regional data are very solid with the West, Midwest, and South all clumped near composite scores of 70 while the Northeast continues to lag in the distance at 46. Watch for housing starts on tomorrow’s calendar where snap-back strength is the call.

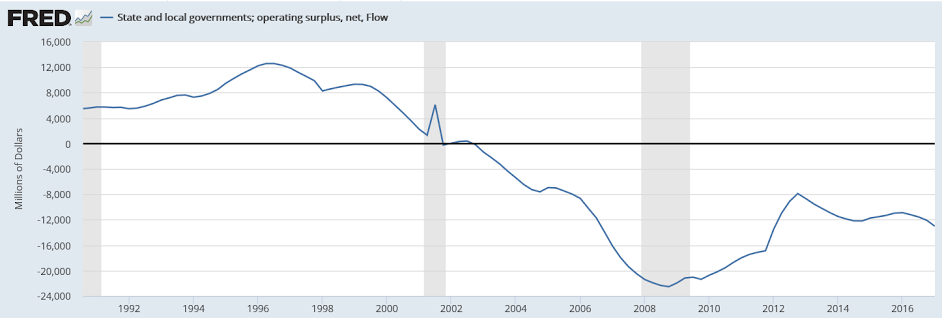
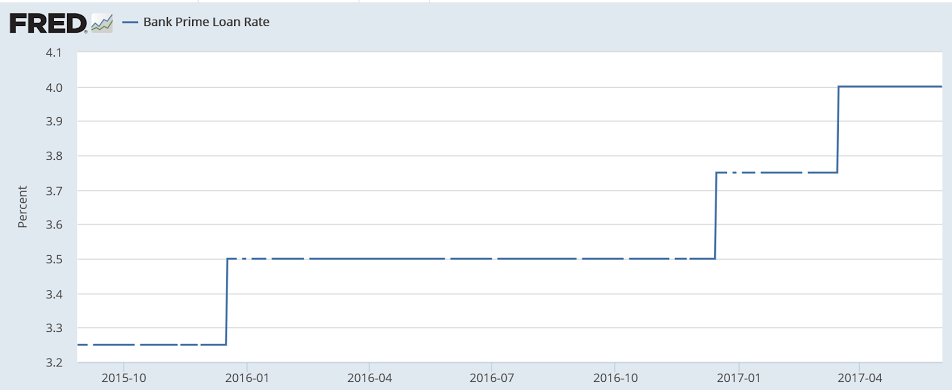
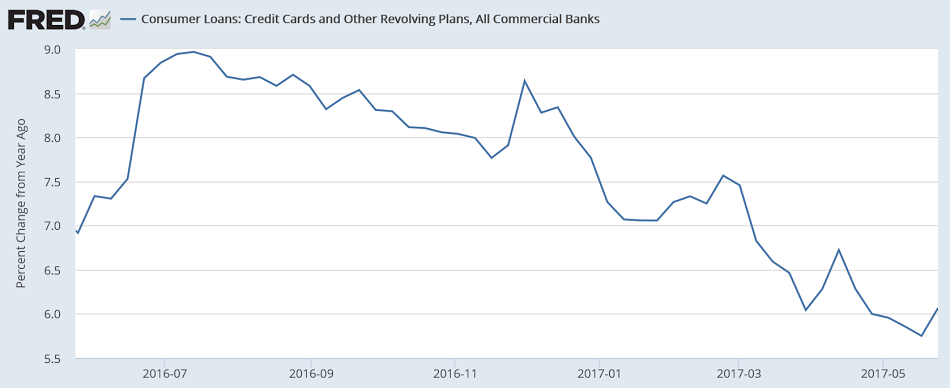
This is part of the reason the Fed hiked rates…
;)

Retail sales, CPI, business inventories

Highlights

Consumer spending was unusually weak in the first quarter and doesn’t look to be improving this quarter. Retail sales fell 0.3 percent in May vs Econoday’s consensus for a 0.1 percent gain. Weakness riddles the report including a 1.0 percent drop for department stores, a 0.2 percent decline for autos, and a 0.1 percent dip for restaurants. Two readings that echo price contraction in this morning’s consumer price report are gasoline stations, down 2.4 percent, and electronics & appliances stores, down 2.8 percent as phone prices continue to come down.

Other readings are likewise very weak, at minus 0.3 percent excluding autos and no change when excluding both autos and gasoline. Control group sales are also unchanged (this excludes autos, building materials, gasoline and restaurants).

Wages aren’t showing any traction and neither is consumer spending. The consumer just hasn’t been participating this year and will need to accelerate very quickly otherwise second-quarter GDP is in jeopardy. Yet expectations seem fixed that the Fed, despite consumer weakness and despite inflation weakness, is determined to raise rates at today’s FOMC.

The drop since November concerns me as that’s when all the credit aggregates picked up their pace of deceleration, including consumer credit:

Since November, this has turned south as well:

Inventory and sales both dropping, not good:

Highlights

The news on the second quarter continues to darken as business inventories fell 0.2 percent in April which is 1 tenth below Econoday’s consensus. Inventories at retailers also fell 0.2 percent with wholesale inventories down a very sharp 0.5 percent. Factory inventories were positive but only barely, at 0.1 percent. Declining inventories are a possible signal of business caution and a certain negative for second-quarter GDP.

NFIB small business index, household spending expectations, restaurant performance index, Trump news

Trumped up expectations coming off only slowly. Actual business conditions have
not yet responded:

Not much optimism here:

Trumped up expectations reversed more quickly here:

Indicates active selling of US equities and buying of euro equities. This could be part of the process of portfolio managers selling $US to buy euro, reversing shifting in the other direction for the last several years as portfolios shifted out of euro due to political fears and fears of ‘money printing’ by the ECB, which have failed to be of expected consequence.

Meanwhile, at current fx prices, the massive euro area trade surplus continues, which is by identity a ‘rest of world’ deficit, ‘draining’ that many net euro from the global economy:

This was yesterday’s news and has already been replaced by today’s stories as this type of thing seems to be growing exponentially:

“Never has there been a president, with few exceptions … who has passed more legislation, done more things,” Trump declared, even though Congress, which is controlled by his party, hasn’t passed any major legislation.

He hailed his plan for the “single biggest tax cut in American history,” even though he hasn’t proposed a plan and Congress hasn’t acted on one.

He said “no one would have believed” his election could have created so many new jobs over the past seven months (1.1 million), even though more jobs (1.3 million) were created in the previous seven months.

Credit check, Fed comment

The collapse continues.

With total bank credit just over $12.5 trillion, it’s about $500 billion less than it would have been had last year’s loan growth continued.

If this lower rate of loan growth continues, and isn’t replaced by some other channel that facilitates agents spending more than their incomes, the implication is that GDP could be a full 2% less than last year, as a substantial portion of bank lending finances purchases of real goods and services:

Looks like another rate hike coming from the Fed next week.

Seems to me the Fed models (not mine) tell them rates work through the credit channels, the idea being a rate hike will slow down credit growth and thereby keep the economy from overheating, etc.

But with credit growth as it is per the above charts, seems they are already decelerating.

So what would be the point of a rate hike?

To make credit growth decelerate even faster?

JOLTS, Q1 Mortgage Report

Maybe the reasoning openings are so much higher than hires is because openings are for jobs that pay less than current employees are earning, in the hopes the company can replace them? ;)

Highlights

Job openings are nearly 1 million ahead of hirings in a widening spread pointing to skill scarcity in the labor market. Job openings totaled 6.044 million in April which is well outside Econoday’s high estimate for 5.765 million and up from a revised 5.785 million in the prior month. Hirings totaled 5.051 million which is well down from March’s 5.304 million with the spread between the two nearly 150,000 higher at 993,000.

Job openings, representing labor demand, is a complementary statistic to unemployment, which represents labor supply. Useful comparisons for this report are the 6.9 million unemployed and the 12.4 million in the total available labor pool. The gap between openings and hiring first opened up about 2 years ago signaling that employers are having a hard time finding people with the right skills. Today’s report offers confirmation that demand for labor, in distinction to hiring, is a chief feature of the economy.

This chart doesn’t look so good to me:

Press Release: Black Knight’s Mortgage Monitor: Q1 2017 Originations Fall 34 Percent, Led By 45 Percent Drop in Refinance Lending; Despite Recent Rate Softening, Home Affordability Remains Near Post-Recession Low

Today, the Data & Analytics division of Black Knight Financial Services, Inc. released its latest Mortgage Monitor Report, based on data as of the end of April 2017. This month, Black Knight looked at Q1 2017 purchase and refinance originations, finding significant quarterly declines in volume among both. As Black Knight Data & Analytics Executive Vice President Ben Graboske explained, the declines are rooted in the upward interest rate shift seen in Q4 2016.

“Overall, first lien mortgage originations fell by 34 percent in the first quarter of 2017,” said Graboske. “As expected, the decline was most pronounced in the refinance market, which saw a 45 percent decline from Q4 2016 and were down 20 percent from last year. They also made up a smaller share of overall originations than in the past; just 45 percent of total Q1 originations were refinances vs. 54 percent in Q4 2016. Purchase originations were also down 21 percent from Q4 2016, although the first quarter is historically the calendar-year low for such lending. Purchase lending was up year-over-year, but the three percent annual growth is a marked decline from Q4 2016’s 12 percent, and marks the slowest growth rate Black Knight has observed in more than three years – going back to Q4 2013. At that point in time, interest rates had risen abruptly – very similarly to what we saw at the end of 2016 – and originations slowed considerably. The same dynamic is at work here.

“Likewise, refinance lending among higher-credit-score borrowers, who have largely driven the refinance market these past several years, saw a quarterly decline of 50 percent. As we’ve seen in the past, these borrowers tend to strike quickly and often when interest rate incentives are present, but tend to hold back when the conditions are less favorable. At the other end of the credit spectrum, lower credit borrowers – those with credit scores below 700 – only saw refinance volumes decrease by 24 percent. Again, we saw a similar phenomenon when rates rose in late 2013/early 2014. This is worth noting as we monitor the future performance of 2017 originations. Not only are refinances — which generally tend to outperform purchase mortgages — making up a smaller share of the market, but there’s also been a net lowering of average credit scores as well. The average Q1 2017 refinance credit score was 742, down from 751 in Q4 2016, and the lowest average credit score since Q3 2014. Both of these factors could have a dampening factor on mortgage performance, holistically speaking.”

Read more at http://www.calculatedriskblog.com/#IWytwlvI9bjUdXXs.99

Interest rates, PMI services, Factory orders, ISM services

So I was reminded that I did write and post in November about what might happen if rates went up in anticipation of Fed hiking in a weak loan demand environment. (Thanks David for reminding me!) I was thinking that some portion of whatever borrowing interest there was might no longer qualify, causing a decline in the growth of borrowing to spend by businesses as well as consumers.

If rates go up when loan demand is strong enough so the borrowing continues, the added loan payments flow back to earnings for the lender, and govt. pays more interest, so it can all not only keep going but accelerate. However, if demand is weak, and rates go up as they did late last year due to anticipation of Fed hikes, borrowing and spending can decelerate, as per the charts:

A couple of other indicators that started sagging in November:

Highlights

Moderate is the message from the PMI services index which finishes May at a lower-than-expected 53.6, down 4 tenths from the mid-month flash but up a solid 1.1 points from final April and up 5 tenths from April’s flash. Most readings rose back to strength early in the year including new orders with backlog orders showing their first build since January. Employment is at a 3-month high with optimism on the general outlook, however, remaining subdued. There are badly needed signs of inflation in the report with input costs on the rise and selling prices also moving higher. This is a positive though far from robust report. Up next is the ISM non-manufacturing report which has been running much stronger than the services PMI with the Econoday’s consensus at 57.0.

Highlights

The weak run of second-quarter data continues with April’s 0.2 percent decline in factory orders. The durable goods component fell 0.8 percent in the month reflecting a give back in aircraft orders and wide weakness for most readings. Orders for non-durable goods rose 0.4 percent reflecting moderate gains for food and energy.

The ex-transportation reading, which excludes aircraft, managed only a 0.1 percent gain in the month with core capital goods orders (nondefense ex-aircraft) also up only 0.1 percent. April’s shipments of core capital goods, which are an input into second-quarter GDP, also rose only 0.1 percent which is another negative in this report. And only a marginal positive for GDP is a 0.1 percent rise in total inventories. Total shipments were unchanged in the month keeping the inventory-to-shipments ratio unchanged at 1.38.

Positives in the report include a 0.6 percent rise for motor vehicle orders and a 1.6 percent rise for computers. Also total unfilled orders, which contracted through most of last year, are up 0.2 percent for a second straight small gain.

Another positive in the report is an upward revision to March factory orders which now stand at 1.0 percent following February’s 0.8 percent gain. But the prior gains were driven by aircraft as the ex-transportation reading could move only modestly higher. The factory sector is not living up to the promise of the high-flying regional reports and, instead of accelerating this year, now appears to be struggling.

Credit check

The charts show it all went bad around November. And it continues to deteriorate with every passing week, with the latest data showing cars, housing, and employment decelerating accordingly.
Must have been some event that set it off? It was around the time of the election, but I can’t recall specifically what would set off something like this?
Comments welcome!

Employment, Trade

The chart says it all- deceleration that started when oil capex collapsed not abetting, and the decelerating credit charts indicate much more of same coming:

Highlights

An unexpectedly weak employment report has put a rate hike at this month’s FOMC in doubt. Nonfarm payrolls rose only 138,000 in May which is nearly 50,000 below expectations. Importantly, April and March have been downwardly revised by a net 66,000.

Average hourly earnings are also not favorable, up only 02 percent in May with April revised down 1 tenth and now also at 0.2 percent. Wages are going nowhere with the year-on-year rate sitting at 2.5 percent.

A fall in the participation is yet another negative, down 2 tenths to 62.7 percent and pulling the unemployment rate down 1 tenth to only 4.3 percent. Unemployment is very low and contrasts with the lack of wage pressure.

Manufacturing jobs fell 1,000 in May, retail trade down 6,000, and government down 9,000. There were gainers including construction at 11,000, financial also at 11,000, and professional services at a healthy 38,000.

And these gains tell the other side of this report, that payroll growth, though moving lower, is still healthy. That is what the hawks are going to have argue at the June 13 & 14 meeting, that and the theoretical inevitability that wage pressures will soon build.

Higher than expected trade deficit means GDP was that much lower than expected. And all highly $US unfriendly:

Highlights

The bad news is accelerating for the second quarter. The trade deficit widened in April to $47.6 billion from a revised $45.3 billion in March. This opens the quarter on yet another defensive front.

Exports fell 0.3 percent in April to $191.0 billion as a fractional rise in service exports to $64.0 billion could not outmatch a 0.4 percent decline in goods exports to $126.9 billion.

Imports meanwhile jumped 0.8 percent to $238.6 billion with increasing pressure centered in goods but also including services.

The best positive in the details is a rise in aircraft exports and the worst negative is yet another jump in consumer goods imports, up $2.0 billion in the month to $51.0 billion. Country data show a sharp widening with China, to a $27.6 billion total gap in the month, with the EU gap also up sharply to $14.6 billion.

The conclusion? U.S. demand for foreign products is strong and foreign demand for U.S. products is not.