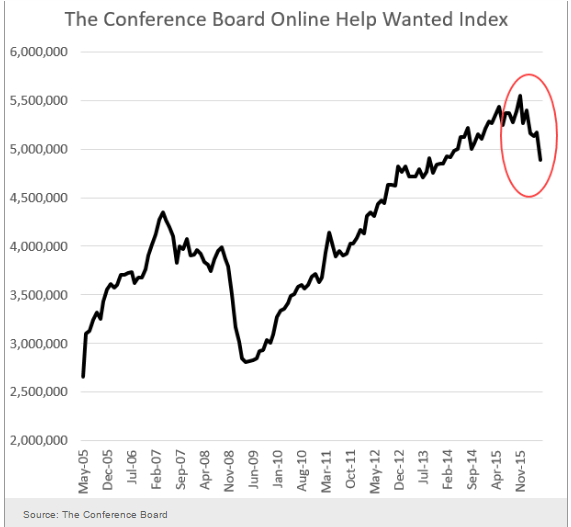
Still nothing happening here:
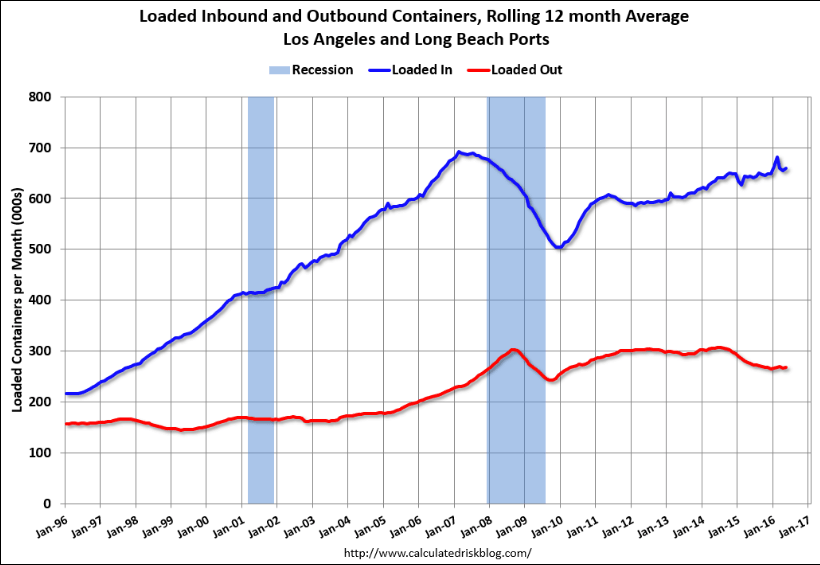
More imports, fewer exports:
Category Archives: Retail Sales
NFIB Small Business Optimism Index, Retail sales, Redbook retail sales, Business inventories
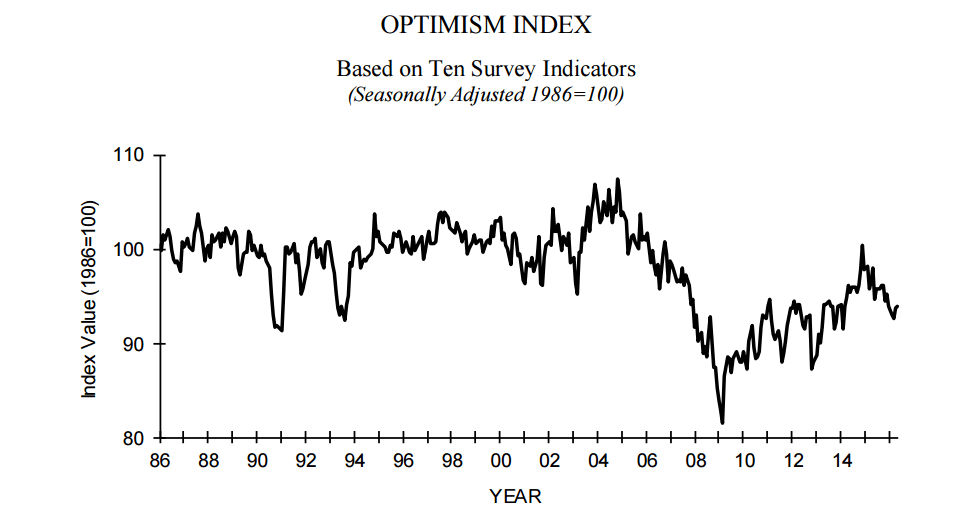
The charts of all the components look just as bad.
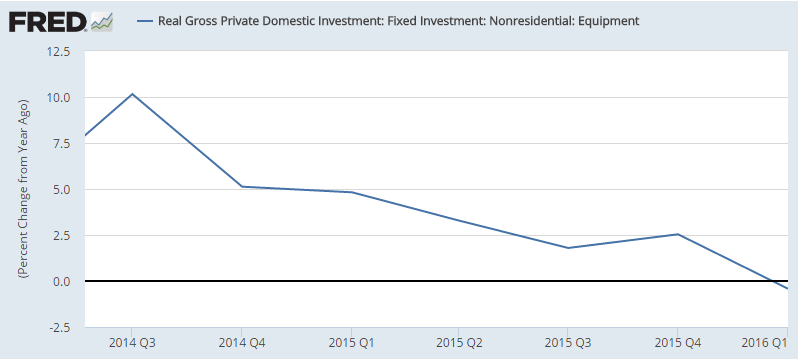
And note the collapse after oil capex collapsed:
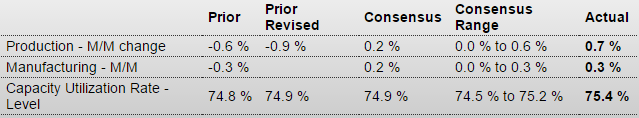
Highlights
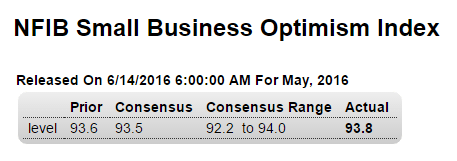
The small business optimism index rose 0.2 points in May to 93.8, slightly extending April’s 1 point bounce back from 2-year lows but remaining well below the 42-year average of 98. Four of the 10 components of the index showed gains in May, two were unchanged and four declined. Expectations that the economy will improve posted the largest gain, rising 5 points but remaining quite negative at minus 13. The two strongest components both declined, with plans to increase capital outlays falling 2 points to a still very solid 23, and job openings hard to fill was also down 2 points to 27, though business owners still find this as their fourth most important business problem. Plans to increase employment did rise 1 point, however, to 12. While earnings trends, the most pessimistic of the components, fell 1 point to minus 20, more business owners thought that now was a good time to expand, up by 1 point to 9.
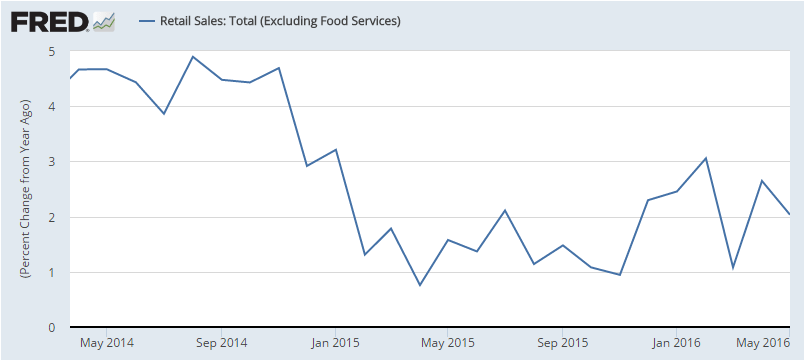
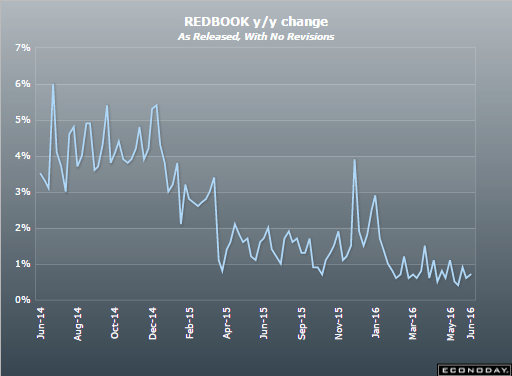
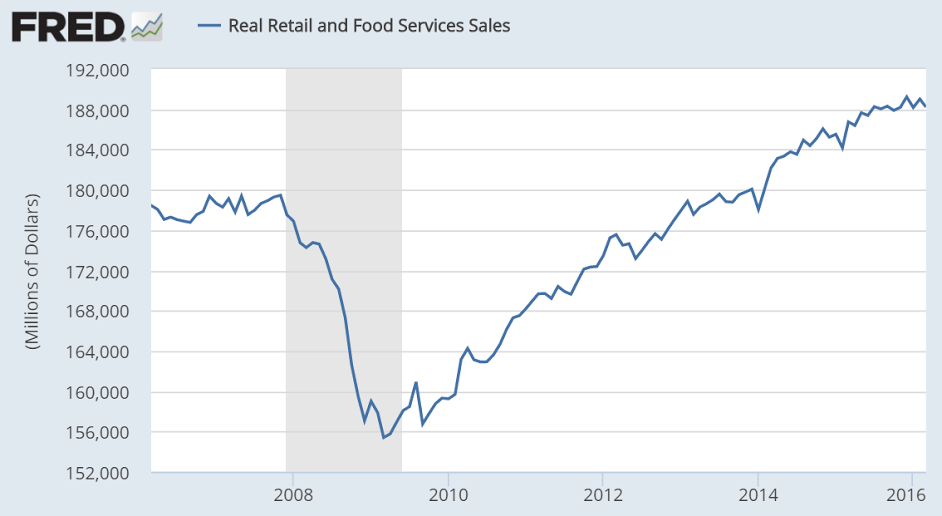
After the promising April release, May is coming back down as suspected, with a lot of help from higher gas prices, which likely will show up as reduced savings. And the year over year down trend continues, with growth at very low levels, after peaking when oil capex collapsed:
 Highlights
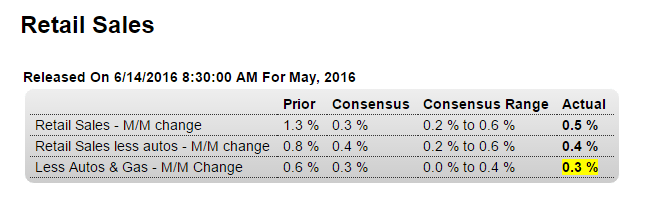
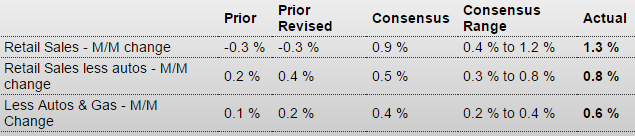
Consumer spending proved to be the biggest surprise of April and is at least a pleasant surprise in May. Retail sales rose a very solid and better-than-expected 0.5 percent with strength evident, though to a less degree than in April, through the balance of the report. Auto sales did give a boost to total sales but sales ex-auto, up 0.4 percent, were nearly as solid. Gasoline, reflecting higher prices, once again gave an outsized boost to sales though the gain for sales excluding autos and gas is respectable at plus 0.3 percent. The gain excluding gas alone also came in at 0.3 percent.
Year-on-year rates, however, moderated several tenths in May and are at very soft levels. Total year-on-year sales are up only 2.5 percent with ex-auto ex-gas at plus 4.1 percent and ex-gas alone at plus 3.7 percent.
Building materials have been very weak, down a steep 1.8 percent for the third straight monthly decline and pointing to moderation in residential investment. General merchandise was also down in the month as were sales at department stores.
The strength in the report is centered once again in nonstore retailers where sales, reflecting big gains for ecommerce, rose 1.3 percent on top of the prior month’s 2.5 percent surge. Year-on-year, nonstore retailers lead the way with at 12.2 percent pace. Restaurants, a key discretionary category, continue to show strength with an 8 tenths gain on the month and a year-on-year rate of 6.5 percent.
Strength is definitely the theme of this report, one that ultimately reflects strength in the labor market and which is pointing squarely to another strong month for total consumer spending in May. The outlook for the second quarter just got an upgrade and will keep alive chances for a rate hike at the July FOMC.
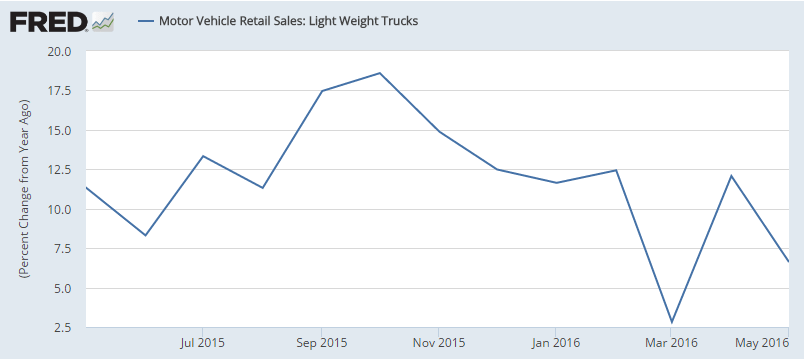
This came out last week:
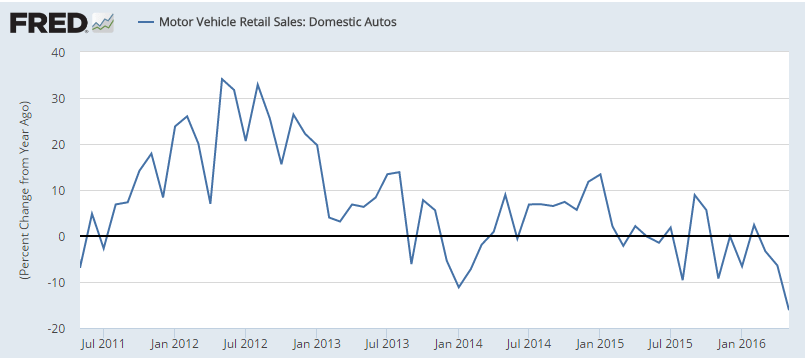
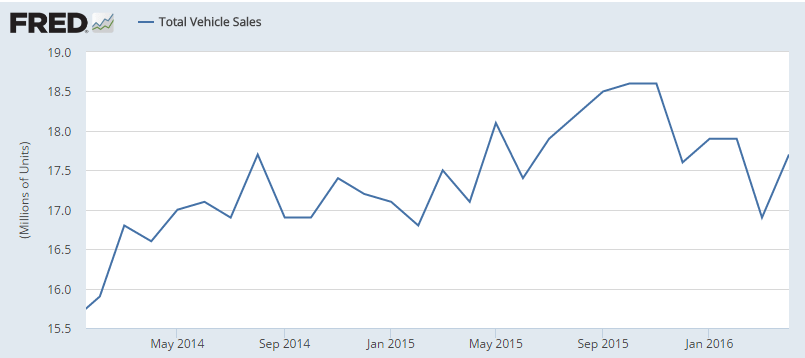
This was where the growth was coming from, and it’s been decelerating as total vehicle sales stagnated:
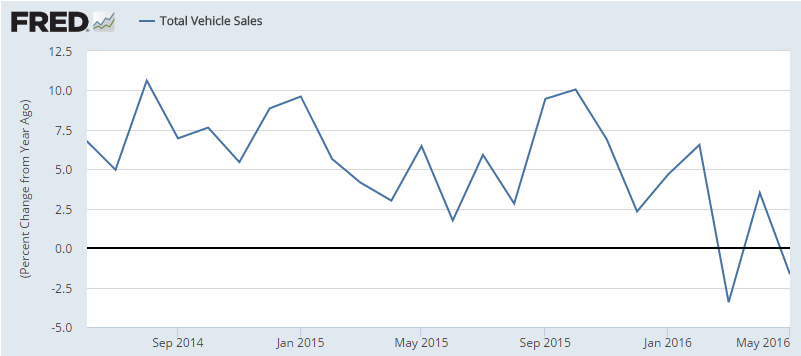
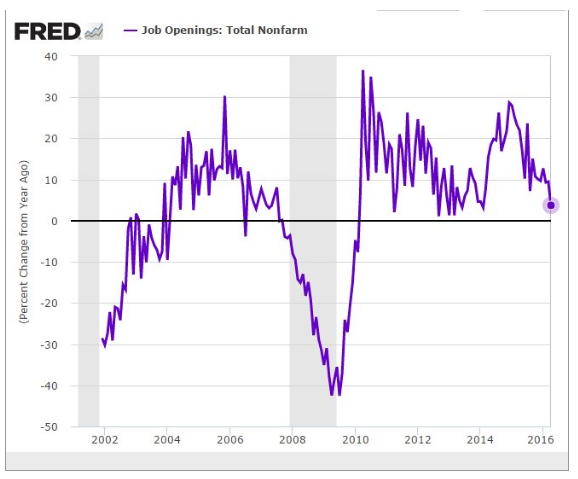
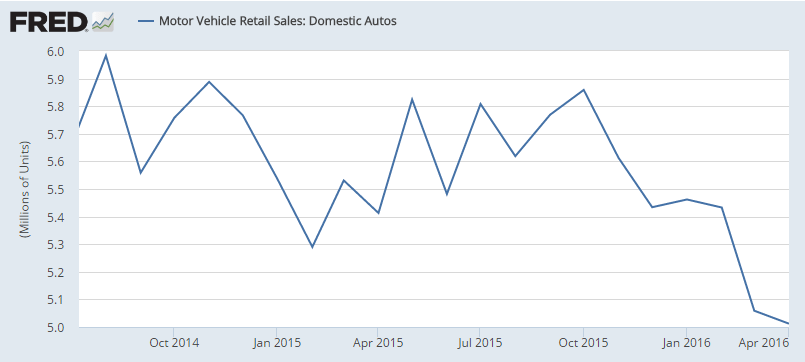
Still no sign of life here:
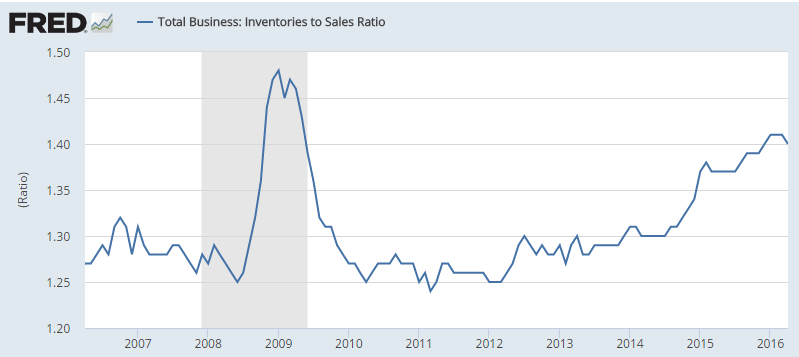
This is an April number, and inventories were still excessive, likely resulting in output cutbacks:
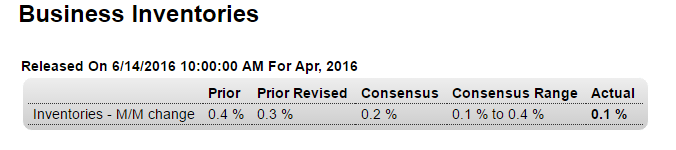
Highlights
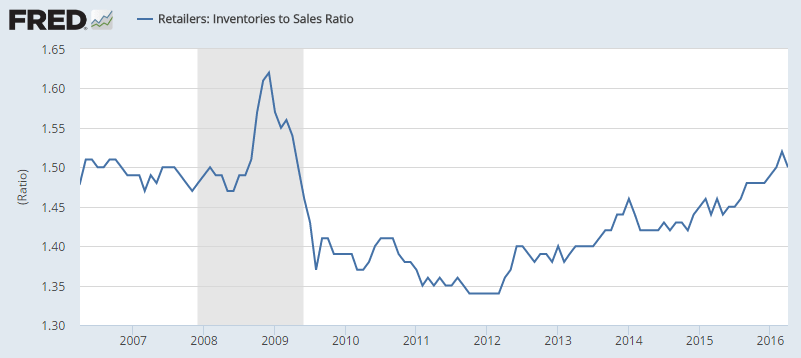
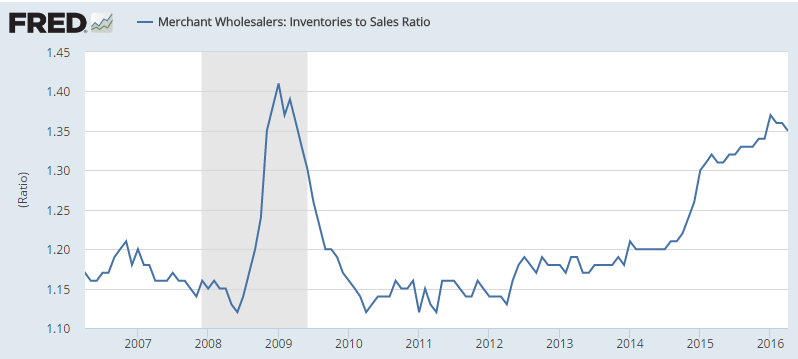
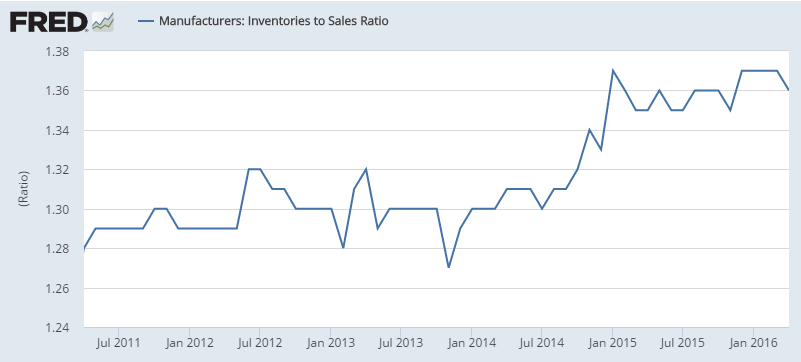
The strength of April now includes business inventories where strong sales limited the build to only 0.1 percent. Business sales jumped 0.9 percent to pull the inventory-to-sales ratio, which had been climbing, down to 1.40 from 1.41. Retail inventories slipped 0.1 percent in April and aren’t likely to build much at all in May given this morning’s strength in the retail sales report. Factory inventories also slipped 0.1 percent with the May outlook to turn on tomorrow’s industrial production report. The negative in April is in wholesale inventories which rose 0.6 percent. Inventory builds are only wanted when there’s strength in sales which, though starting the year off slowly, may now be picking up.
Saudi pricing, Consumer credit, Redbook retail sales, Fed discussion
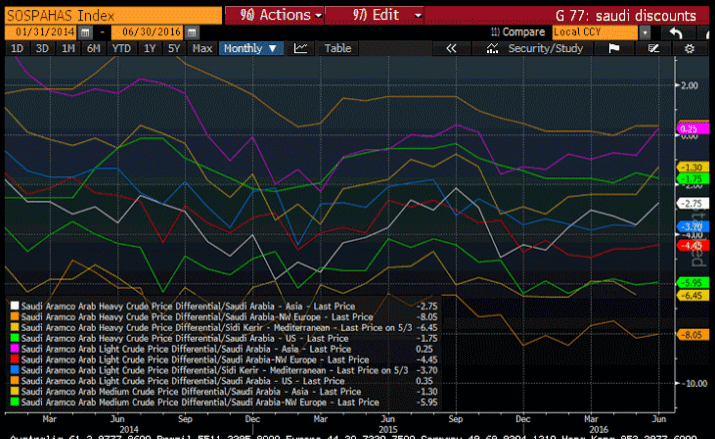
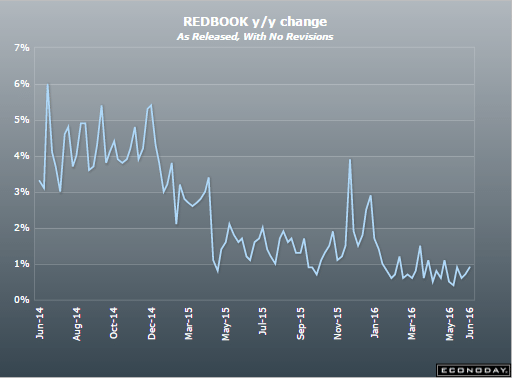
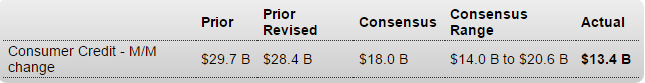
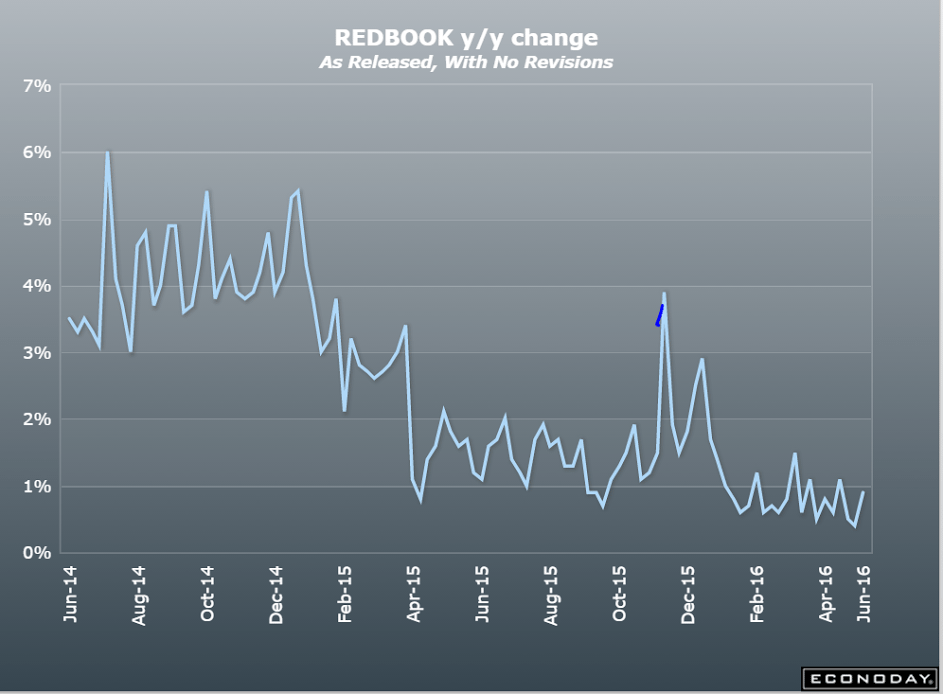
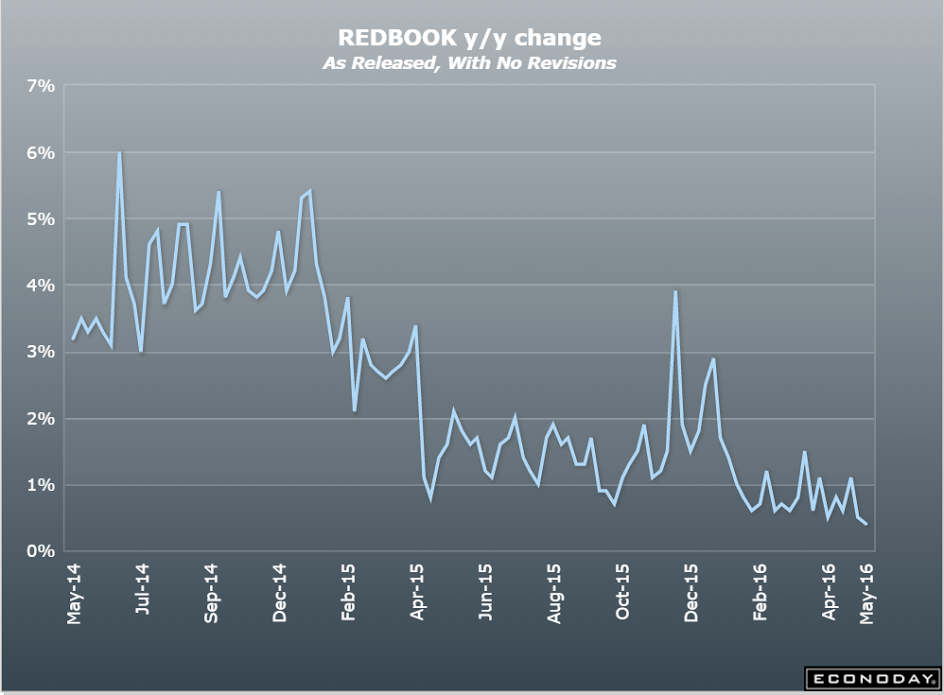
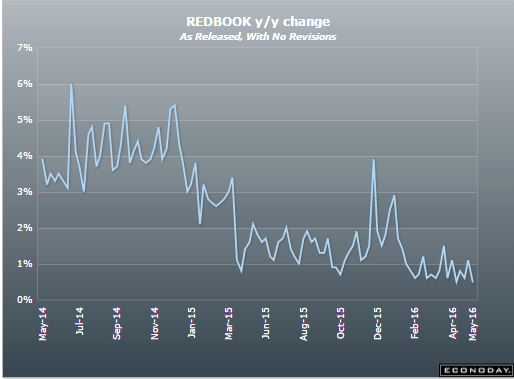
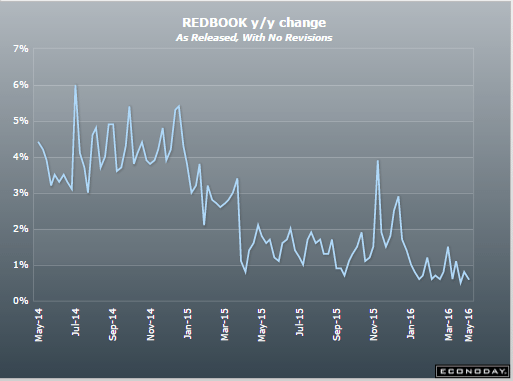
Lower than expected as last month’s higher print reverses.
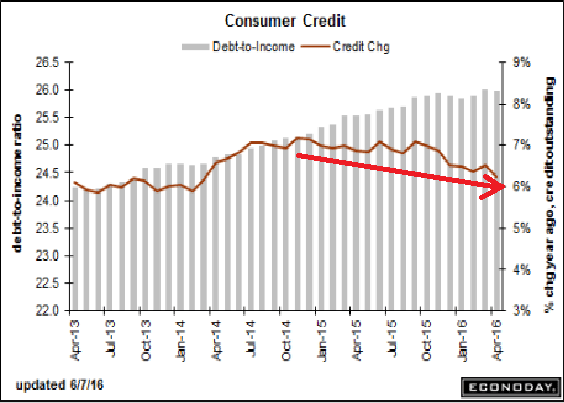
Remember all the hoopla over last month’s number? And how the consumer was finally spending?
I suspect you’ll hear nothing about how that’s not the case after all, and note how the chart shows it’s been decelerating since the collapse of oil capex:
Consumer Credit
Released On 6/7/2016 3:00:00 PM For Apr, 2016
Highlights
April was a strong month for retail sales but it wasn’t an especially strong one for consumer credit which rose $13.4 billion vs the prior month’s outsized gain of $28.4 billion (revised). Revolving credit, which jumped $10.4 billion in the month before, rose $1.6 billion, which like the headline, is on the soft side of trend. Nonrevolving credit rose $11.8 billion reflecting the month’s strength in vehicle sales as well as once again increases in student borrowing. Instead of borrowing, consumers dipped into their savings to fund their April spending spree as the savings rate, in data included in last week’s personal income & outlays report, fell a very sharp 5 tenths to 5.4 percent. Data on May spending got underway last week with unit vehicle sales which held steady at April’s respectable rate and point to another gain for this report’s non-revolving credit component. May’s retail sales, which are on next week’s calendar, may get more of a boost from revolving credit than from another drawdown in the savings rate.
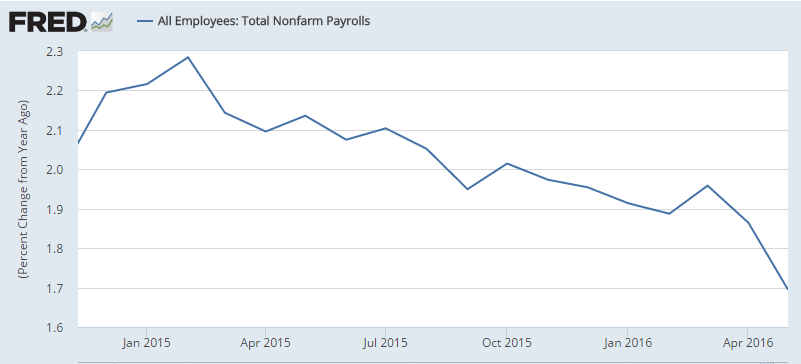
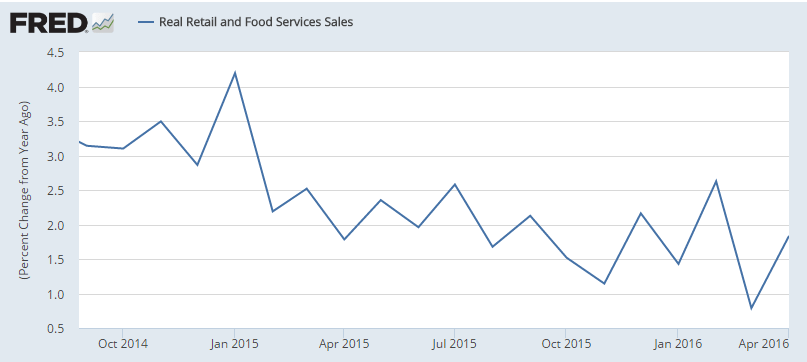
So what else has been decelerating?
This measure of retail sales:
Payroll growth:
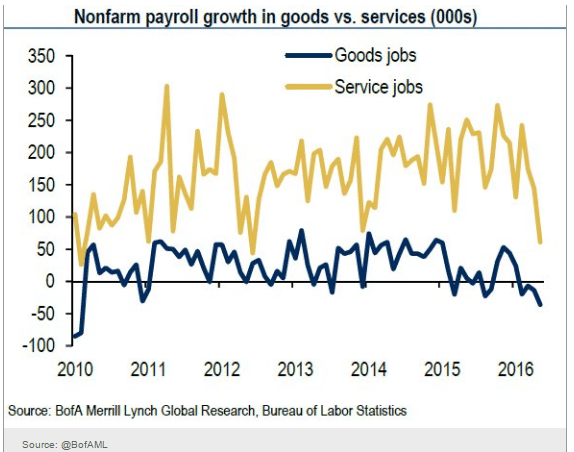
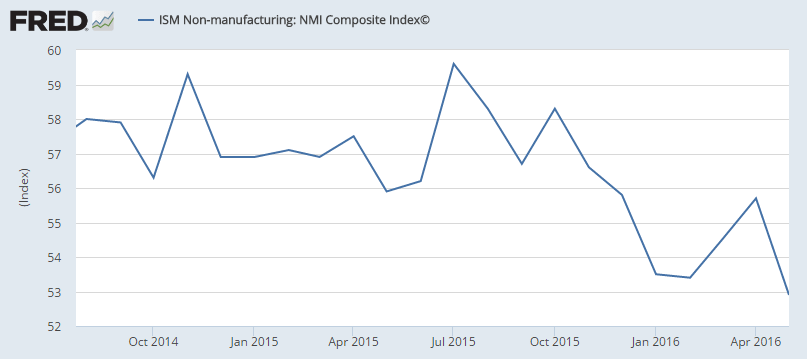
The service sector:
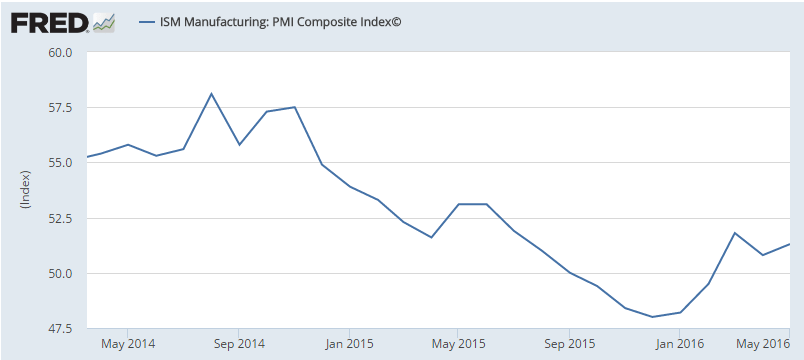
Manufacturing:
Investment:
Car sales:
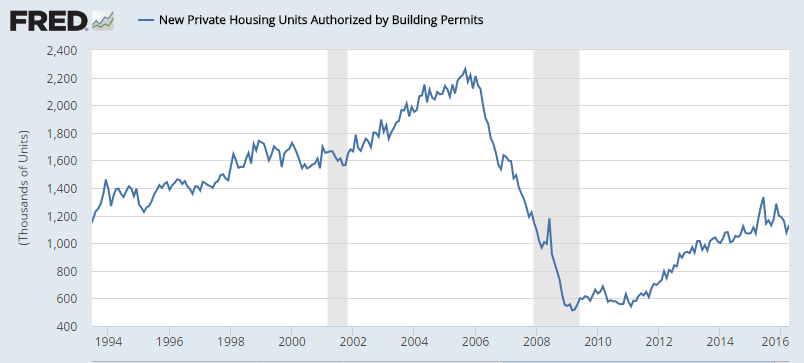
Housing (nothing is built without a prior permit):
Retail sales:
This measure of wage growth just turned down from already low levels:
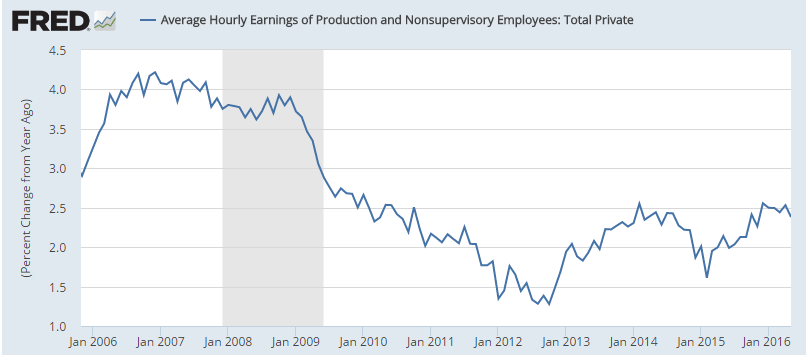
So what’s behind a looming Fed rate increase?
Higher rates are designed to first remove accommodation of interest sensitive sectors, the largest being investment, including housing, and cars, yet they are all decelerating, as are the employment index.
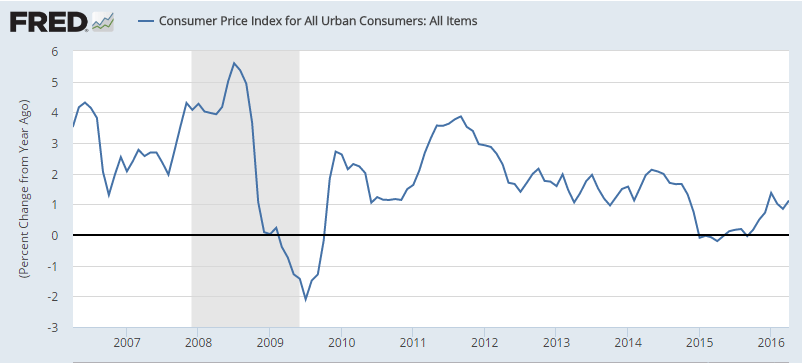
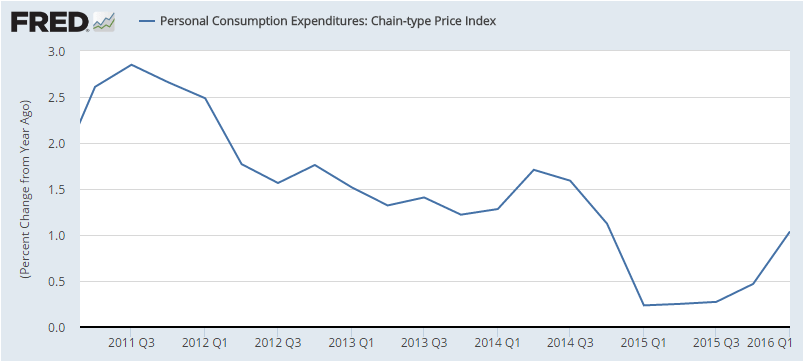
And measures of ‘inflation’ aren’t showing signs of excess demand either:
Mtg purchase apps, Mortgage origination, PMI indexes
Down 5% after last week’s up 5%… ;)
MBA Mortgage Applications
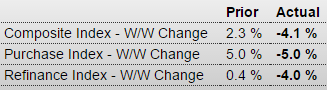
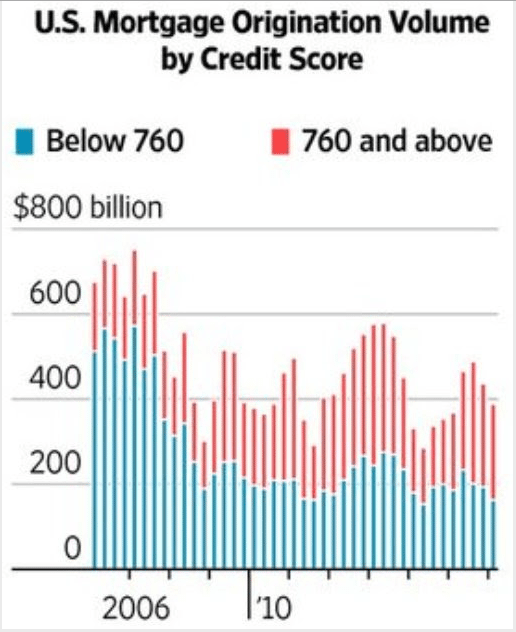
Note that the total is in decline:
This (limited) measure of retail sales is still depressed and weakening as well:
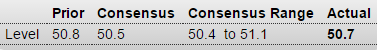
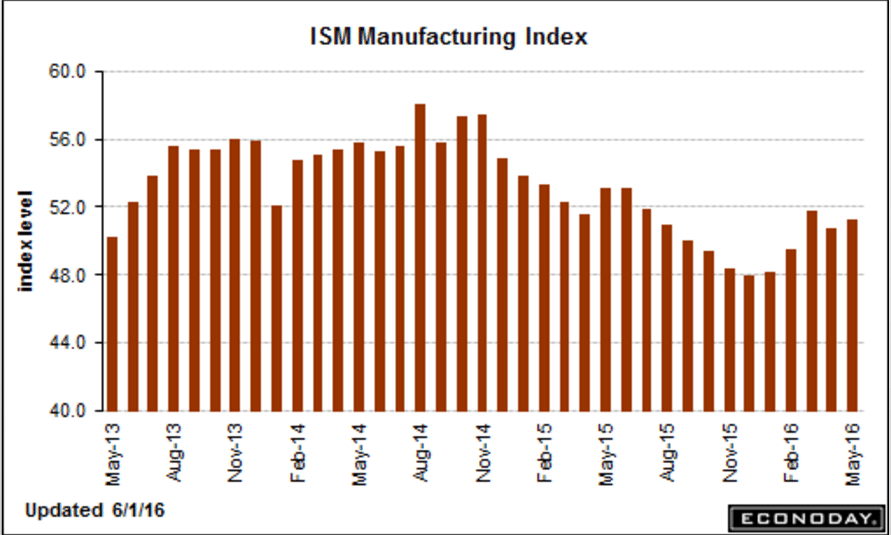
Two manufacturing indexes out today.
The first was slightly lower than last month and trending down:
PMI Manufacturing Index
Highlights
Markit Economics’ U.S. manufacturing sample continues to report nearly dead flat conditions, at a final May index of 50.7 which compares with 50.5 for the mid-month flash and a final 50.8 for April. Production is in outright contraction (below 50) for the first time in 6-1/2 years as growth in new orders is as slow as it’s been all year. Export orders posted a marginal drop while total backlog orders are also down. The sample, however, increased hiring in an anomaly that won’t likely last given the weakness in orders. Efforts to slow inventory accumulation contributed to the decline in production. Price data include an uptick in input costs, tied in part to higher steel prices, but little change for selling prices which is actually an improvement following three straight months of decline.
Negative factors cited by the sample include weak capital investment across the energy sector, uncertainty related to the presidential election and generally subdued economic conditions. Coming up on the calendar at 10:00 a.m. ET will be the closely watched ISM manufacturing index which forecasters see coming in very close to this report, at a consensus 50.6.
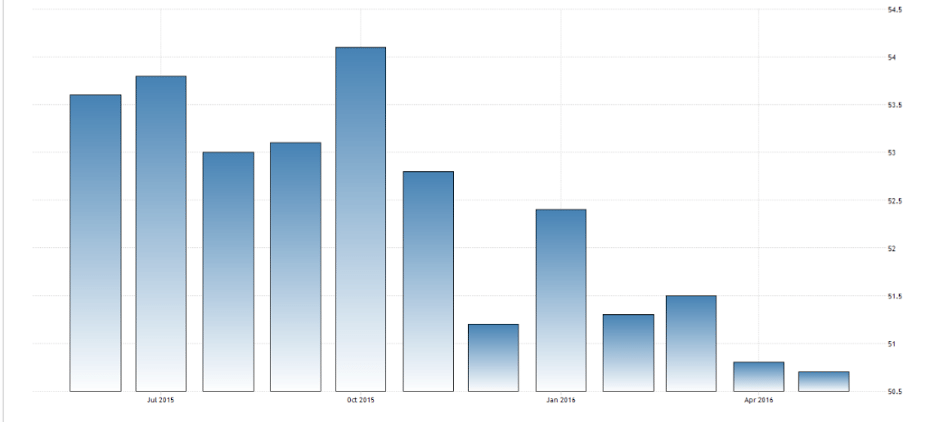
The second was up some from last month but still relatively weak:
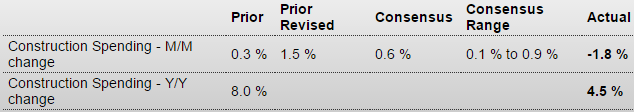
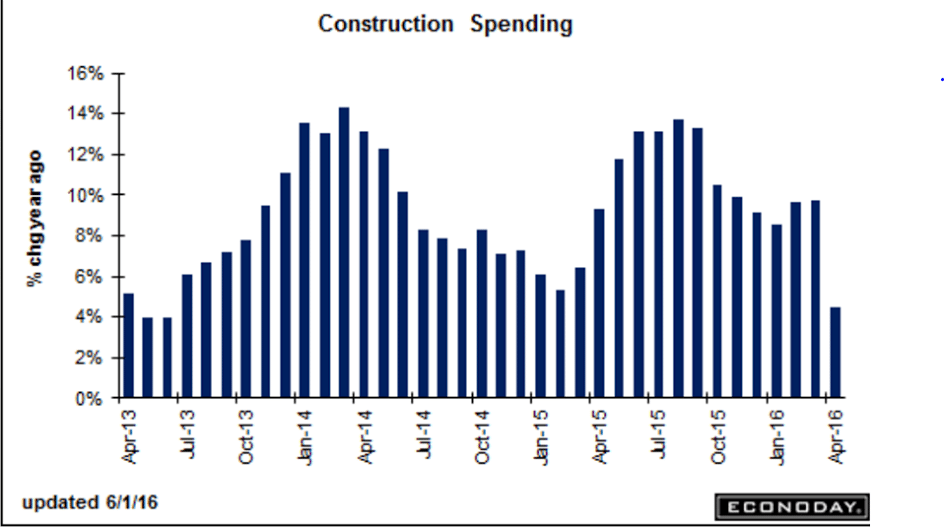
Construction was way down, which is not at all good for GDP:
Construction Spending
Highlights
A major downturn for construction spending in April is offset to a large degree by a major upward revision to the prior month. Construction spending fell 1.8 percent in April for the worst reading since January 2011. But March’s gain, initially at only plus 0.3 percent, is now plus 1.5 percent. And February is also revised higher, up 4 tenths to plus 1.4 percent. Still, the year-on-year rate does point to slowing, at plus 4.5 percent which is down from a long run in the high single digits and the lowest since June 2013.
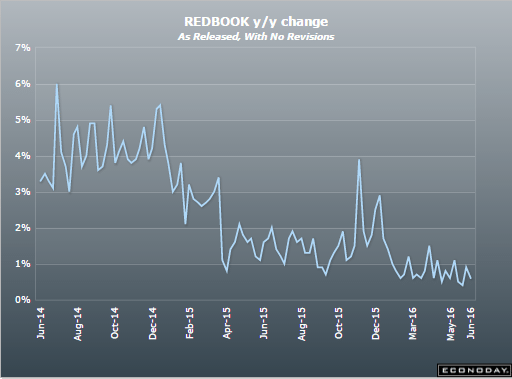
Redbook retail sales, Richmond Fed, New home sales, Chemical activity barometer
From bad to worse:
Another May reversal from a hopeful April gain:
Richmond Fed Manufacturing Index
Highlights
The Richmond Fed index fell a sharp 15 points in May to minus 1, adding further evidence of a serious slowdown in manufacturing activity as also indicated in last week’s Empire State and Philly Fed reports for May. Several of the survey’s key measures dropped steeply and went into contraction from previous strength, with shipments down 22 points from April to -8, backlog orders down 24 points to -13 and capacity utilization down 24 points to -6. New orders which were particularly strong in the previous two months, dropped 18 points to 0. On the employment side, wages remained at a respectable plus 15, but the average workweek fell 4 points to 6 and the number of employees index shed 4 points to 4. Only inventories and prices were a positive for manufacturing in the Richmond Fed region during May, with finished inventories up 5 points to 19 and raw materials inventories up 10 points to 25, while prices received finally showed a small improvement, rising to an annualized rate of 0.77 percent.
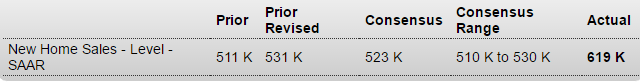
Unexpectedly large April jump in this volatile series. Best to wait and see what May brings before jumping to conclusions?
New Home Sales
Highlights
The new home sales report has sealed its reputation as the wildest set of data around. April’s annualized rate came in at 619,000 which is not a misprint. This is the highest rate since January 2008 and dwarfs all readings of the recovery. February 2015’s rate, way behind at 545,000, is the next highest rate this cycle. The data even include a very large 39,000 net upward revision to the two prior months, a gain that reflects annual revisions which are included in the data. The monthly 16.6 percent surge is not only far beyond expectations but is the biggest monthly gain since way back in January 1992.
The data also include a big jump in prices, up 7.8 percent in the month to a record median $321,100 while the year-on-year rate, which was negative in the March report, is at plus 9.7 percent year-on-year.
But the surge in sales is a negative for supply as supply relative to sales fell very sharply to 4.7 months from 5.5 months. The total number of new homes for sale was little changed, down 1,000 at 243,000.
Regional data show a more than 50 percent jump in the Northeast where however the number of sales relative to other regions is very low. The same is true of the Midwest where sales fell 4.8 percent in the month. The two main regions for new home sales both show outsized gains with the South up 15.8 percent and the West up 23.6 percent.
Year-on-year, total sales are suddenly up 23.8 percent, this at the same time that the median price is now well past the 6 percent rate where housing appreciation had been trending. Even though new home sales are volatile, which reflects the report’s small sample sizes, and even though low supply will limit future gains, the outlook for housing just got a big boost. Talk will build for a greater contribution from housing to overall growth. Watch for FHFA house price data on tomorrow’s calendar where another month of solid appreciation is expected.
Nice move higher but still at very low levels:
CPI, Housing starts, Redbook retail sales, E commerce retail sales, Industrial production, NY Fed and Atlanta Fed forecasts
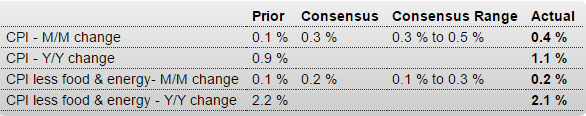
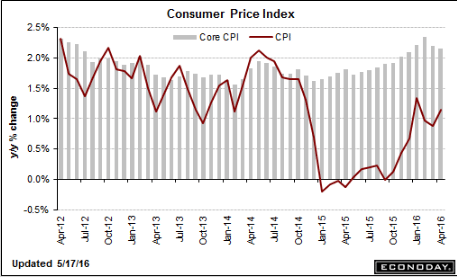
Still below the Fed’s target and ‘core’ moving down a bit year over year:
Consumer Price Index
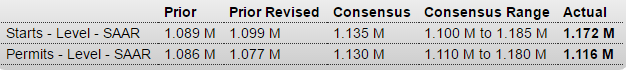
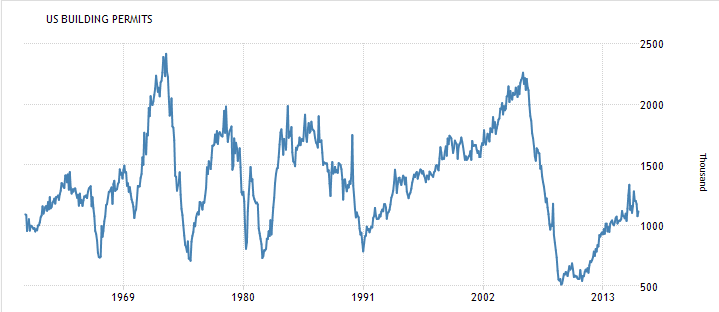
Housing starts better than expected, permits up a bit and last month’s revised down a bit.
And, of course, no house legally gets built without a prior permit and the chart isn’t looking promising:
Housing Starts
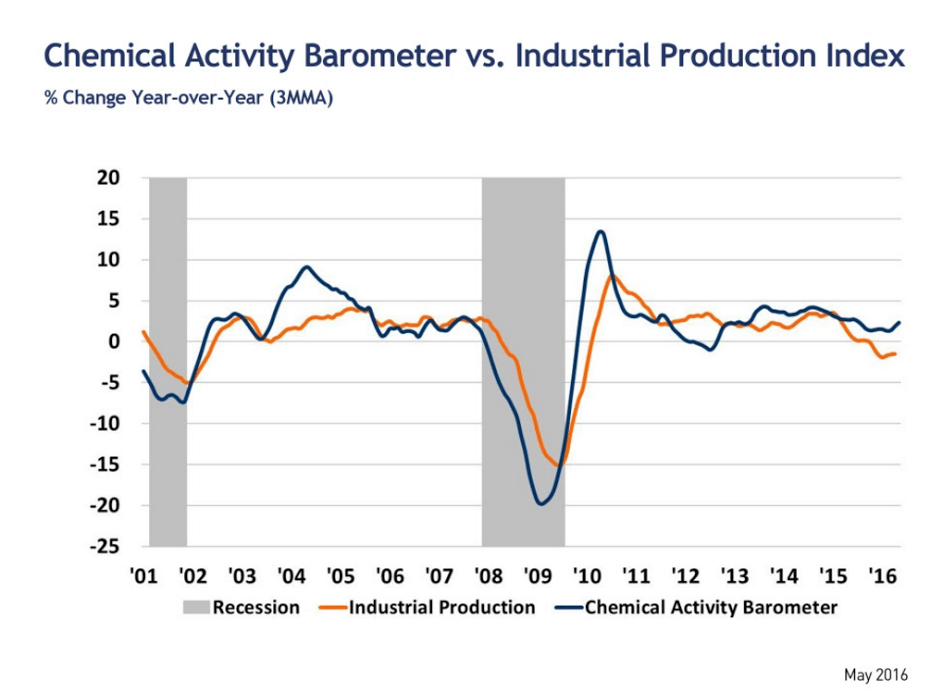
Still down and out:
And E commerce retail sales growth is working its way lower as well:
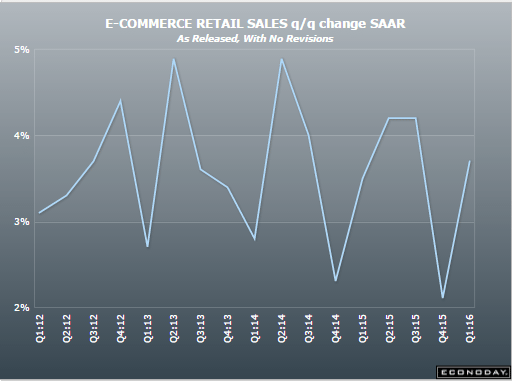
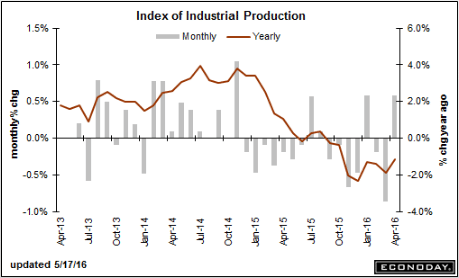
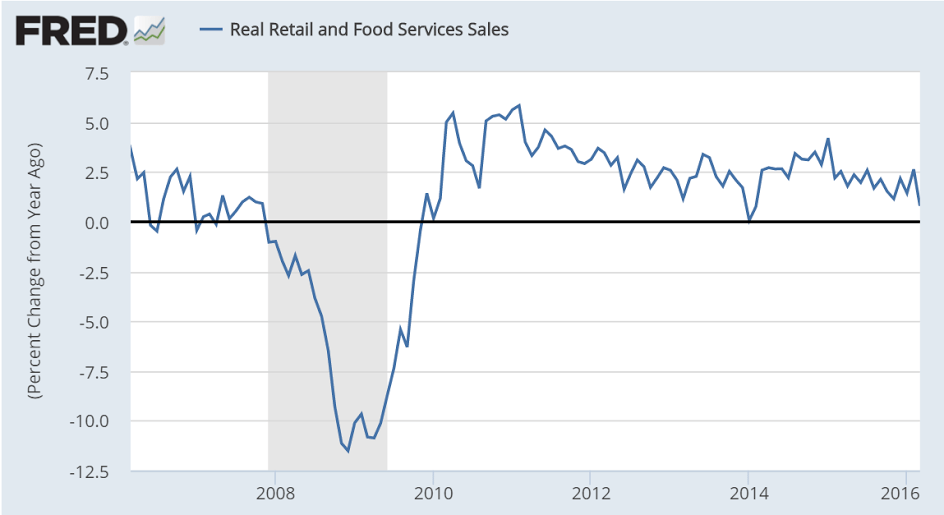
Note the % change this year vs last year chart, which takes out all the ‘seasonal’ factors, remains negative:
Industrial Production
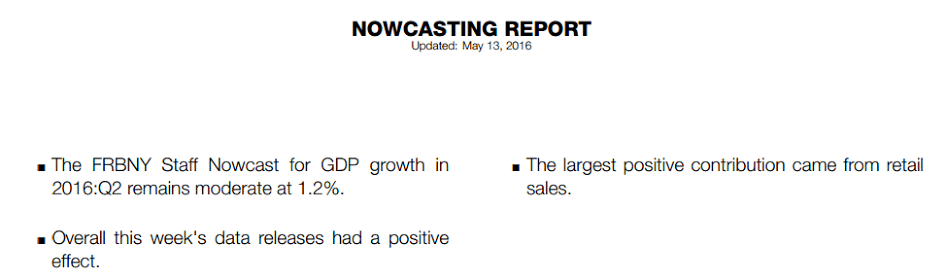
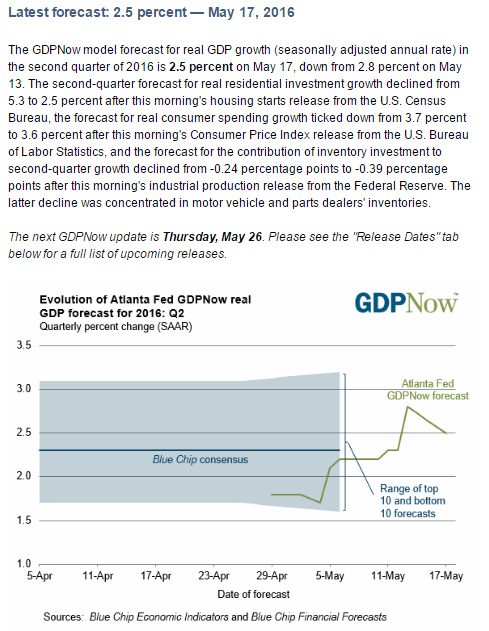
The two Feds are somewhat divergent. And I still don’t see the credit expansion required to offset savings desires:
Tax receipts, Retail sales control group, Consumer sentiment
Weak U.S. tax receipts suggest things are not so good for the U.S. consumer even as employment continues to grow, Deutsche Bank Chief U.S. Economist Joseph LaVorgna said Monday.The three-month moving average for U.S. jobs gains remains “good” at around 200,000 positions per month, but growth in tax receipts has fallen from about 6 percent a year ago to 3 percent today, LaVorgna said.”That tells me income growth is a lot weaker than what official numbers show, which would explain why consumer spending has been so soft,” he told CNBC’s “Squawk Box.”
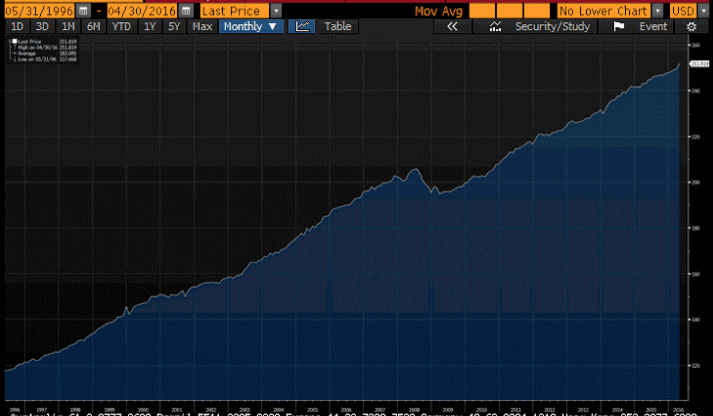
The so called ‘control group’ is retail sales minus food, auto dealers, building materials, and gas stations and used as an indication of ‘core’ consumer spending.
Note that it was growing faster before 2008, when it collapsed. And while it again has grown since 2008, the annual rate of growth has been working its way lower over time:
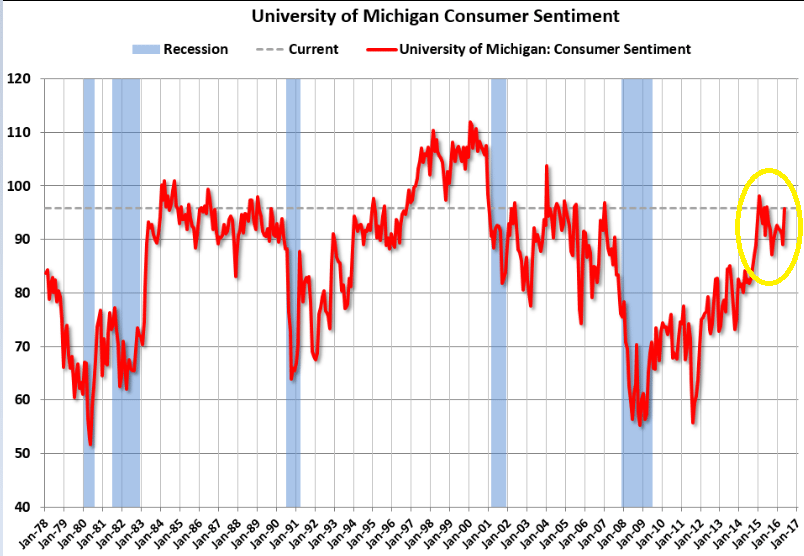
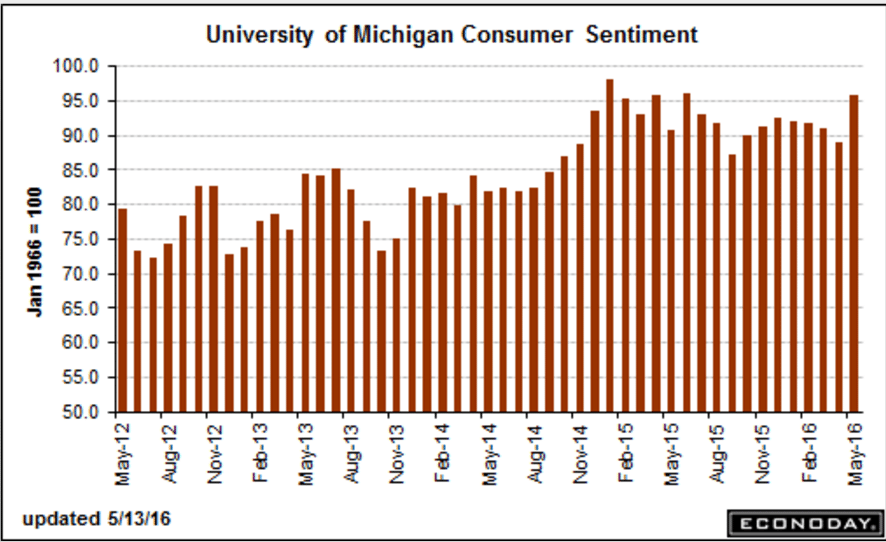
First, this survey is ‘one man one vote’ and not ‘one dollar one vote’. So when the price of gasoline collapsed even thought it was a transfer of funds, to the penny, from sellers to buyers, there were nominally many more buyers than sellers, so this survey spiked up. And the weak retail sales since the oil related capital expenditures collapsed support this narrative.
Second, even so sentiment is not all that high vs prior cycles.
Retail sales, Consumer sentiment, Euro lending, Rail week
Better than expected and some upward revisions as well.
Retail Sales
Highlights
The consumer snapped back to life in April, driving retail sales 1.3 percent higher to beat Econoday’s consensus by 4 tenths and the high estimate by 1 tenth. Gains are spread throughout most of the report.
Autos are the key component, up a sharp 3.2 percent to reverse the prior month’s decline. Excluding autos, retail sales rose 0.8 percent.
Sales at gasoline stations, boosted by higher prices, also contributed strongly, up 2.2 percent in the month. But even excluding both autos and gasoline, sales still rose 0.6 percent for the third straight gain, two of which are very strong.
Apparel was a big contributor in April along with nonstore retailers and with restaurants also showing a gain. The only component in contraction was building materials & garden equipment which hints at a little cooling for what has been very solid residential investment.
Year-on-year rates all improved though total sales remain very soft at 3.0 percent. Auto sales, pulled down by tough comparisons with very strong sales this time last year, are up only 3.1 percent on the year. But other components show strength with the ex-auto ex-gas rate at a healthy 4.4 percent for a 5 tenths gain in the month.
Today’s report points to a solid start for the second quarter and gives some life to the possibility of a June FOMC rate hike.
Notice how this has flattened (decelerated):
Welcome move back up here:
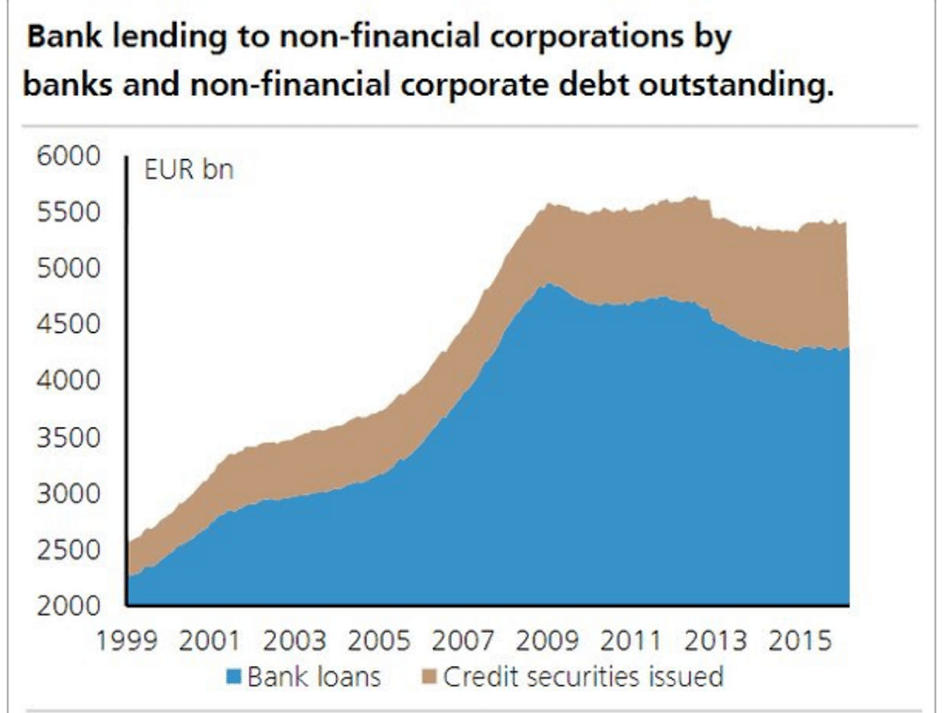
Note how in the euro area it was a sudden shortfall in private sector deficit spending that reduced aggregate demand, and has yet to recover or be ‘replaced’ by either lower taxes or more public spending:
Rail Week Ending 07 May 2016: Rail Continues To Move Deeper Into Contraction
Week 18 of 2016 shows same week total rail traffic (from same week one year ago) declined according to the Association of American Railroads (AAR) traffic data. Rolling averages continue moving deeper into contraction.
Employment report, consumer credit
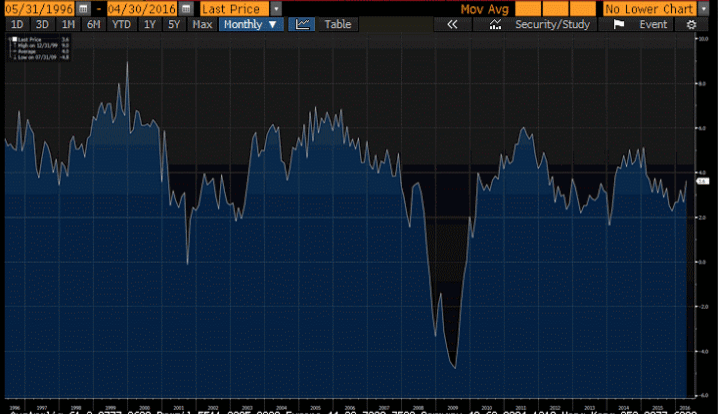
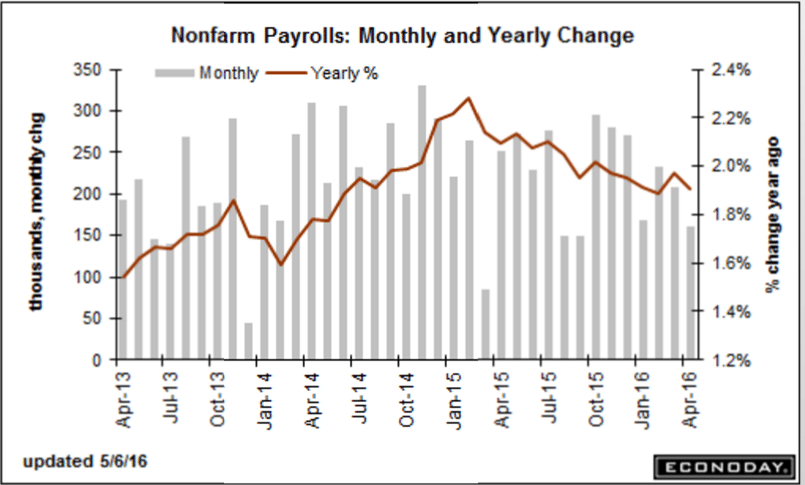
The chart shows the year over year and ongoing deceleration that in general began when oil capex collapsed.
Nor will there be a reversal until after deficit spending increases- public or private- and I see no evidence of that happening:
Employment Situation
Highlights
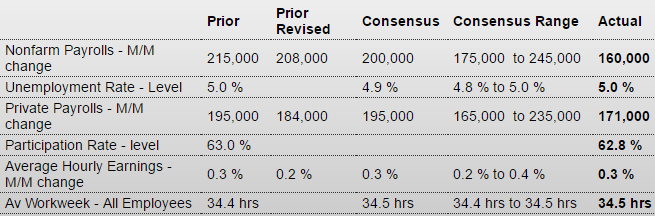
Add employment to those reports showing weakness, at least moderate weakness as nonfarm payrolls rose a lower-than-expected 160,000 in April. Revisions are minor, down a combined 19,000 in the two prior months with March now at 208,000. Government is a weak spot in April, down 11,000, with retail also showing weakness, down 3,000 after a series of outsized gains.
The unemployment rate is unchanged at 5.0 percent but the size of the labor force did fall in this reading. And the participation rate, which had been jumping, slipped 2 tenths to 62.8 percent.
Earnings are a positive, up 0.3 percent in the month with the year-on-year rate back on the climb at 2.5 percent for a 2 tenths gain. The workweek is also a positive up 1 tenth to 34.5 hours.
Turning back to industry sectors, mining extended its long trail of contraction with a 7,000 decline. But there is definitely strength especially for the closely watched professional & business services reading, up a very strong 65,000 and pointing to the need for additional permanent hiring in the months ahead. The temporary help services subcomponent of this reading is up 9,000 for a second month. Financial activities also show strength, up a very solid 20,000 with manufacturing back in the plus column but not by much with a 4,000 gain and reflecting a snap-back for the auto industry.
There’s give and take in the April data especially for labor participation which, however, is still trending higher, at least modestly. Employment is still the central strength of the economy but less so in what is less than a gangbuster opening to the second quarter. Though there’s still one more employment report to go ahead of the June FOMC, today’s report lowers whatever chances there are for a rate hike. Note that the ongoing strike by 40,000 Verizon workers do not appear to have affected April’s data.
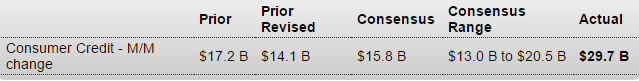
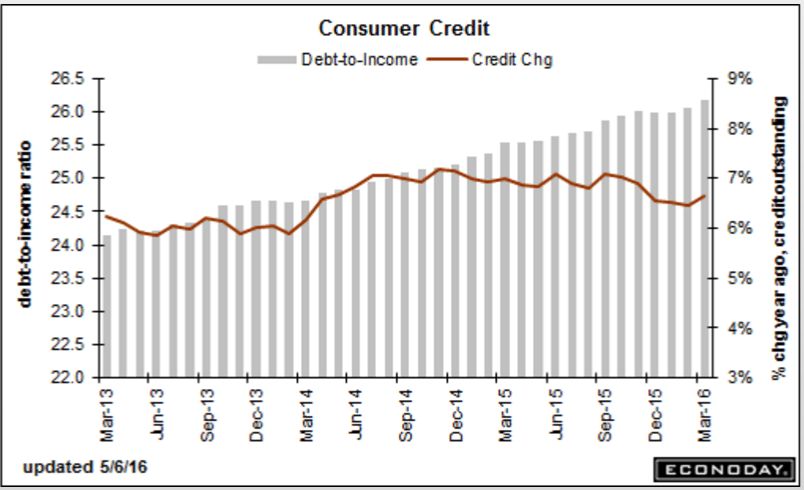
Up more than expected for the month, but the year over year didn’t move much. And note last month was revised down, so in any case best to withhold judgement regarding this series for at least a month. And a jump in borrowing can also indicate a fall off in income, particularly with retail sales growth as low as it is, with consumers borrowing to make ends meet. And check out how the debt to income level, also shown on the chart, continues to rise:
Consumer Credit
Highlights
The consumer may be showing limited enthusiasm for spending but certainly was borrowing in March. Consumer credit rose $29.7 billion in a surge that makes up for several months of prior weakness and includes a very strong $11.1 billion gain for revolving credit, indicating less reluctance to run up credit cards. Non-revolving credit rose $18.6 billion and once again reflects student loans and vehicle financing. The monthly headline is the strongest since a break in this series 5 years ago while the gain for the revolving component is the strongest since a prior break 10 years ago. The willingness to borrow hints at improved consumer confidence in the general outlook and reflects the strength of the labor market.
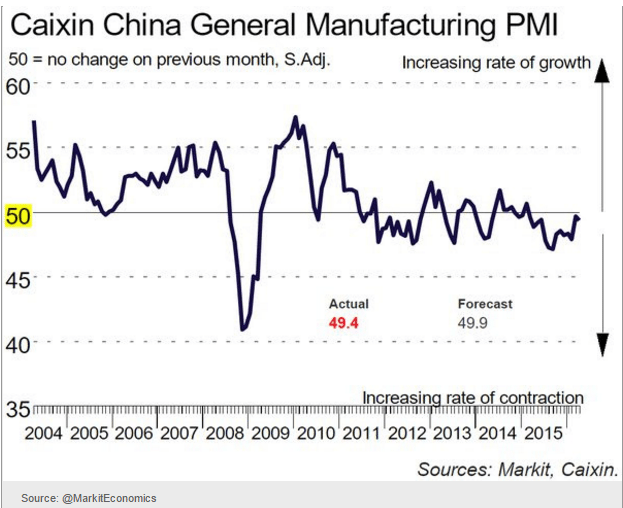
China, Redbook retail sales, UK manufacturing, yen comments
Still in negative territory:
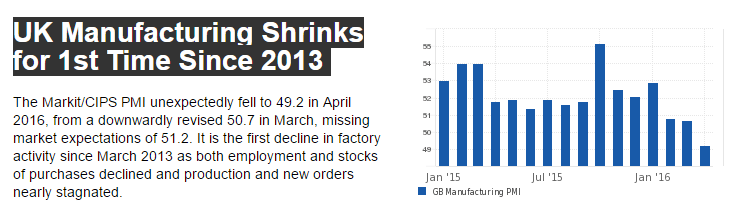
Still stone cold dead:
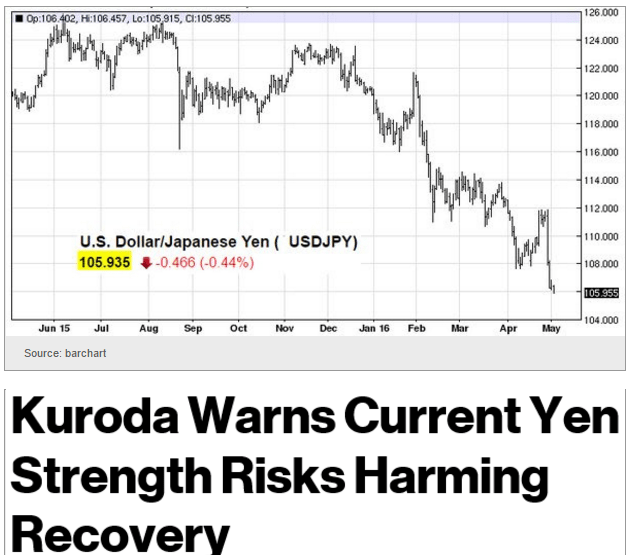
Exporters have serious clout over there.
Intervention on their behalf would be no surprise:
Japan exporters stand to take nearly $10bn hit from rising yen
The yen’s sharp appreciation threatens to undercut profits at major Japanese exporters by more than 1 trillion yen ($9.37 billion) this fiscal year, outweighing any benefits of a stronger home currency for some companies, estimates by The Nikkei show.
Even at exchange rates of 110 yen to the dollar and 125 yen to the euro — levels on which many companies are basing their fiscal 2016 earnings estimates — 25 of the country’s biggest exporters, including Toyota Motor and Komatsu, would see their combined operating profits fall 1.14 trillion yen on the year owing to currency movements alone.