Rail traffic, Philly Fed state index, NY Fed nowcast

Rail Week Ending 17 September 2016: Data Looks Better This Week

Week 37 of 2016 shows same week total rail traffic (from same week one year ago) contracted according to the Association of American Railroads (AAR) traffic data. However, the data was an improvement over last week.

Not looking so good:
92501

This one’s coming down as well:

September 23, 2016: Highlights

  • The FRBNY Staff Nowcast stands at 2.3% and 1.2% for 2016:Q3 and 2016:Q4, respectively.
  • Negative news since the report was last published two weeks ago pushed the nowcast down 0.5 percentage point for both Q3 and Q4.
  • The largest negative contributions over the last two weeks came from manufacturing, retail sales, and housing and construction data.
  • Housing market index, Redbook retail sales, Housing starts

    Up a bit, but until permits increase not much chance of home building increasing:

    92001
    92002

    Been going from bad to worse:

    Highlights

    Redbook’s sample is not pointing to any September improvement for core retail sales. Year-on-year same-store sales rose only 0.2 percent in the September 17 week, about in line with August and noticeably lower than July — two months when the government’s ex-auto ex-gas reading posted 0.1 percent monthly declines. Rates in this report don’t always match those in actual government data which focuses our attention on trends, and the trend for this report is not favorable.

    92003

    Down for reasons previously discussed, and new permits are down as well:

    92004

    92005

    92006

    92007

    Retail Sales, Industrial production, Inventories, Empire survey, Phili Fed survey, Atlanta Fed

    The slow motion train wreck that began in late 2014 with the collapse of oil capex continues unabated, with no sign of reversal that I can detect, and the annual rate of growth is consistent with prior recessions:

    91501

    Highlights

    After spending heavily in the second quarter, the consumer has stepped back so far in the third quarter. Retail sales, after inching up a revised 0.1 percent in July, fell 0.3 percent in August and do not just reflect expected weakness in auto sales. Excluding autos, sales slipped 0.1 percent while excluding both autos and gasoline, which is an important core reading, sales also fell 0.1 percent which is the second straight decline.

    Details show special weakness for building materials and garden equipment, down 1.4 percent for what is also a second straight decline. This specific reading will lower estimates for the residential investment component of the third quarter GDP report. Non-store retailers, which were flying high in prior months, fell 0.3 percent to underscore the month’s disappointment. Motor vehicles fell 0.9 percent in the month though this does follow a 1.7 percent gain in July.

    This report puts the backs of the policy hawks at the Fed to the wall, confirming other signs that the third quarter may not prove that strong after all.

    91502
    Industrial production tells much the same story. And watch for auto production to decline next month in line with falling sales:

    91503

    Highlights

    There was some life in the factory sector during July but it proved brief, at least for production. Held down by a 0.4 percent decline in the manufacturing component, industrial production also fell 0.4 percent in data for August. But motor vehicles continue to be a plus in the report, rising 0.5 percent and offsetting a 0.5 percent decline in hi-tech production.

    And mining is an increasing plus in the report, emerging from deep weakness with a second straight gain and a solid one at plus 1.0 percent. Utility production, which had up in prior months, fell back 1.4 percent in August. Total capacity utilization edged 4 tenths lower to 75.5 percent.

    This report isn’t as weak as the headline readings suggest but, given weakness in other data including this morning’s Philly Fed and Empire State reports, won’t build much confidence that the factory sector will contribute much to the nation’s third-quarter growth.

    91504
    So far the expected boost to GDP from inventory building isn’t happening. Probably because, as previously discussed, sales are falling just about as fast as inventories, as the inventory to sales ratio remains elevated:

    91505

    Highlights

    Inventories were unchanged in lagging data for July while sales retreated 0.2 percent. The stock-to-sales ratio was unchanged at 1.39. Retail inventories fell 0.3 percent with auto inventories down 0.2 percent. Wholesale inventories were unchanged in July while inventories at manufacturers, a sector where demand is soft, edged up 0.1 percent.

    An outright drop in inventory investment subtracted almost 1.3 percentage points from second quarter GDP growth — the largest drag in more than two years. Inventories have weighed on GDP growth since the second quarter of 2015. Expectations are for inventory accumulation to rebound in the third quarter adding to GDP growth.

    91506

    91507

    Highlights

    The Empire State report, like the bulk of this morning’s Philly Fed report, points to continuing trouble for a factory sector that is being held down by weakness in exports and weakness in business investment. September’s headline came in at minus 1.99 for a second straight contractionary reading. New orders are even more negative at minus 7.45 with unfilled orders at minus 11.61. Employment is in deep contraction, at minus 14.29, as is the workweek at minus 11.61 (same as unfilled orders). Input costs do show some pressure but not selling prices which are flat. Watch later this morning for industrial production which will cover the month of August.

    In this particular survey the headline number doesn’t add up to the individual categories:

    91508

    Highlights

    The headline and the details of the Philly Fed report continue to take their own paths, once again showing strength at the headline level, at plus 12.8 in September, and weakness elsewhere. New orders did move into the plus column, to 1.4 vs August’s minus 7.2, but the gain is marginal. And unfilled orders remain very weak at minus 10.8. Shipments are in contraction this month, at minus 8.8, with employment at minus 5.3. Price data show some pressure for inputs but less for selling prices. This report, outside the headline, matches the weakness of the Empire State also released this morning. The nation’s factory sector seems to be dead in the water.

    Working it’s way lower as actual data is released, as previously discussed:

    91509

    Atlanta Fed and GDP commentary

    As previously discussed, this ‘nowcast’ is working its way lower as more data is released, much like it did last quarter. Still to come are weaker retail sales due to weakening car sales, weaker residential investment due to weakening housing permits, more inventory reductions due to weaker sales, and generally weaker consumption as employment growth continues to decelerate. And I also suspect the trade deficit to resume it’s climb as exports continue to weaken and the import bill increases:
    90901
    Note the progression of the q1 and q2 nowcasts:

    90902

    90903
    Rick Davis commentary on the Q2 GDP report:

  • As mentioned above, real per-capita annual disposable income was revised upward $101 in this report (and is now up $151 from the prior quarter), and the household savings rates was also revised upward. Although the household savings rate was revised upward in this report, it is still down from the prior quarter — and most of the increased quarter-to-quarter consumer spending came from that decreased savings rate. It remains important to keep this line item in perspective. Real per-capita annual disposable income is up only +6.32% in aggregate since the second quarter of 2008 — a meager annualized +0.77% growth rate over the past 32 quarters.
    1. The key items in this report:
  • All things not consumer either weakened or remained in contraction.
  • Consumer spending growth improved yet again, with most of that coming from savings.
  • All of the reported growth disappears when a third party deflator (the BLS CPI-U) is applied to the data.
  • Note that the consumption numbers outlined tend to revert:

    90904
    Consumption, like most everything else, has been decelerating ever since the collapse in oil related capital expenditures at the end of 2014, and is already very low vs prior cycles. And, at least so far, I have no reason to expect this general deceleration not to continue:

    90905

    Vehicle sales

    Not good. Pronounced slowdown. Negative contribution to growth:

    Based on a preliminary estimate from WardsAuto (ex-Porsche), light vehicle sales were at a 16.89 million SAAR in August.

    That is down about 5% from August 2015, and down 5.0% from the 17.77 million annual sales rate last month.

    Read more at http://www.calculatedriskblog.com/#Zf1iZ5B4Y5kxSm5C.99

    Highlights

    The bulk of August’s sales data is out and vehicle sales are running below July, roughly in the low 13 million annualized area for North American-made models vs 14.3 million in July. Though sales levels remain solid, the decline from July points to trouble for the August retail sales report. Final sales totals will be posted at day’s end.

    90107

    From 1998, Q2 GDP revision, Corporate profits, Trade, Consumer sentiment

    Something I wrote that got published in 1998:

    82608
    Revised down, note how the year over year growth has been continuously decelerating ever since the collapse of oil capex, and the strength in consumer spending looks like it could be about healthcare premiumus, which portends cutbacks elsewhere, hence the weaker q3 retail sales, etc. And with inventories still looking way too high, proactive inventory building doesn’t seem likely. Nor does the most recent housing data bode well for housing in q3:

    82609

    Highlights

    Second-quarter GDP proved very soft, at only a plus 1.1 percent annualized rate for the second estimate following even softer rates in the prior two quarters of 0.8 and 0.9 percent. But masked in the latest quarter is a very strong 4.4 percent annualized growth rate for consumer spending which is 2 tenths higher than the first estimate. Inventory draw is the quarter’s culprit, pulling down GDP by a very steep 1.3 percentage points. But, in a counter-intuitive twist, lighter inventory in times of slow economic growth is a major positive for future production and employment and is a major plus for the ongoing quarter.

    Residential investment is a disappointment in the second-quarter data, falling at a 7.7 percent annualized rate but following large gains in prior quarters. And building strength in new home sales points to a rebound for this reading in the third quarter. The biggest disappointment in the quarter is another decline, at a 0.9 percent rate, in nonresidential fixed business investment which points to business caution and continuing problems ahead for worker productivity. Price data show some pressure tied to oil with the GDP price index up 1 tenth from the first estimate to a year-on-year 2.3 percent.

    The major takeaway from the second quarter is not the headline growth rate but the strength of the consumer, evident in the solid 2.4 percent rise in final sales, which is double the pace of the two prior quarters. The early outlook for the third quarter is positive, with estimates trending at about 3 percent growth.

    82610
    This one’s the contribution to PCE from July 29 data:

    82611
    This is the contribution to GDP from today’s data:

    82612
    Decelerating year over year:

    82613
    Not quite as bad but still negative:

    82614

    United States Corporate Profits

    Corporate profits in the United States decreased by 2.4 percent or $36.3 billion to $1469.7 billion in the second quarter of 2016, after rising an upwardly revised 8.1 percent in the previous period, preliminary estimates showed. Dividends decreased 0.9 percent or $8.2 billion in the second quarter (compared to a gain of 0.8 percent or $7.3 billion in Q1) and undistributed profits dropped 5.2 percent or $28.1 billion (compared to a rise of 24.3 percent or $106.1 billion in Q1). Also, net cash flow with inventory valuation adjustment, the internal funds available to corporations for investment, fell 1.1 percent or $22 billion, after going up by 5.7 percent or $112.7 billion in the previous period.

    82615
    82616

    Highlights

    A surge in food exports helped cut the nation’s goods gap in July to $59.3 billion from June’s revised $64.5 billion. Exports of foods, feeds & beverages rose 31 percent in the month though export prices of agricultural goods actually dipped slightly in the month. Other export readings are less favorable including a decline for capital goods, reflecting weak global investment in new equipment, and a small dip for consumer goods. A dip in imports also helped narrow the headline gap in July as capital goods imports and especially consumer goods imports fell sharply. The improvement in today’s headline is a big plus for early third-quarter GDP estimates but it doesn’t point to strength in underlying cross-border demand.

    Looks like inventories continue to decline which doesn’t bode well for current output, as previously discussed:

    82617

    Highlights

    Wholesales inventories are unchanged in the preliminary reading for July following a 0.2 percent build in June. Retail inventories fell 0.4 percent in July vs a 0.3 percent build in June. These results point to the need for inventory rebuilding and are a positive for the economic outlook.

    Less than expected and declining, with the move up 4 months ago now completely reversed:

    82618

    Highlights

    Consumer sentiment is steady and respectable, at 89.8 for the final August reading and a 6 tenths dip from mid-month and a 2 tenths dip from final July. The expectations component edged higher in the month to 78.7 which hints at confidence in the jobs outlook. Hinting at marginal softening in the current jobs market is the current conditions index which is down 2.0 points to a still solid 107.0. Inflation readings are especially weak in this report, reflecting in part this month’s downturn in gasoline prices. One-year expectations are down 2 tenths to 2.5 percent with the 5-year outlook down 1 tenth and also at 2.5 percent.

    81619

    Redbook retail sales, PMI, Richmond Fed, New home sales

    Still extremely depressed:
    8-23-1
    Down and well below expectations:

    8-23-2

    Highlights
    Weakness in orders and employment were unfortunate themes of last week’s Empire State and Philly Fed reports and likewise headline the manufacturing PMI report. The PMI, which is based on a nationwide sample of manufacturers, slowed by 8 tenths in the August flash to 52.1, a reading only modestly above breakeven 50 to indicate no more than limited expansion in composite activity.

    Output is the month’s best strength but one that won’t last very long if orders remain soft. The sample is cutting back on inventories this month which, like the slowing in employment, hints at caution over the business outlook. Price trends are stagnant in yet another sign of softness in demand. One positive in the report is strength in export orders which, after a long run of weak readings, is suddenly near a 2-year high.

    Exports aside, the strength in this report is limited and does not point to second-half strength for manufacturing.

    8-23-3
    Bad:

    8-23-4
    Strong sales, higher than expected, but in any case no homes get built or sold without permits which remain weak, so expect ‘corrections’ with future releases:

    8-23-6
    8-23-5

    CPI, Housing starts, Redbook retail sales, Industrial production, Euro area trade balance

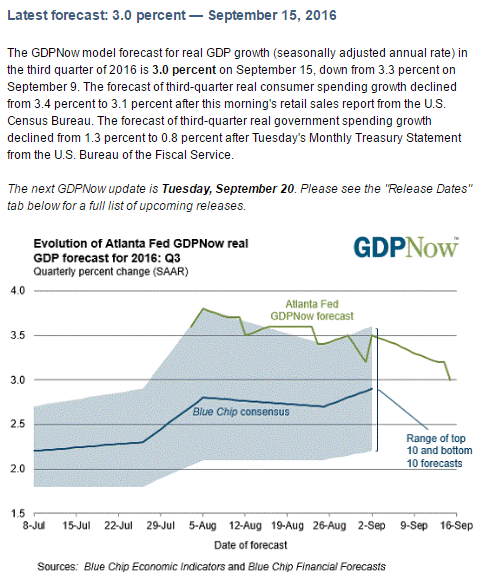
    Lots of nuances but still tending to keep the Fed on hold:
    8-16-1

    Highlights
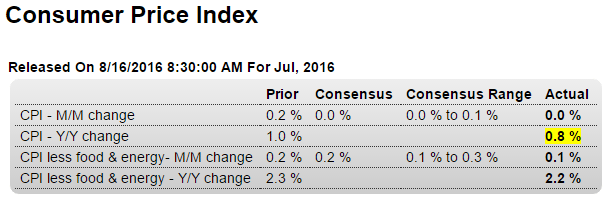
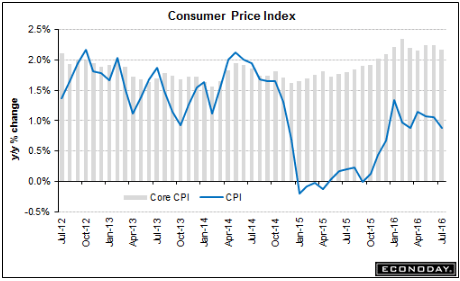
    The headlines for the consumer price report look very soft but there are important offsetting pressures. The CPI came in unchanged in July, pulled back by a 1.6 percent monthly decline in energy prices and other weakness including flat prices for food and contraction in transportation. And it doesn’t look much better when excluding food & energy where the gain for the core is only 0.1 percent.

    But two important categories — medical and housing — both show life. Medical care prices jumped 0.5 percent in the month for a year-on-year rate that leads the major readings, at a downright inflationary 4.0 percent. Housing costs rose 0.3 percent in the month with this year-on-year at 2.4 percent which, next to medical care, is the second highest on the list.

    Total year-on-year prices are up only 0.8 percent with the closely watched core dipping 1 tenth to 2.2 percent. But the decline in energy and transportation can very well reverse quickly as could the lack of pressure in food prices. But medical and housing costs are a core of their own and should give policy makers confidence that their efforts to lift inflation are making incremental progress.

    8-16-2
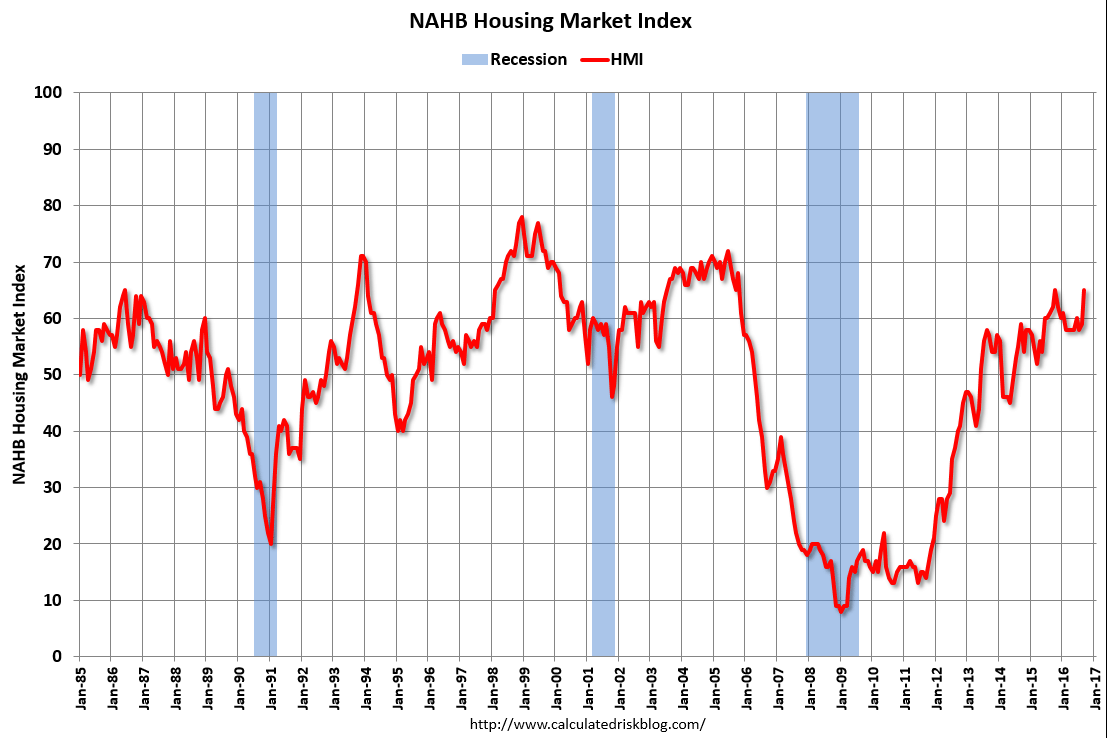
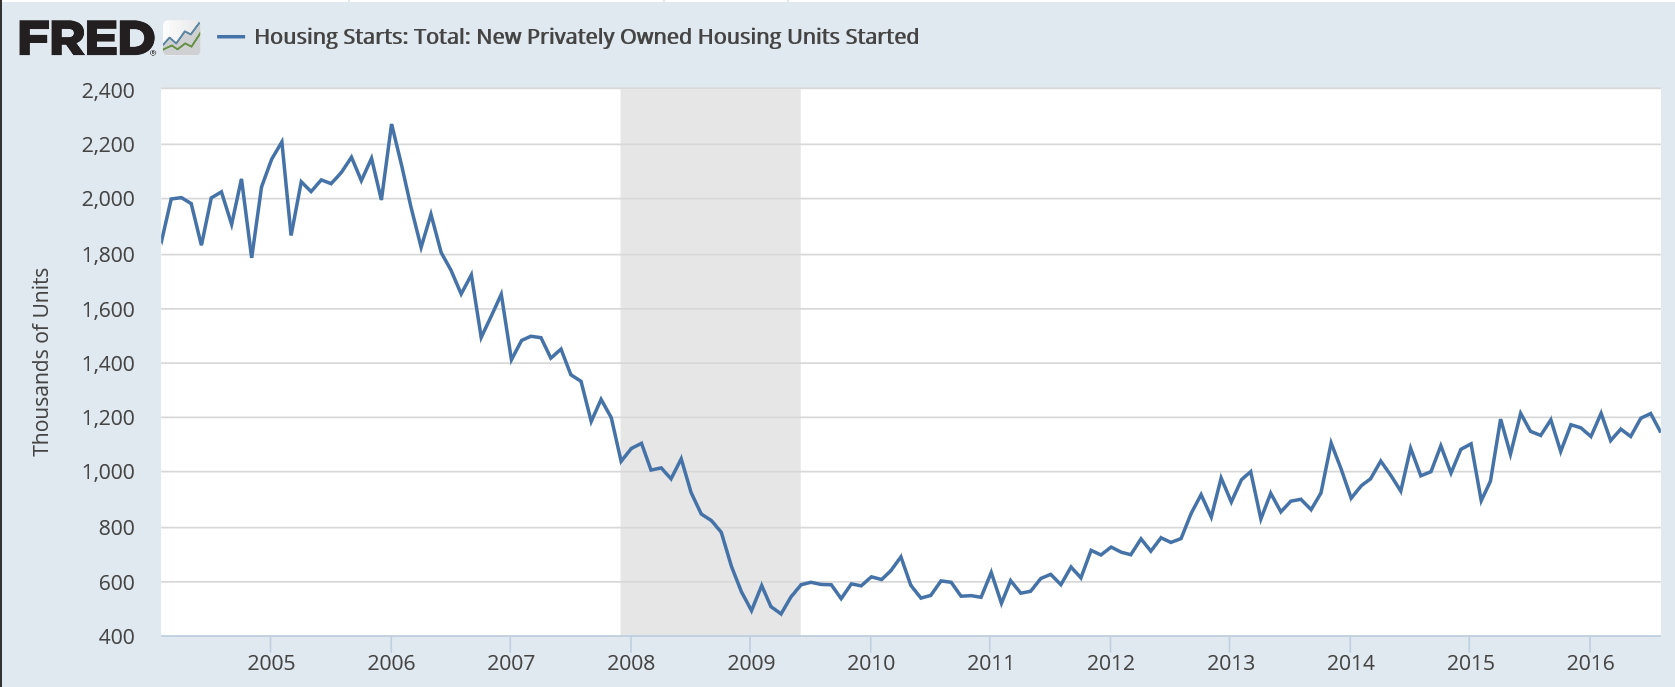
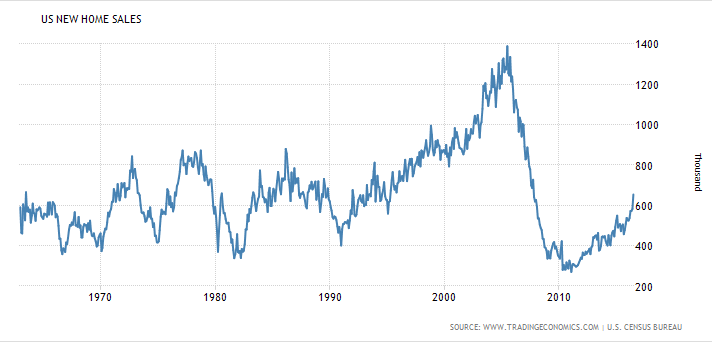
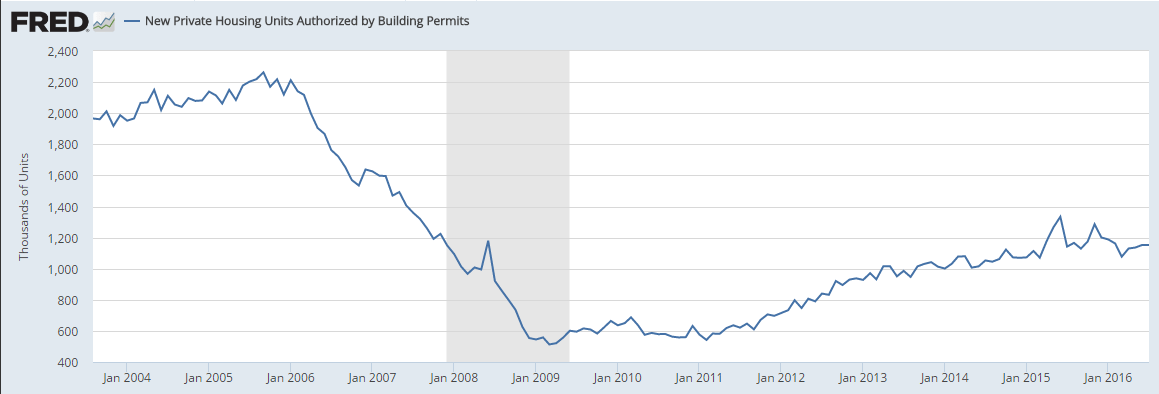
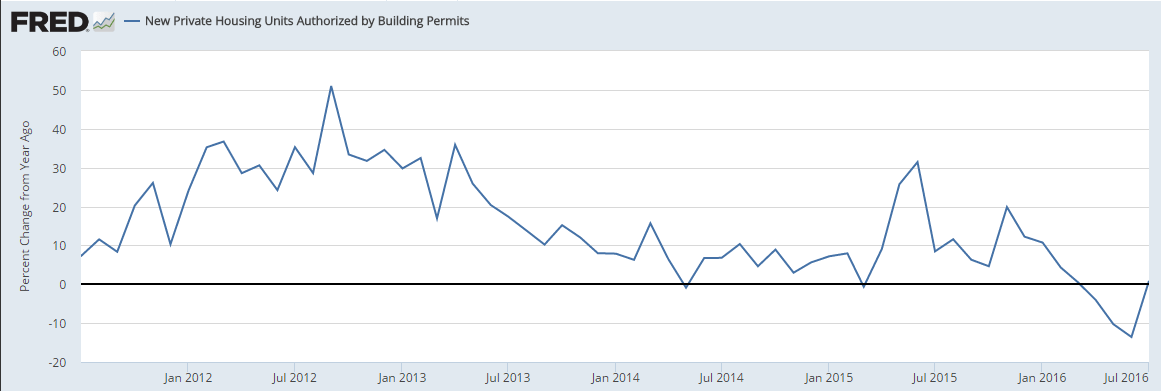
    Starts better than expected but permits down and looking very weak. And as you don’t build a house without a permit, not looking good for starts for the rest of q3:

    8-16-3

    Highlights
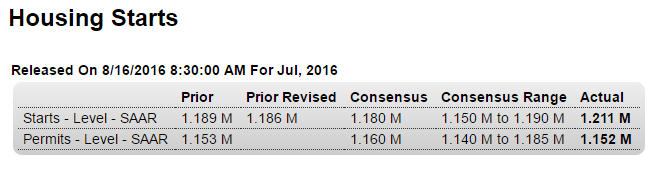
    Housing starts are strong but permits are flat in what are mixed indications for the nation’s housing sector. July starts rose a strong 2.1 percent to a 1.211 million annualized rate which comes on top of June’s 5.6 percent surge. Starts for single-family homes, the most important category, rose a very respectable 0.5 percent in July but were dwarfed by a 5.0 percent surge for multi-family homes. These results point to ongoing strength for construction.

    But there may be less strength ahead based on permits which show little change, at a 1.152 million rate in July. Here the single-family reading is down 3.7 percent, offset by a jump in multi-family permits of 6.3 percent. But single-family homes are costlier to build and the decline in permits here is a major offset to the gain for multi-family units.

    The housing sector is a positive for this year’s economy though it’s performance continues to be less than smooth.
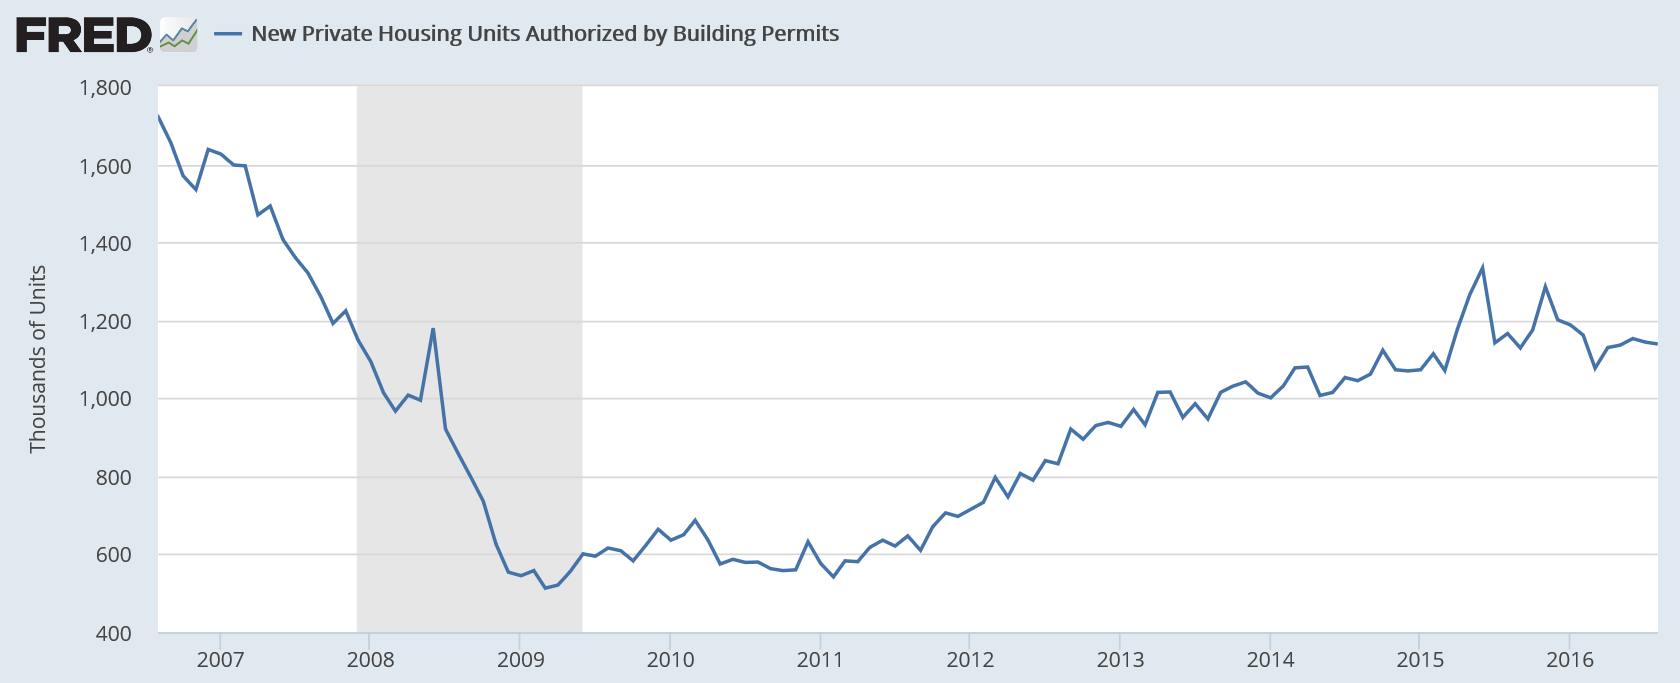
    Building Permits:
    Privately-owned housing units authorized by building permits in July were at a seasonally adjusted annual rate of 1,152,000. This is 0.1 percent below the revised June rate of 1,153,000, but is 0.9 percent above the July 2015 estimate of 1,142,000.

    Read more at http://www.calculatedriskblog.com/#WoS6ZvcHVCFmJYeR.99

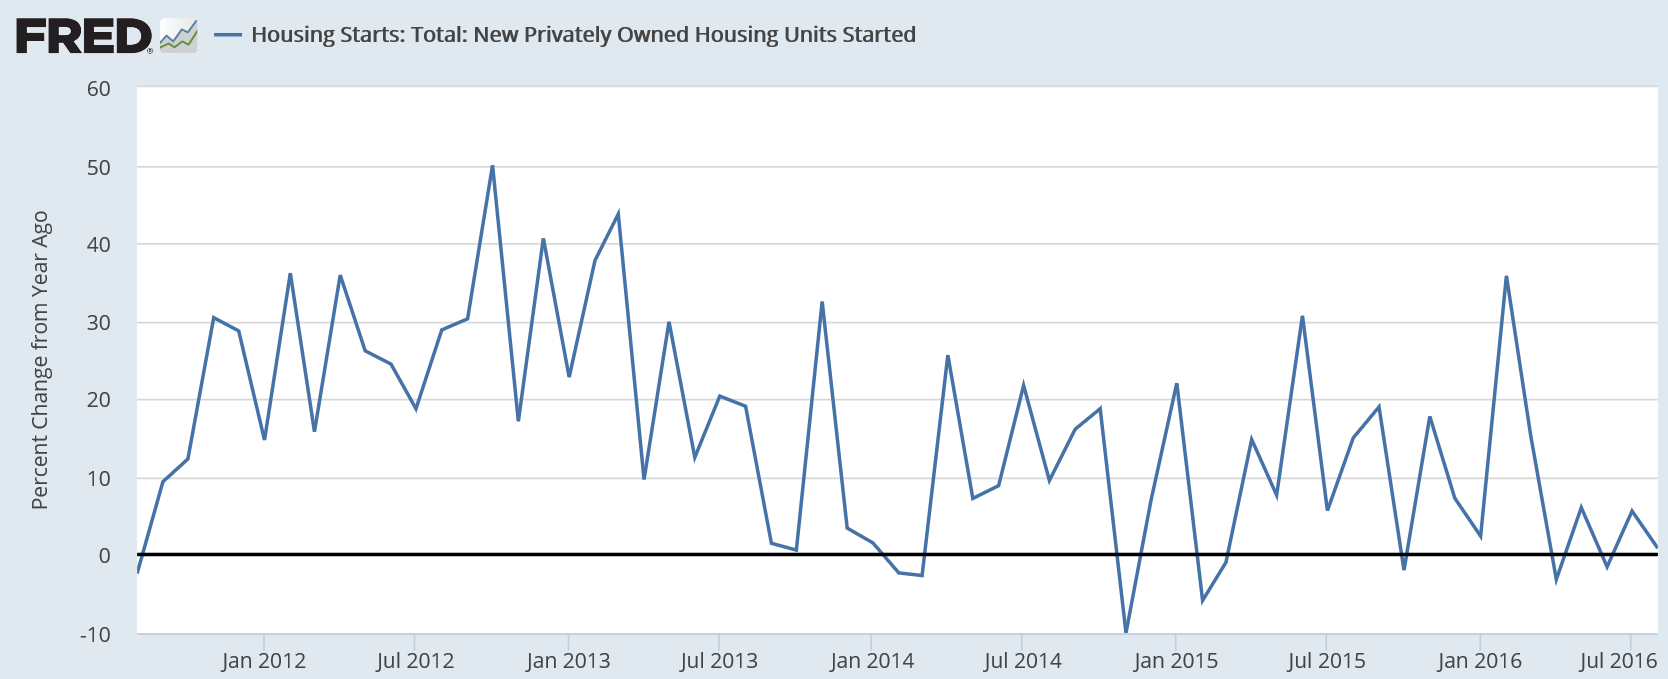
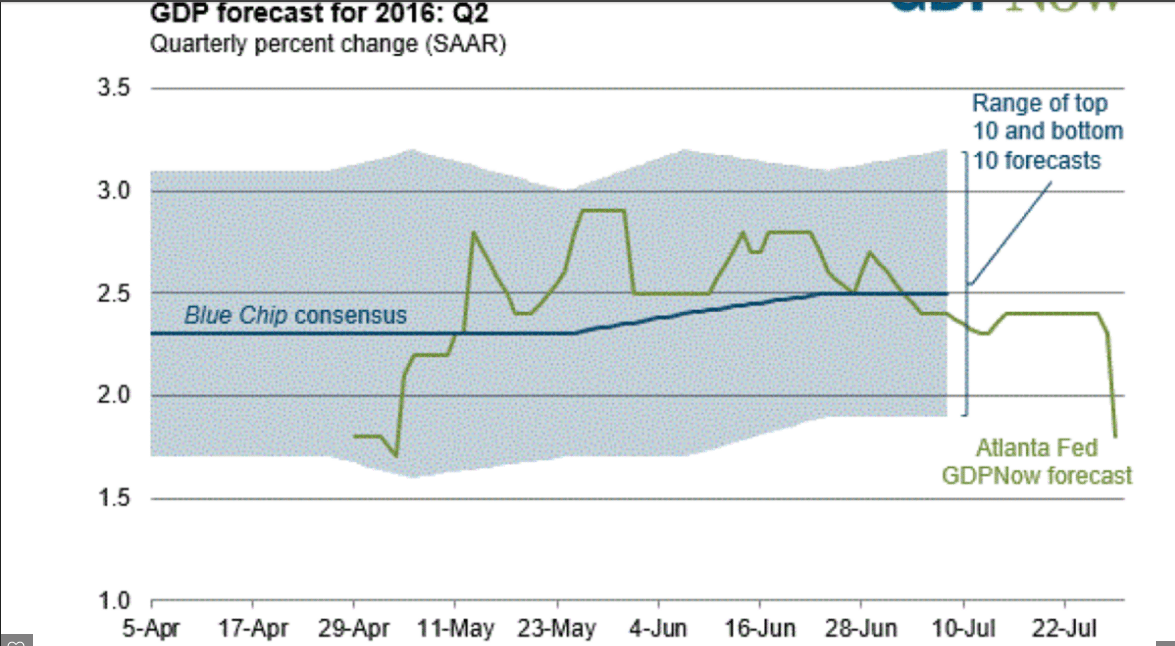
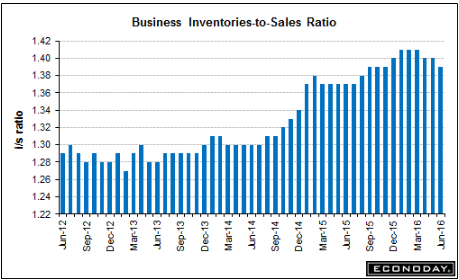
    Looking like housing will add little if any to growth this year:

    8-16-4

    8-16-5
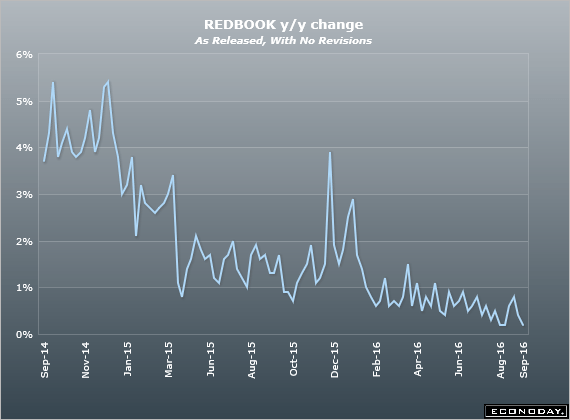
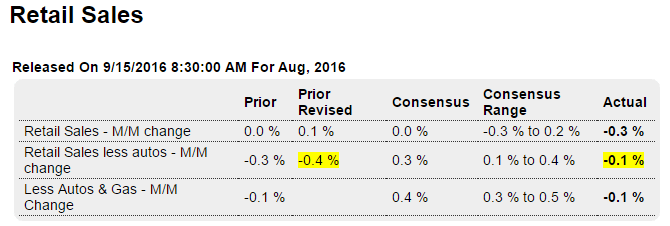
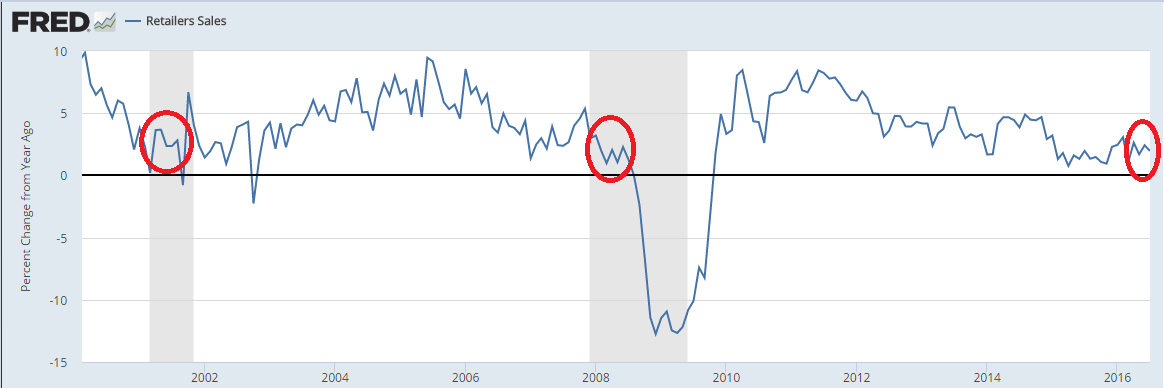
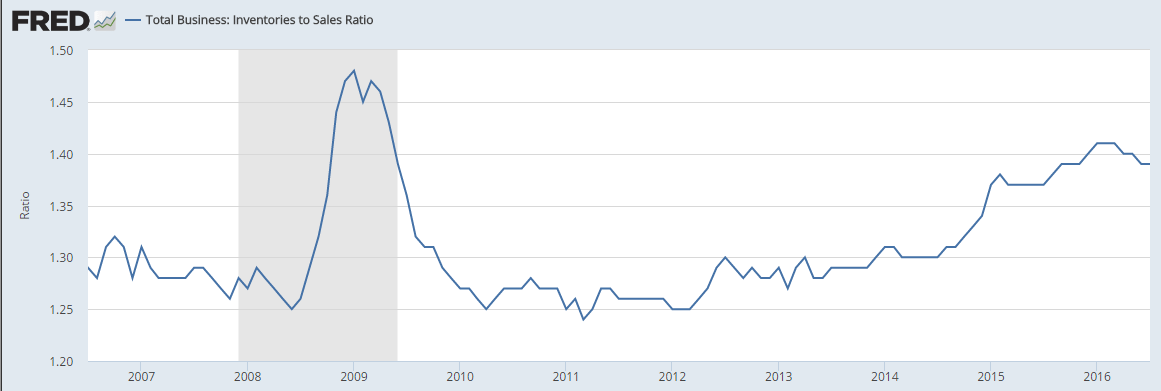
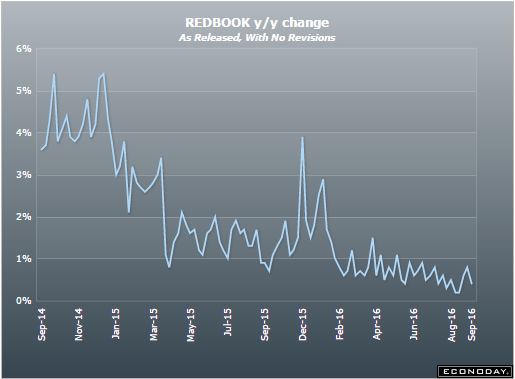
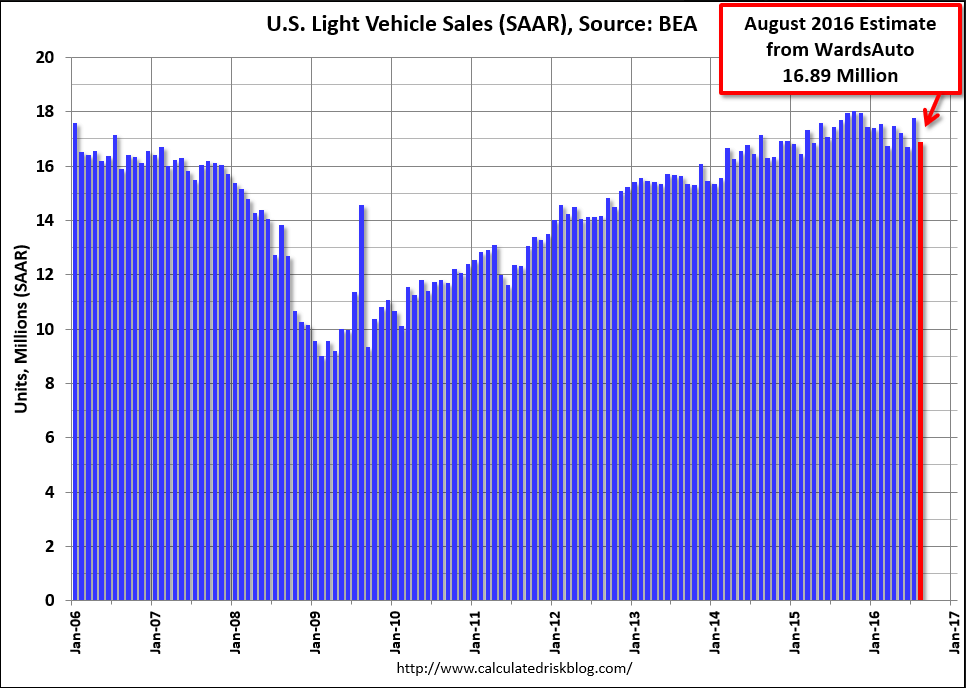
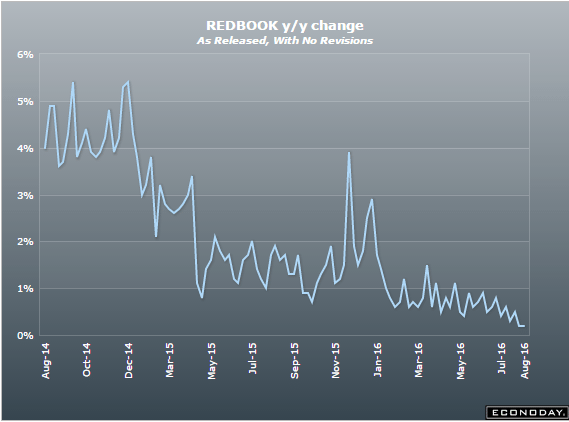
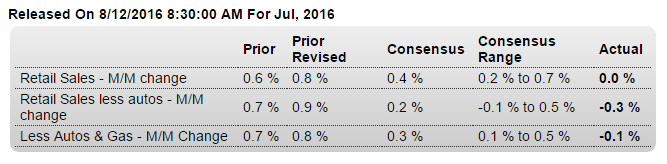
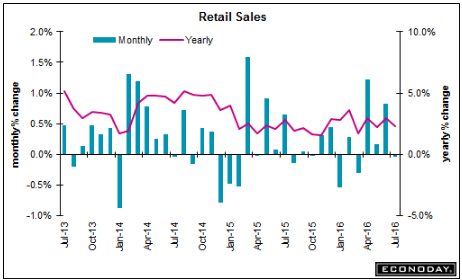
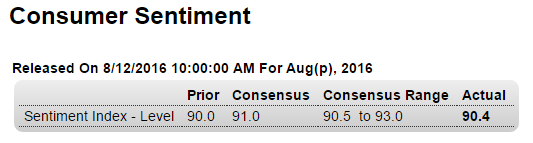
    Just another indication of weak retail sales:

    8-16-6
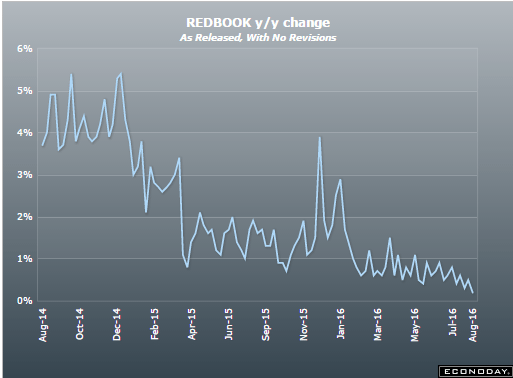
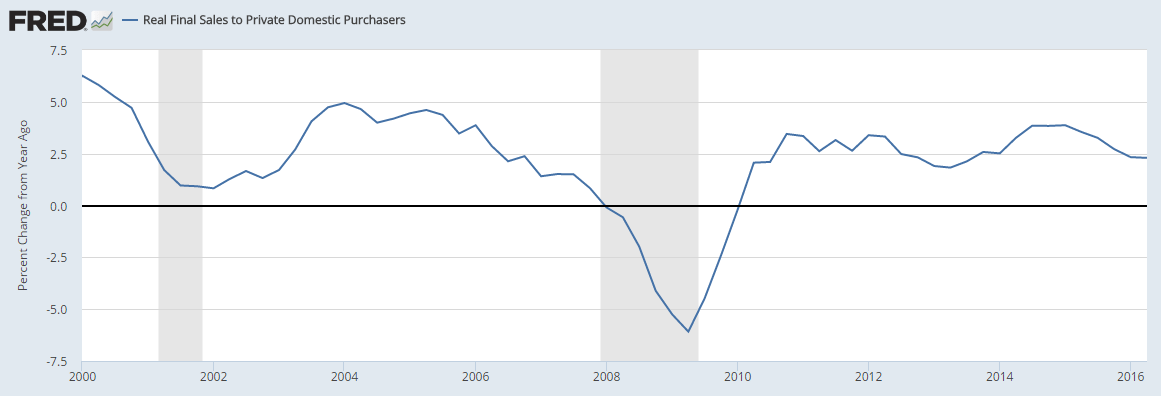
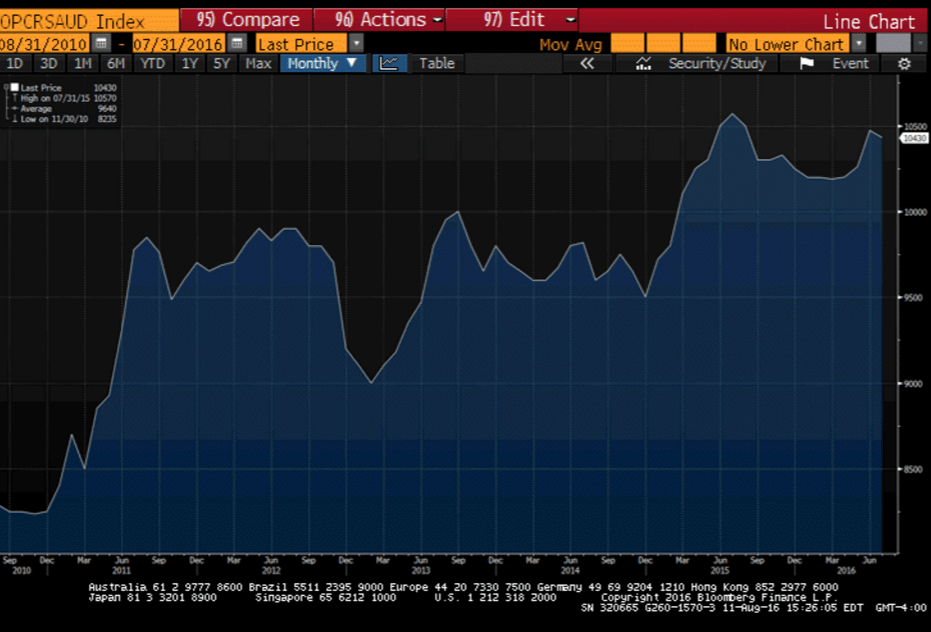
    Up more than expected (due to in part to added air conditioning usage) but last month’s ‘good’ number revised down, so best to reserve judgement on this month’s number. And in any case, the year over year performance remains at recession type levels:
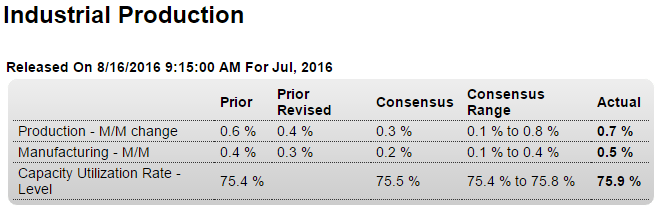
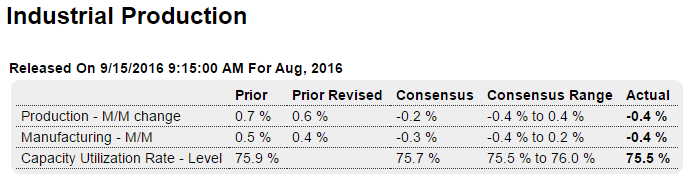
    8-16-7

    Highlights
    Strength in manufacturing leads a strong industrial production report where the July headline jumped 0.7 percent to give a big 1/2 point lift to the capacity utilization rate which is at 75.9 percent.

    Manufacturing output rose 0.5 percent in the month which follows a downward revised but still very respectable 0.3 percent gain in June. Vehicle production was exceptionally strong in June and was also very solid in July though other manufacturing industries were also strong contributors to the latest month’s gain. Hi-tech was strong in the month and a look at market groups shows 0.6 percent monthly gains for both consumer goods and business goods, the latter a plus given the persistent weakness in business investment.

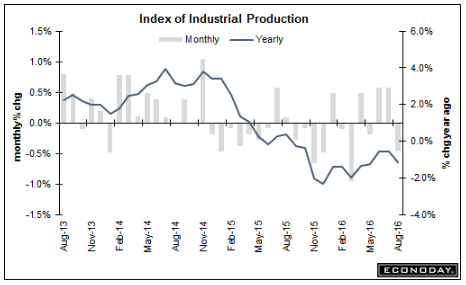
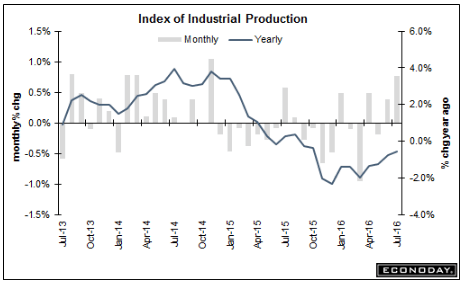
    Outside of manufacturing, utility production jumped 2.1 percent for a second straight month reflecting what has been a strong cooling season. Mining also was a positive contributor, up 0.7 percent in the month though year-on-year output here is still down in the double digits, at minus 10.2 percent.

    Though these results are very positive and point to a strong factory contribution to the ongoing economy, weakness in separate data on factory orders unfortunately is not pointing to further gains ahead for manufacturing production.

    Note that the traditional non-NAICS numbers for industrial production may differ marginally from the NAICS basis figures.

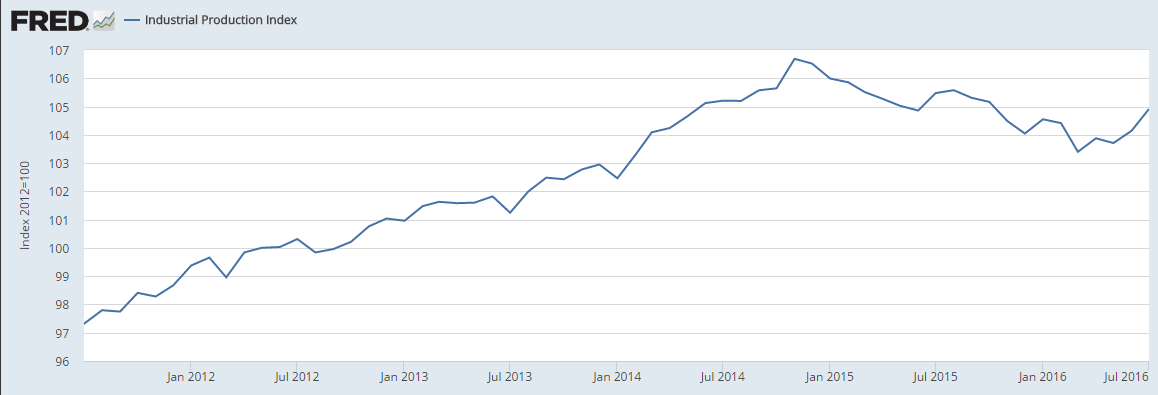
    From the Fed: Industrial production and Capacity Utilization

    Industrial production rose 0.7 percent in July after moving up 0.4 percent in June. The advance in July was the largest for the index since November 2014. Manufacturing output increased 0.5 percent in July for its largest gain since July 2015. The index for utilities rose 2.1 percent as a result of warmer-than-usual weather in July boosting demand for air conditioning. The output of mining moved up 0.7 percent; the index has increased modestly, on net, over the past three months after having fallen about 17 percent between December 2014 and April 2016. At 104.9 percent of its 2012 average, total industrial production in July was 0.5 percent lower than its year-earlier level. Capacity utilization for the industrial sector increased 0.5 percentage point in July to 75.9 percent, a rate that is 4.1 percentage points below its long-run (1972–2015) average.

    Read more at http://www.calculatedriskblog.com/#WoS6ZvcHVCFmJYeR.99

    8-16-8

    8-16-9
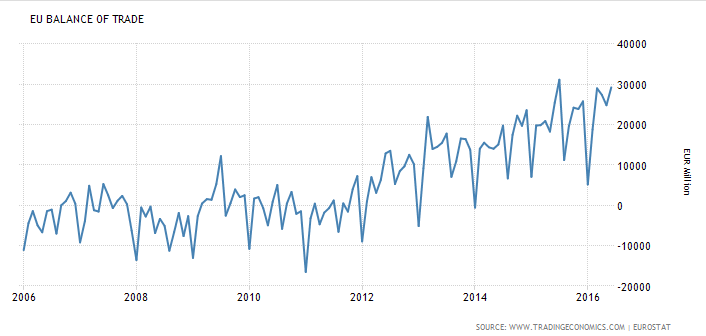
    The trade surplus offers fundamental support for the euro, even as total trade is weakening which tends to indicate weakening global demand:

    Euro Area Balance of Trade
    The trade surplus in the Euro Area increased 14.9 percent year-on-year to € 29.2 billion in June of 2016 as exports decreased 2.2 percent while imports shrank at a faster 5 percent. Figures compare with market forecasts of a € 25.8 billion surplus. It was the biggest trade surplus since July last year.

    8-16-10

    Producer prices, Retail sales, Business inventories, Consumer sentiment, Saudi output, German, Euro area GDP

    Nothing here to get the Fed concerned about inflation:

    8-12-1
    Not good, less then expected and excluding autos, a ‘core reading’ even worse. Seems to me that perhaps the higher gas prices that caused the increases over the last couple of month’s have taken their toll on other spending. And at the macro level, without an increase in either private or public deficit spending top line growth won’t be there:

    8-12-2

    Highlights
    Consumers spent their money on vehicles in July but not on much else as retail sales came in unchanged. When excluding autos, retail sales slipped 0.3 percent for the first decline in this reading since March. When excluding both autos and gasoline, the latter falling on lower prices, retail sales improve slightly but are still down 0.1 percent for the first decline since January. This core reading is telling and will likely define total consumer spending (which includes services) for the month of July.

    The big plus that saves the report is the 1.1 percent monthly surge in motor vehicle sales, one that follows a 0.5 percent gain in June. Spending elsewhere may be weak, but spending on vehicles is a signal of consumer confidence and strength. Elsewhere, positives are hard to find.

    Supermarket sales fell in the month as did building materials. Sporting goods were especially weak as were restaurant sales, the latter a discretionary category that speaks to the month’s lack of non-vehicle punch. On the plus side once again are sales at nonstore retailers which, driven by ecommerce, jumped a sizable 1.3 percent for a second straight month and follows even larger gains in prior months. Sales at gasoline stations, reflecting lower prices, swung 2.7 percent lower following a 2.2 percent gain in the prior month.

    The consumer is the driver of the economy and July’s weakness for retail sales makes for a slow start to the third quarter and will ease talk for now of a September FOMC rate hike. Upward revisions are footnotes in the report with June now at plus 0.8 percent, up 2 tenths from the initial reading which will pull GDP revision estimates for the second quarter higher.

    You can see how retail sales growth peaked when oil capex collapsed at the end of 2014,
    and that spending has yet to be ‘replaced’:

    8-12-3
    Business inventories corrected some due to what I think was a one time jump in auto sales (which remain down year over year). However inventories still look way too high to me and so the liquidation is likely to continue into q3. And note that the inventory growth began when oil capex collapsed:

    8-12-4
    This was also below expectations and doesn’t look to be recovering to prior levels:

    8-12-5

    Highlights
    Consumer sentiment is flat, at 90.4 for the August flash for only a 4 tenths gain. Components are mixed with expectations higher, at 80.3 for a 3.5 point gain, but current conditions lower, down 2.9 points to 106.1. The gain in expectations points to rising confidence in the jobs outlook but the decline in current conditions hints at a second month of slowing for consumer spending.

    This too peaked when oil capex collapsed:

    8-12-6
    Saudi oil sales have moved up a bit but are still far below their presumed output availability of 12 million bpd. So it’s still a matter of setting price, in this case via their posted discounts to benchmarks:

    8-12-8

    German GDP grows much faster than expected

    By Todd Buell

    Aug 12 (MarketWatch) — Germany’s economy grew at a much faster pace than expected in the second quarter. In quarterly adjusted terms, Europe’s largest economy and economic powerhouse grew by 0.4%. The statistics office said that growth came primarily from foreign trade. Quarterly growth in the first quarter was 0.7%.

    Euro Area GDP Growth Rate
    The Eurozone’s economy expanded 0.3 percent on quarter in the three months to June 2016 slowing from a 0.6 percent growth in the previous period and matching preliminary reading, second estimate showed. Among the largest economies of the Euro Area, GDP growth slowed in Germany and Spain; while growth in France and Italy was flat.