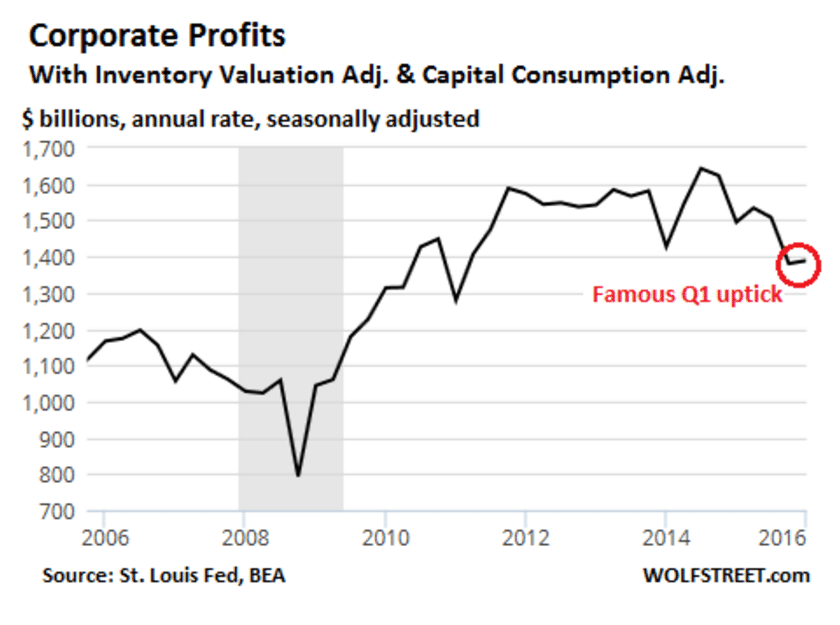
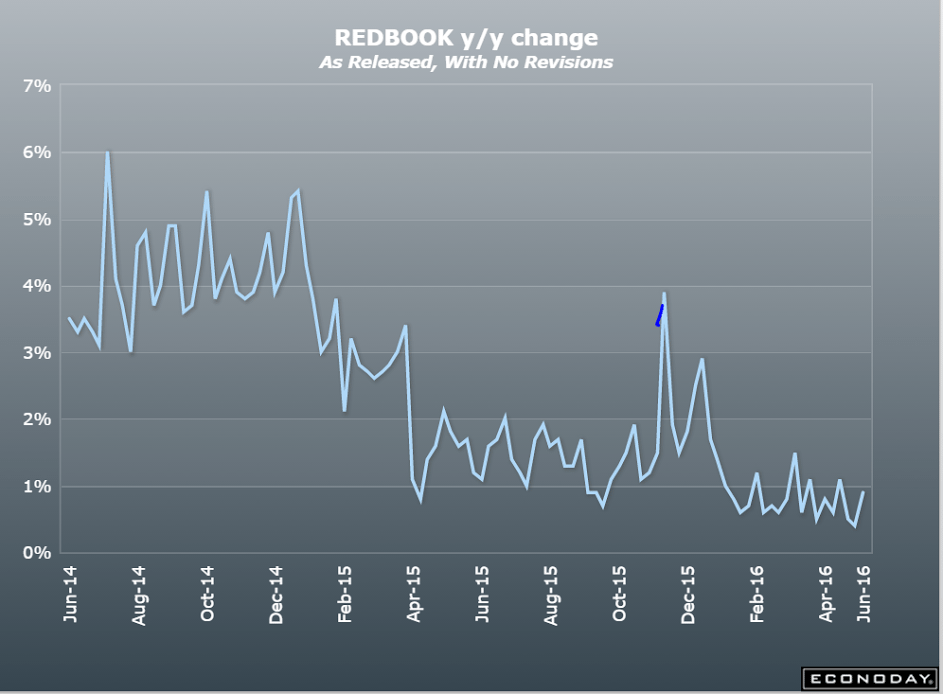
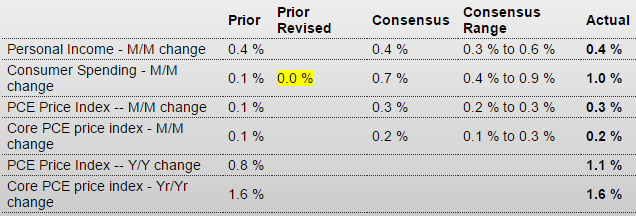
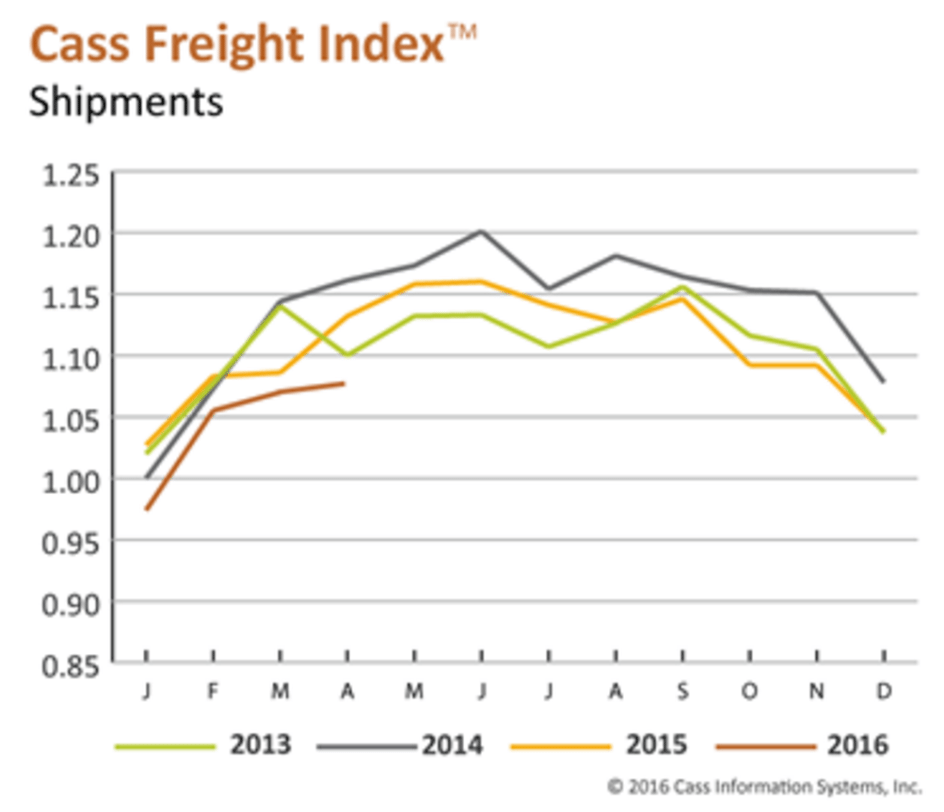
Continuing to decelerate.
As previously discussed, I see no chance of a reversal until deficit spending- public or private- picks up to offset the unspent income/savings desires:
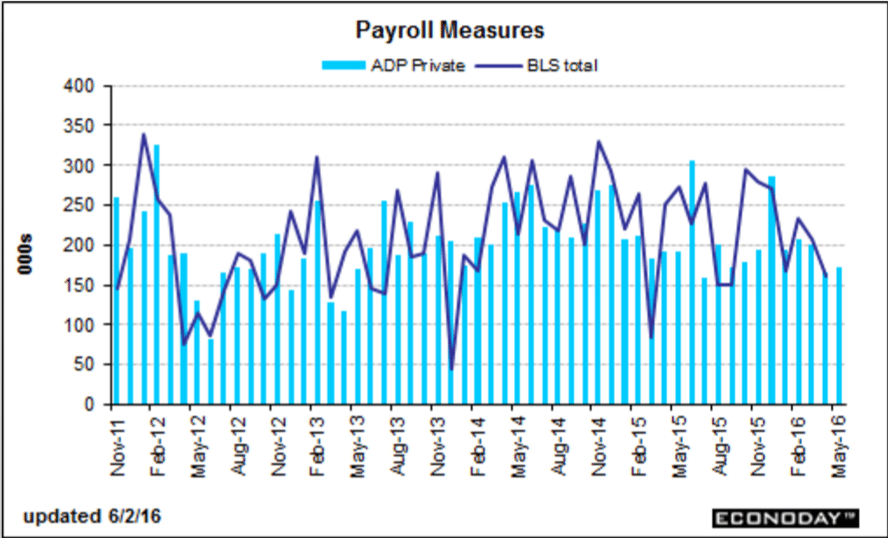
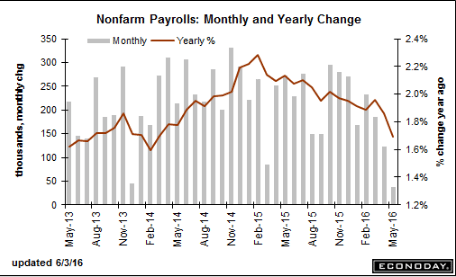
Employment Situation
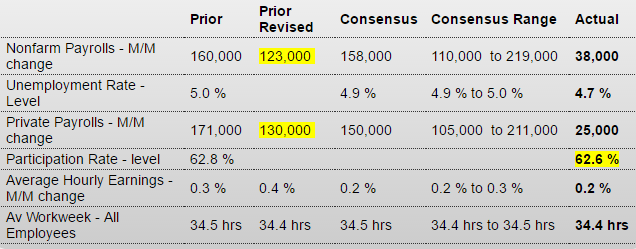
Highlights
The assessment of the labor market, not to mention the outlook for consumer spending, just came down as nonfarm payrolls proved much weaker than expected in May, up only 38,000 with the two prior months revised a total of 59,000 lower. The Verizon strike is a negative in the data but not a decisive one, pulling down telecommunication payrolls by 37,000 in a loss that will be reversed in coming reports now that the strike has been resolved.
The labor force as measured by the household survey shrank sharply, in turn driving down the unemployment rate by 3 tenths to a 4.7 percent level that embodies monthly weakness, not strength, in the labor market. The labor force participation rate, after having shown life in prior months, is down 2 tenths to 62.6 percent.
Earnings data are soft with average hourly earnings up only 0.2 percent with the year-on-year rate unchanged at a less-than-inflationary 2.5 percent. The average workweek is at 34.4 hours with the prior month revised 1 tenth lower to 34.4 as well.
Payrolls by industry show wide declines apart from telecommunications. Construction spending has been strong but construction payrolls, at minus 15,000, are down for a second month. Manufacturing payrolls, which have been consistently weak, are weak again, down 10,000 in the month. And mining payrolls extended their long contraction, also down 10,000 in the month. Of special note, temporary workers fell 21,000 but in a reading that could have been affected by the Verizon strike. On the positive side are government payrolls, up 13,000 in the month, and retail trade, up 11,000.
But positives are very hard to find in this report. Throw out any chance of a rate hike at this month’s FOMC and look for Janet Yellen, in her appearance on Monday, to offer an explanation for the sudden downgrade to the economic outlook.
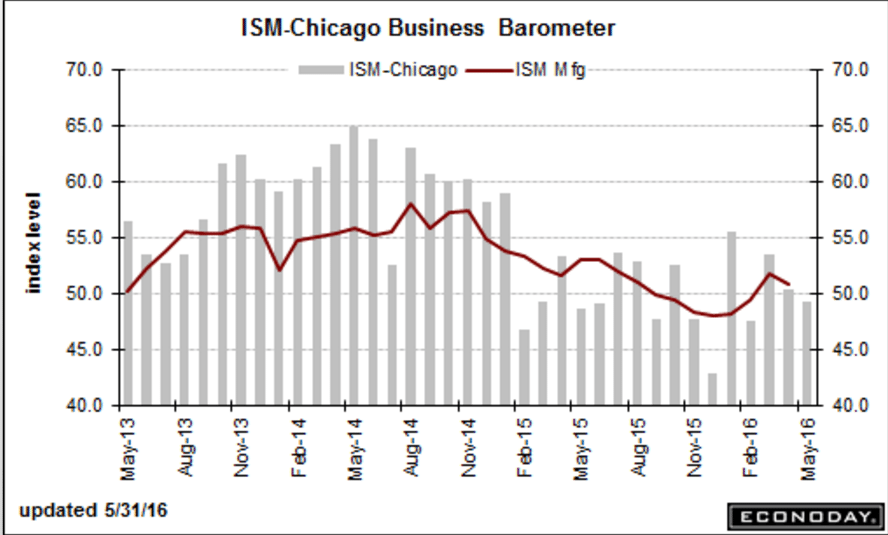
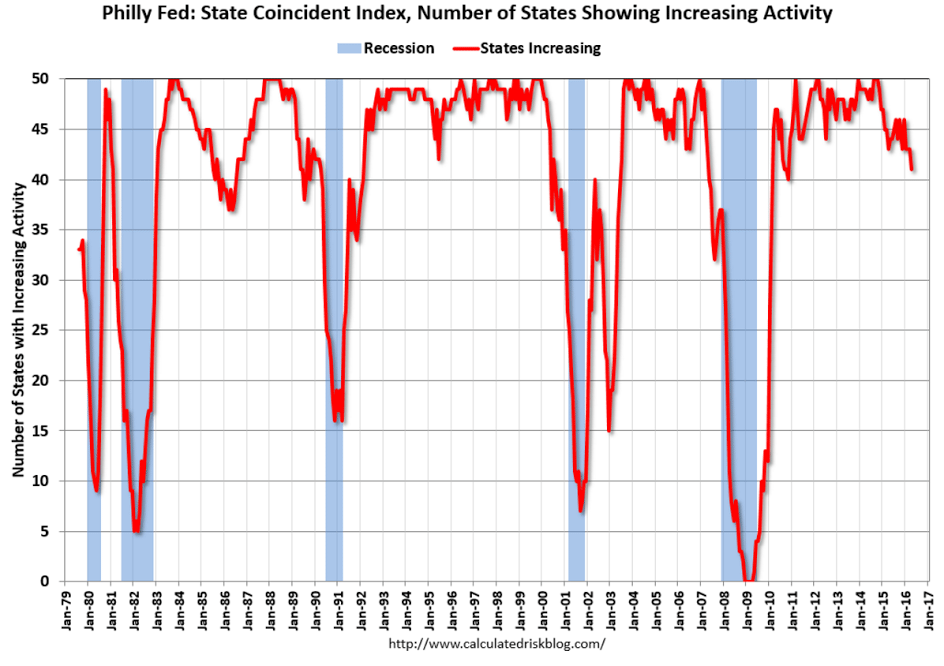
Also down:
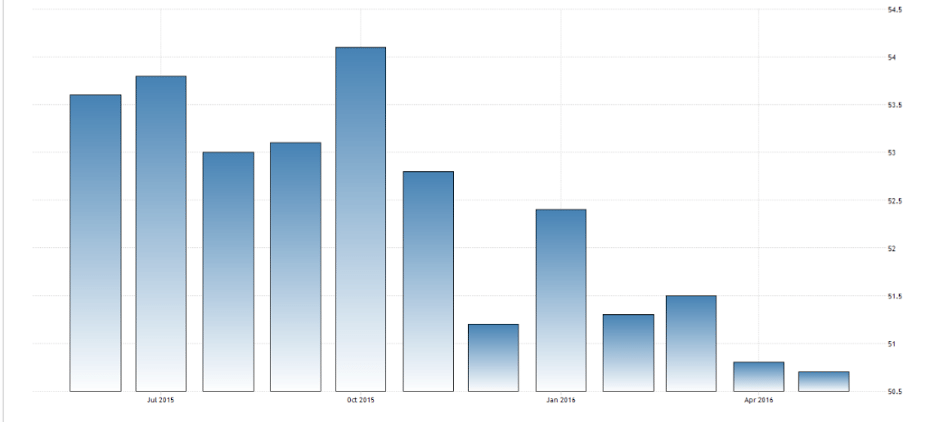
PMI Services Index

And another bad May reading more than reversing an April improvement:
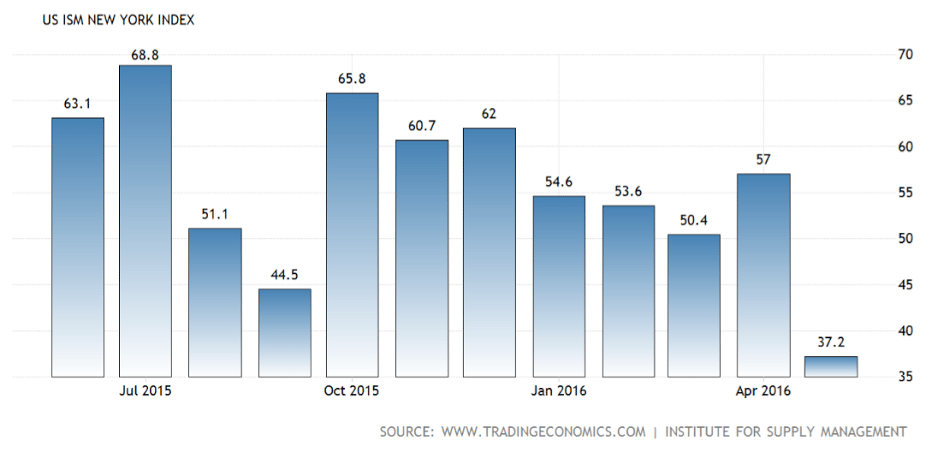
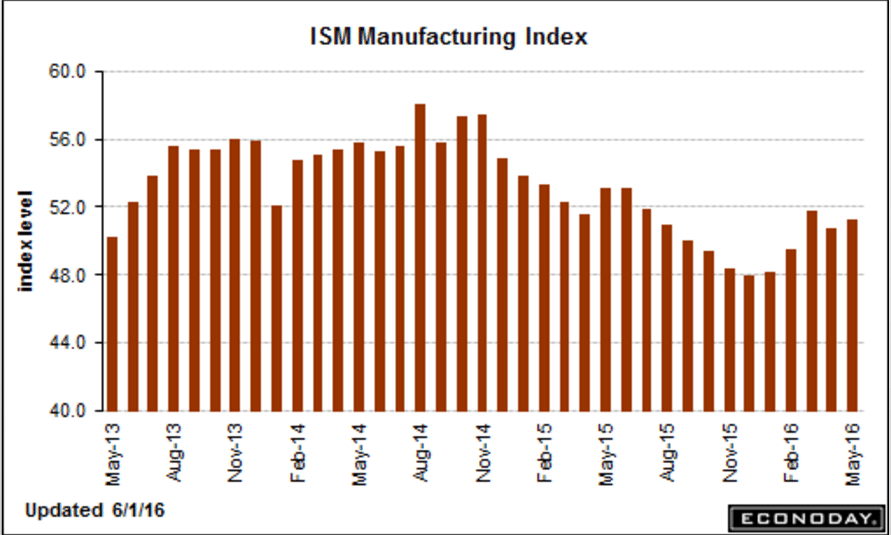
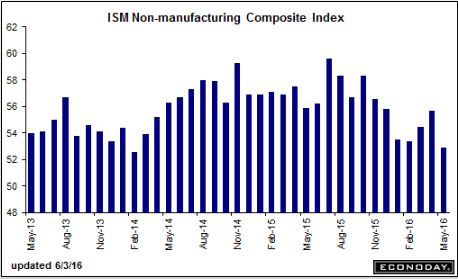
ISM Non-Mfg Index

Highlights
The ISM’s non-manufacturing index confirms what is proving to be a very weak month of May for the nation’s economy. The index fell a very sharp 2.8 points to 52.9 to signal the weakest rate of monthly growth since January 2014. The report’s employment index, in what matches this morning’s data from the government, is the weakest component, down 3.3 points to a 49.7 level that signals marginal month-to-month contraction in the sample’s employment levels.
But there is a solid signal of strength in the report as new orders, though falling 5.7 points, are still well over the breakeven level at 54.2. Yet even here, the rate of growth is the slowest since February 2014. Another plus, or at least not a negative, is no change for backlog orders which are at 50.0, still the weakest reading since May 2015. Demand for the nation’s services is always a plus for trade data but this report is hinting at a downturn with the export index at 49.0 and the lowest level since April last year.
ISM’s sample was active as far as output goes with the business activity index at 55.1, yet still down 3.7 points, and were still active importers with the related index at 53.5 for only a half point dip. Prices are also a positive, up 2.2 points to 55.6 and reflecting increases underway in energy prices in what is welcome news for policy makers who are trying to stimulate inflation.
Otherwise, however, there is very little welcome news at all in the May report. This report has been consistently upbeat which underscores the unwelcome importance of today’s results.
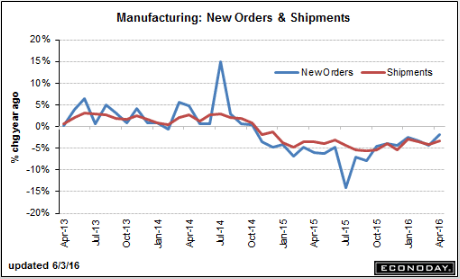
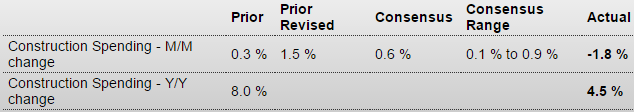
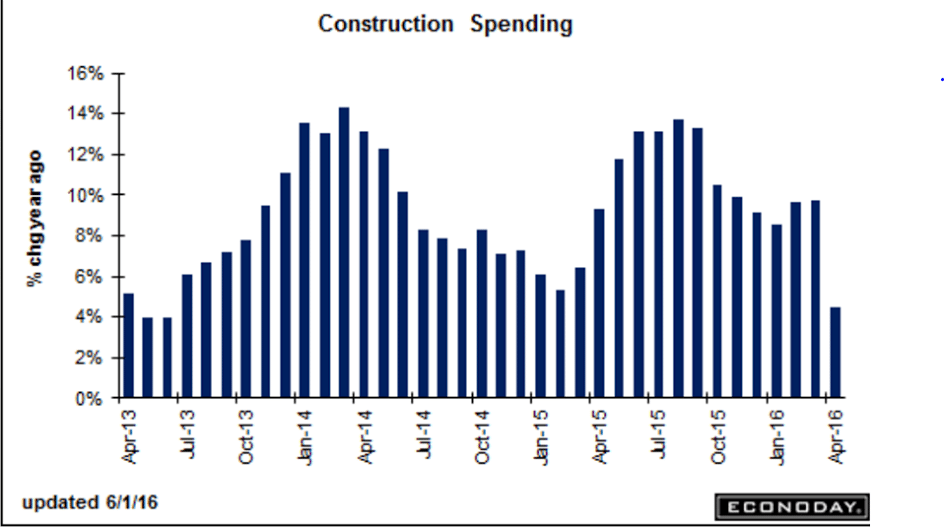
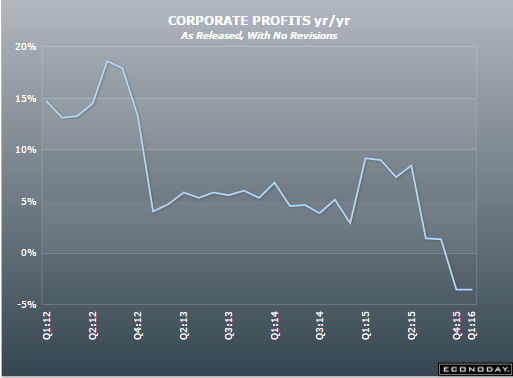
An ok headline number and prior month revision, but year over year, as shown in the chart, and removes seasonal factors, remains negative, even with the aircraft orders included:
Factory Orders
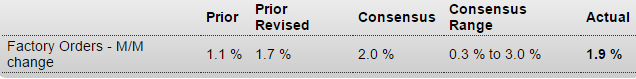
Highlights
Factory orders did rise 1.9 percent in April but reflect a monthly swing higher for civilian aircraft. Otherwise, data are mostly soft especially for core capital goods where orders, reflecting contraction for machinery, fell 0.6 percent and follow a soft 0.3 percent rise in March and a steep 2.1 percent decline in February. Orders for non-durable goods rose 0.4 percent and reflect, not fundamental strength in demand, but the month’s rise in energy prices.
One plus is that the nation’s factories are keeping down their inventories which extended a run of declines with a 0.1 percent dip that pulls the inventory-to-shipments ratio down one notch to 1.36. Unfilled orders, which had been very weak, rebounded to plus 0.6 percent in another positive while shipments, in the biggest positive of all, rose a sizable 0.5 percent.
But the story of this report is really about business investment where the decline in core capital goods orders is a serious negative, especially for the nation’s weak productivity outlook. Note that the factory orders report includes revised data on durable goods and initial data on non-durable goods.