Consumer Credit
Highlights
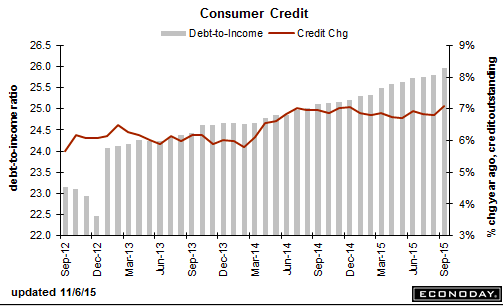
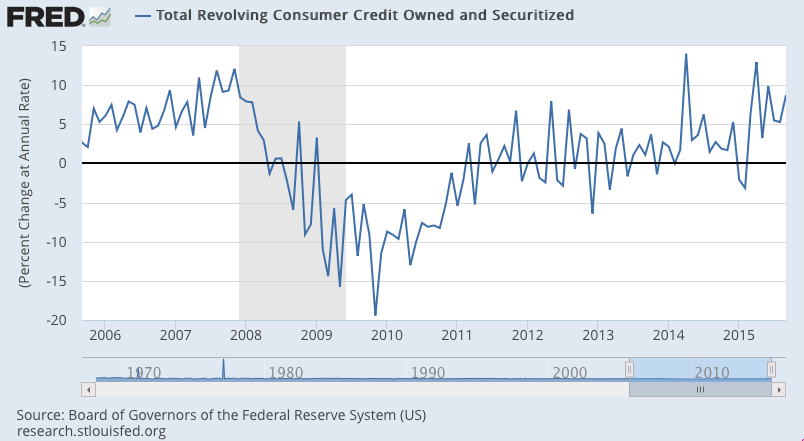
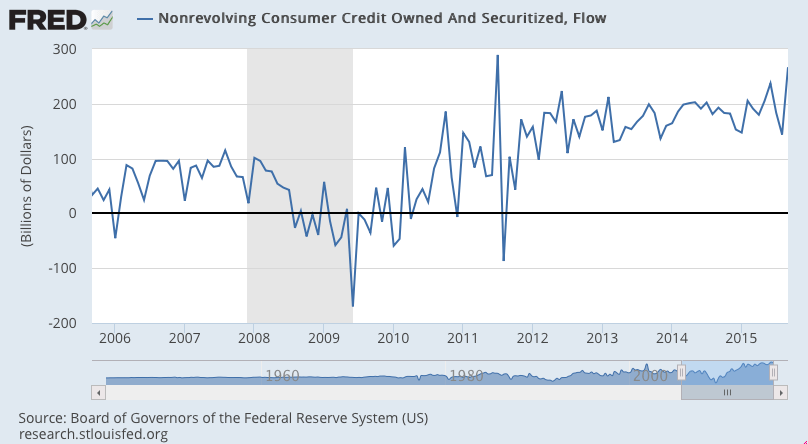
In a record report, consumer credit data are strongly confirming the strength of the consumer. Credit outstanding surged $28.9 billion in September for the largest gain in the history of the series which goes back to 1941. Nonrevolving credit, in part reflecting vehicle financing and also student loans, rose $22.2 billion. Revolving credit, reflecting a rise in credit-card debt, jumped $6.7 billion to extend an emerging run of strength that suggests consumers are now less reluctant to run up their credit cards which, for retailers certainly, is a good omen for the holidays.
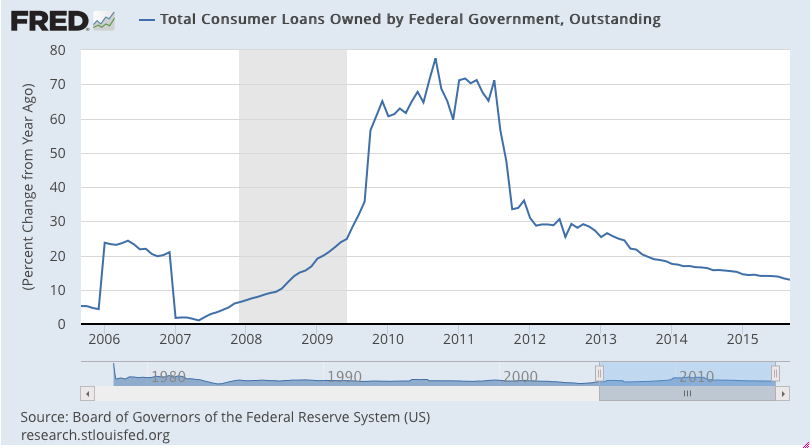
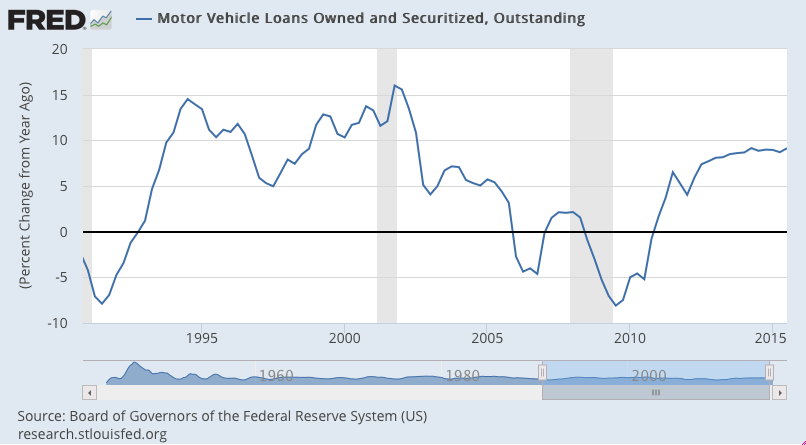
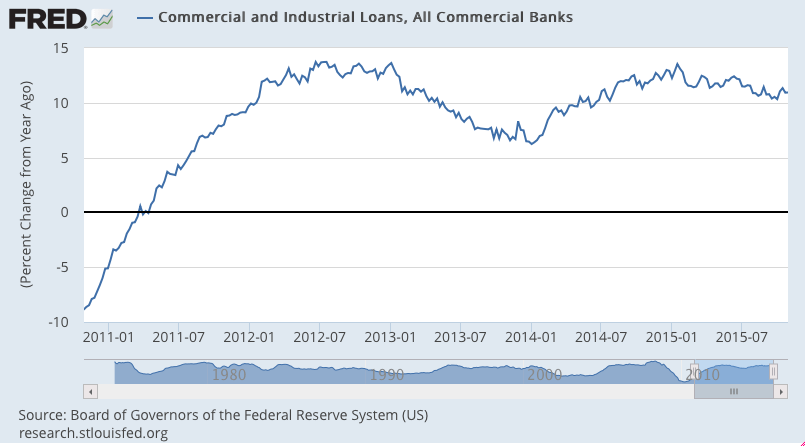
Hard to detect anything happening here except some volatility and maybe consumers borrowing more in response to low personal income growth?
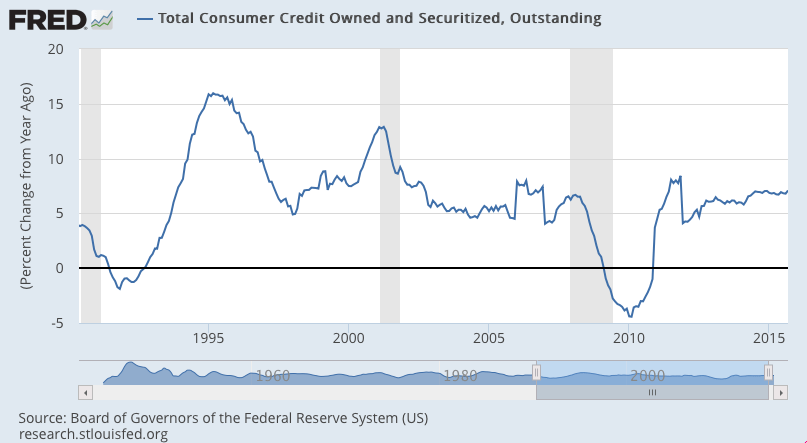
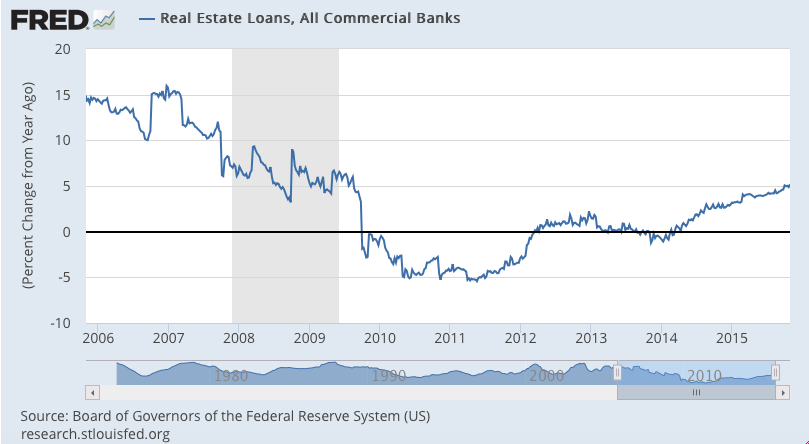
Fed rate hikes are meant to slow credit growth.
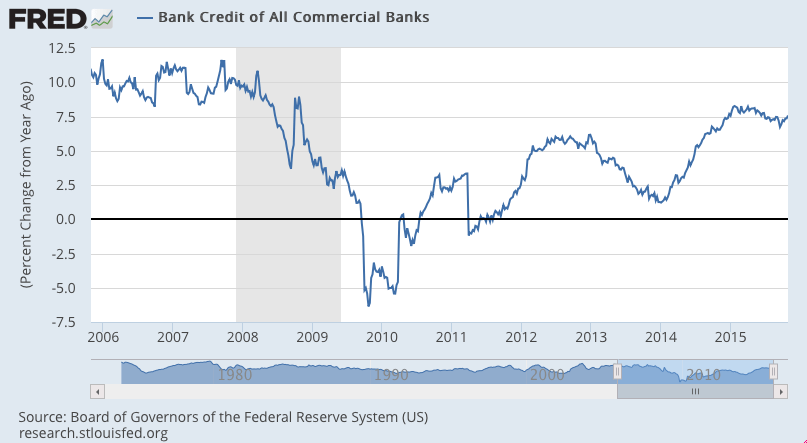
I don’t see any credit growth they’d want to be slowing?
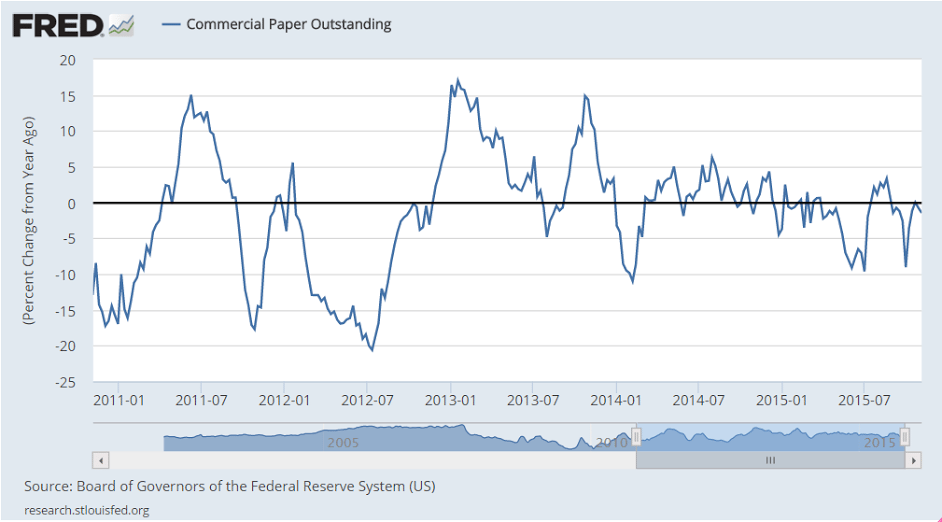
This has recently flattened at grow rates associated with the last recession:

Rail Week Ending 31 October 2015: Monthly Data Now Contracting 4.3% Year-over-Year
Week 43 of 2015 shows same week total rail traffic (from same week one year ago) and monthly total rail traffic (from same month one year ago) declined according to the Association of American Railroads (AAR) traffic data. Intermodal traffic contracted year-over-year, which accounts for approximately half of movements. and weekly railcar counts continued in contraction. October 2015 is down 4.3% over October 2014.
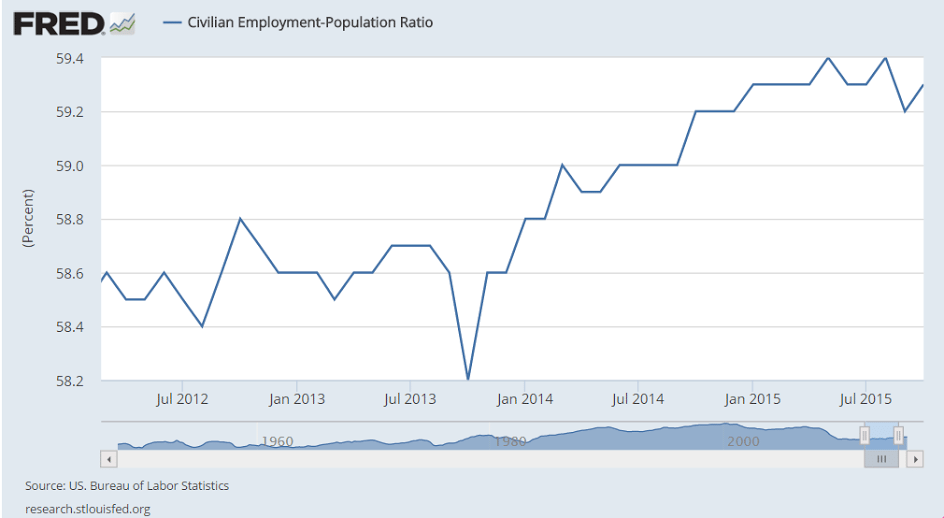
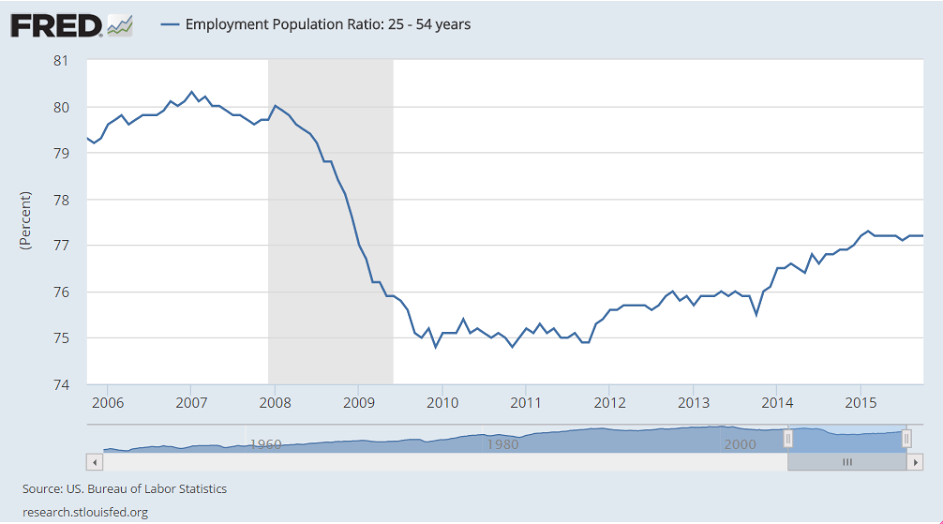
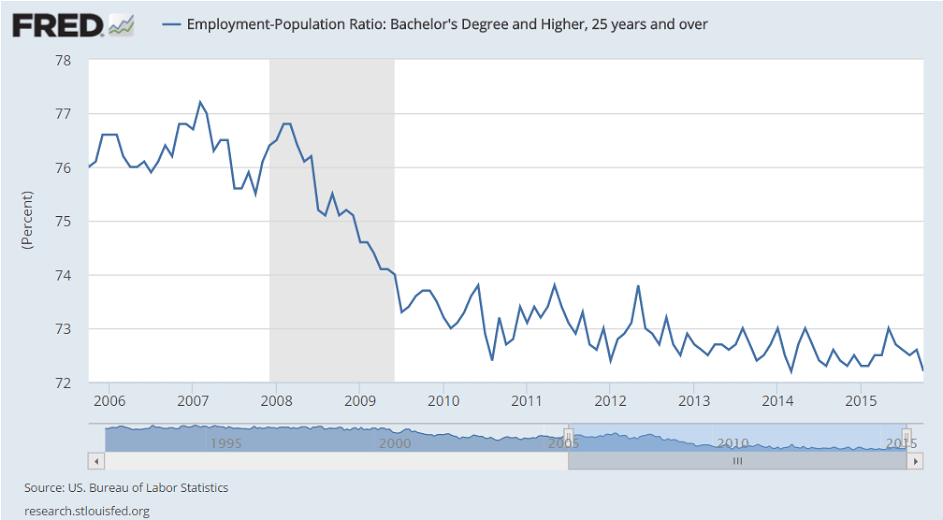
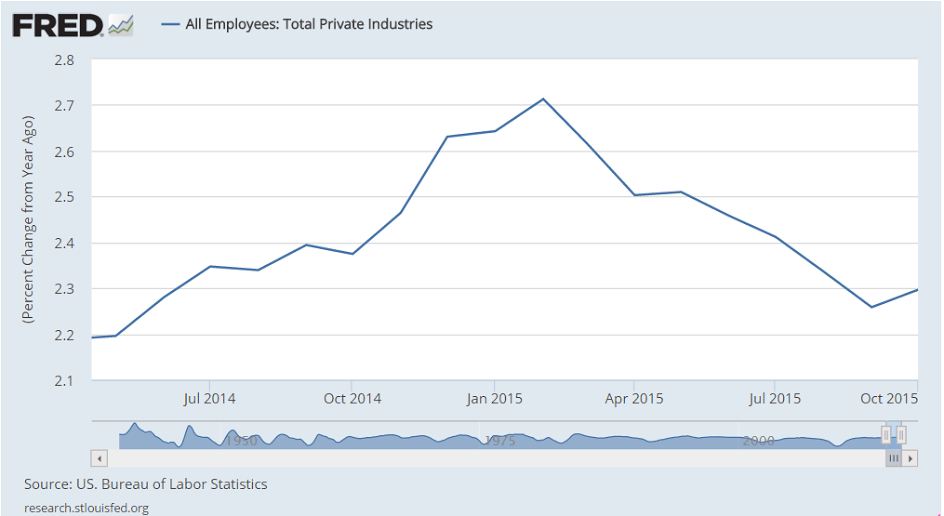
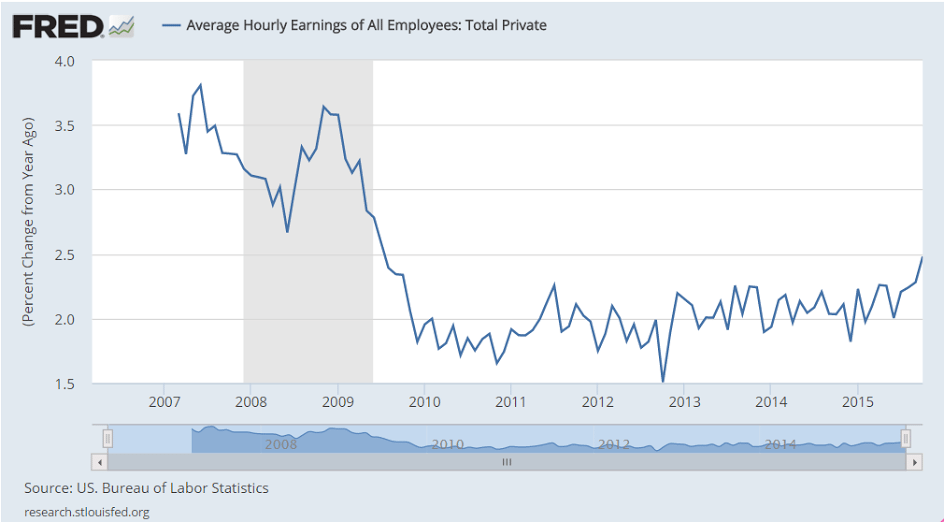
Yes, this earnings measure did pop up some, but way behind prior cycles and just a one month move at this point. The 2014 move they were worried about reversed itself before it got anywhere near ‘danger’ levels, whatever that actually means:
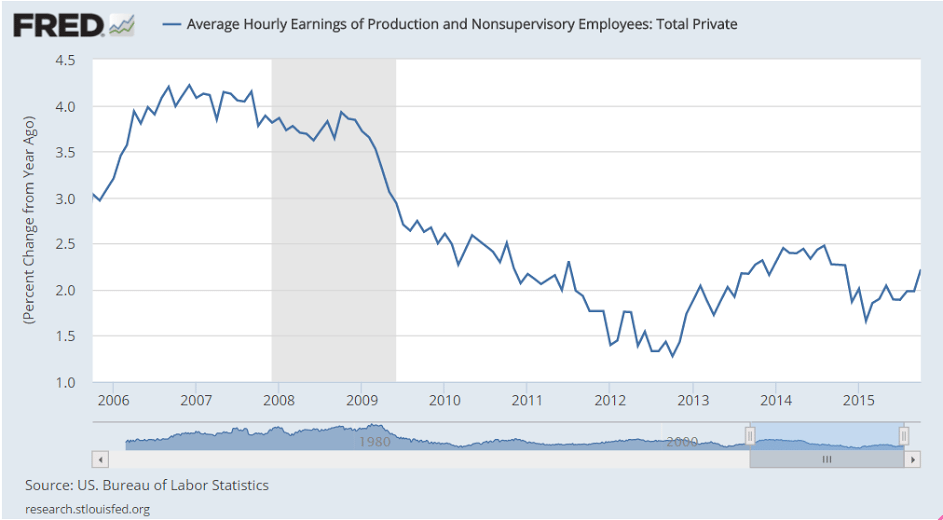
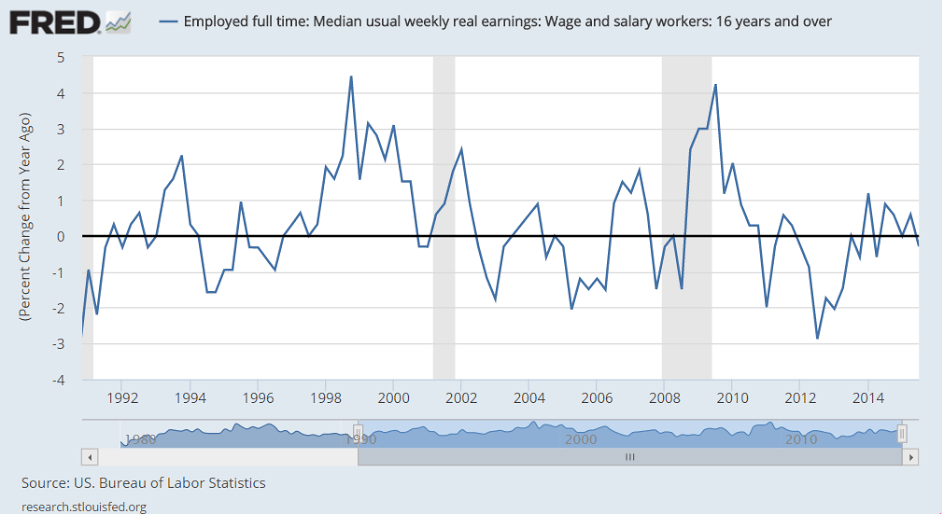
Again, a one month move that could just as easily reverse next month, and in any case far from posing any kind of problem to ‘inflation’ or employment (the Fed’s mandates):
And this is from the GDP report:
This was just starting to begin to recover when the oil price collapse bent the curve downward:
