More bad new, and, again consumption down even with lower gas prices:
Chicago Fed National Activity Index
Highlights
The economy has indeed gotten off to a slow start this year, confirmed by the national activity index which came in at minus 0.11 in February vs minus 0.10 in January. The 3-month average is now in negative ground, at minus 0.08 in February vs plus 0.26 in January.
The weakest component in February is for personal consumption & housing, at minus 0.17. The component for production-related indicators, at minus 0.07, is the second weakest. These readings offer tangible confirmation that both housing and manufacturing are pulling down economic growth.
But employment, importantly, continues to be the bright spot for the economy, at plus 0.11 with sales/orders/inventories fractionally positive at plus 0.02.
Also less than expected and depressed:
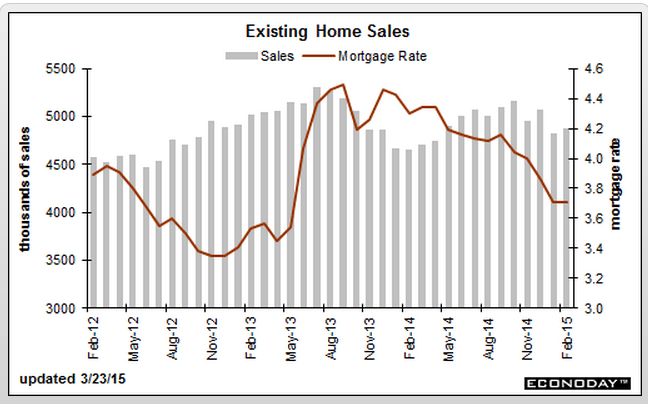
Existing Home Sales
Highlights
Existing home sales bounced 1.2 percent higher in February to a 4.88 million annual pace which is above January’s 4.82 million but still isn’t that strong. The year, in fact, opens with the two weakest months for existing home sales since April last year. The year-on-year rate, however, is showing strength, at plus 4.7 percent in February for the strongest reading since October 2013.
The data are split between single-family homes and condos with the single-family component in front which is encouraging, up 1.4 percent to a 4.10 million pace and a year-on-year gain of 5.9 percent. The condo component was unchanged in February at 0.540 million for a year-on-year minus 3.6 percent.
The South is by far the largest region for total sales and rose 1.9 percent in February for a year-on-year plus 6.0 percent. The West and Midwest are the next largest regions with the Midwest unchanged in the month and up 4.9 percent year-on-year with the West up 1.9 percent in February for a year-on-year gain of 2.8 percent. February sales fell 6.5 percent in the Northeast, which lags in the distance in size. The year-on-year rate for the Northeast is plus 3.6 percent.
Existing homes on the market are still on the scarce side, at 4.6 months of supply and unchanged from January. A year ago, the rate was 4.9 months. Prices firmed in the latest report, up 2.5 percent to a median $202,600 and a respectable 7.5 percent ahead of a year ago. Note, however, that price data in this report are subject to volatility. Still the year-on-year reading is the best since February last year.
The housing market is soft though there are some signs of life in this report including the month’s gain for single-family sales. New home sales, like sales of existing homes, have also been soft and a decline is expected in tomorrow’s data.
Oil Price Drop Hurts Spending on Business Investments
By Nick Timiraos
March 22 (WSJ) — Business capital spending rose 6% last year due to gains from a broad base of U.S. industries. The drag from energy this year could cut that growth rate in half in 2015, according to Goldman Sachs. Moreover, equity analysts at the bank estimate capital spending globally by energy companies in the S&P 500 will fall 25%. Already, energy companies in the S&P 500 have announced about $8.3 billion in spending cuts. Excluding energy, capital spending will grow 4% for S&P 500 companies this year, says Citi.
Think of it this way- portfolios and speculators sold euro for dollars last year to people who sold dollars to buy euro to then make purchases from the EU, as the EU ran a trade surplus and the US ran a trade deficit.
So those euro that were sold were ‘reabsorbed’ by euro exporters who used them to pay expenses domestically, etc. as tight fiscal policy in the EU continued to keep euro in short supply.
That means the euro ‘aren’t there’ to be repurchased should the portfolios and speculators attempt to rebalance until they drive the euro high enough to reverse the trade flows.
;)


