- MBA Mortgage Applications (Released 7:00 EST)
- MBA Purchasing Applications (Released 7:00 EST)
- MBA Refinancing Applications (Released 7:00 EST)
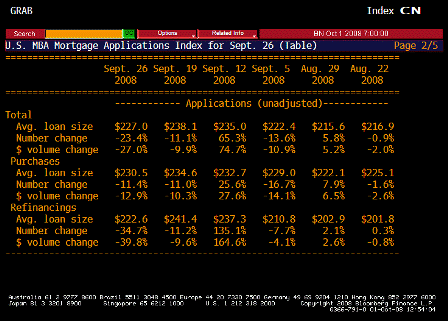
- MBA TABLE 1 (Released 7:00 EST)
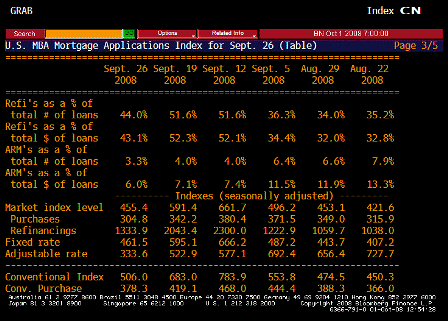
- MBA TABLE 2 (Released 7:00 EST)
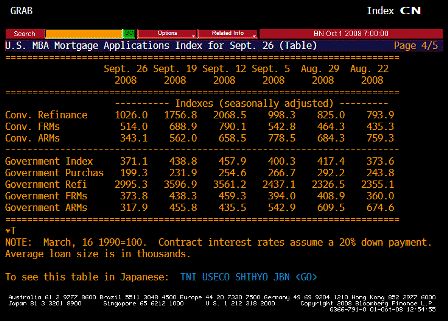
- MBA TABLE 3 (Released 7:00 EST)
- MBA TABLE 4 (Released 7:00 EST)
- Challenger Job Cuts YoY (Released 7:30 EST)
- Challenger Job Cuts TABLE 1 (Released 7:30 EST)
- Challenger Job Cuts TABLE 2 (Released 7:30 EST)
- Challenger Job Cuts TABLE 3 (Released 7:30 EST)
- Challenger Job Cuts TABLE 4 (Released 7:30 EST)
- ADP Employment Change (Released 8:15 EST)
- ADP ALLX (Released 8:15 EST)
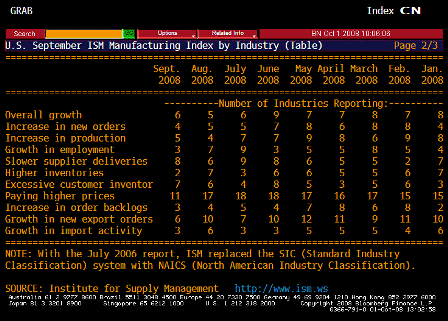
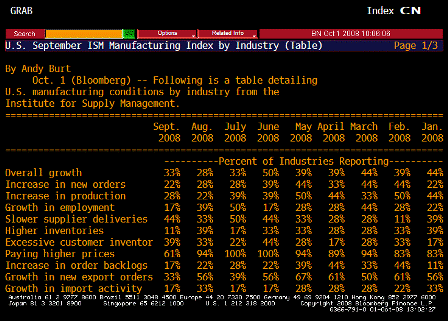
- ISM Manufacturing (Released 10:00 EST)
- ISM Prices Paid (Released 10:00 EST)
- ISM TABLE 1 (Released 10:00 EST)
- ISM TABLE 2 (Released 10:00 EST)
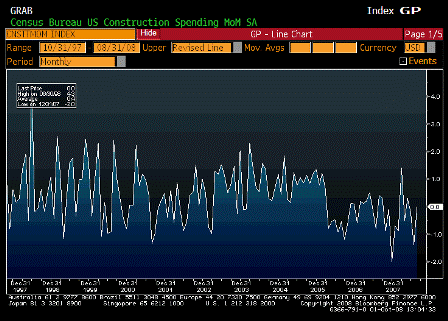
- Construction Spending MoM (Released 10:00 EST)
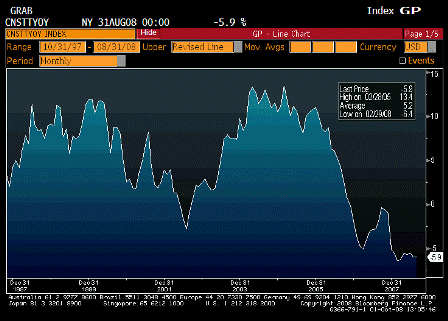
- Construction Spending YoY (Released 10:00 EST)
- Construction Spending Residential (Released 10:00 EST)
- Construction Spending TABLE 1 (Released 10:00 EST)
- Construction Spending TABLE 2 (Released 10:00 EST)
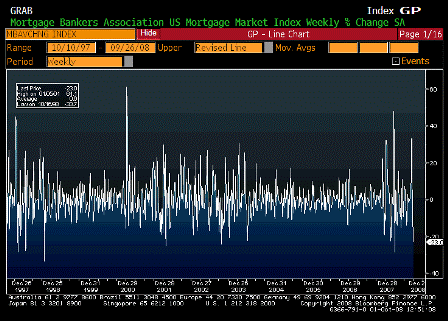
MBA Mortgage Applications (Sep 26)
| Survey | n/a |
| Actual | -23.0% |
| Prior | -10.6% |
| Revised | n/a |
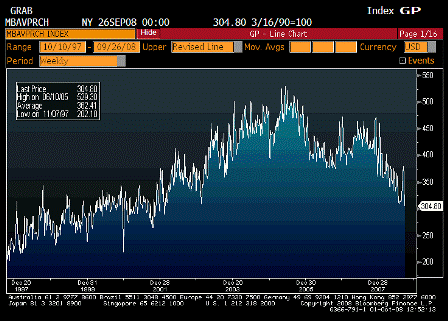
MBA Purchasing Applications (Sep 26)
| Survey | n/a |
| Actual | 304.80 |
| Prior | 342.20 |
| Revised | n/a |
Back towards 300, the bottom of the range. Falling like most other indicators. A weak September due to the fears of the financial crisis looks to have pushed q3 into negative numbers.
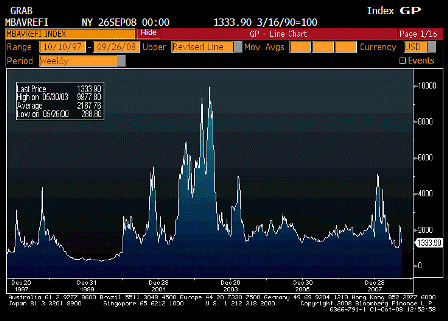
MBA Refinancing Applications (Sep 26)
| Survey | n/a |
| Actual | 1333.90 |
| Prior | 2043.40 |
| Revised | n/a |
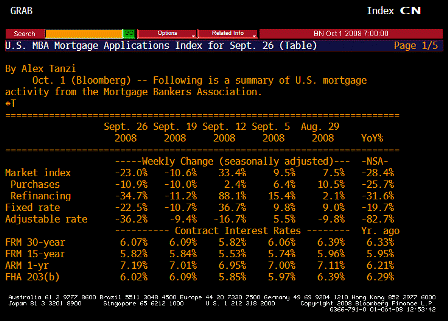
MBA TABLE 1 (Sep 26)
MBA TABLE 2 (Sep 26)
MBA TABLE 3 (Sep 26)
MBA TABLE 4 (Sep 26)
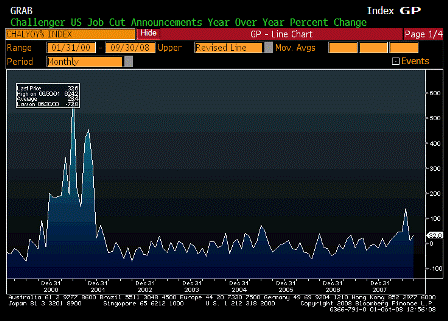
Challenger Job Cuts YoY (Sep)
| Survey | n/a |
| Actual | 32.6% |
| Prior | 11.7% |
| Revised | n/a |
Not normally considered reliable, but this time in sync with other indicators of weakness.
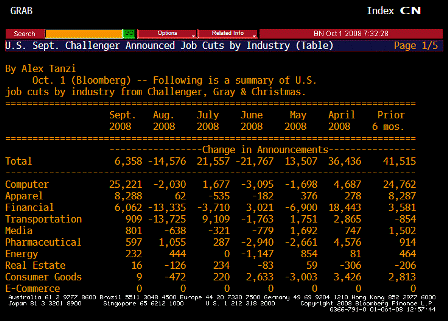
Challenger Job Cuts TABLE 1 (Sep)
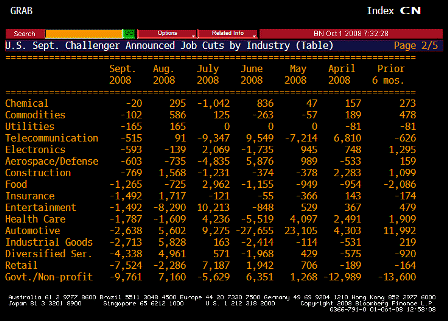
Challenger Job Cuts TABLE 2 (Sep)
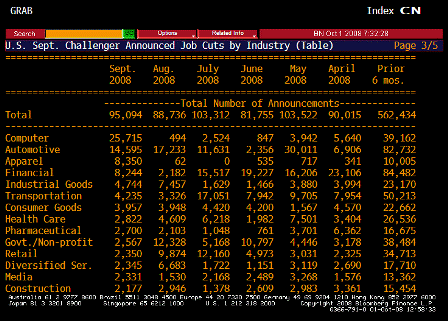
Challenger Job Cuts TABLE 3 (Sep)
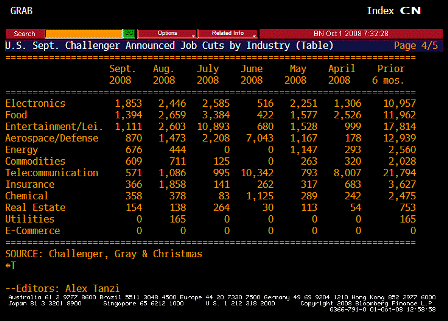
Challenger Job Cuts TABLE 4 (Sep)
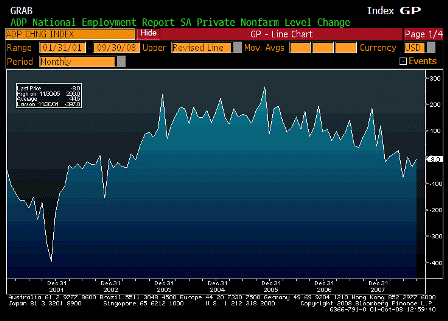
ADP Employment Change (Sep)
| Survey | -50K |
| Actual | -8K |
| Prior | -33K |
| Revised | -37K |
The long gradual decline continues. This number is higher by about 50,000 than the same numbers will be as measured Friday due to the Boeing strike and the hurricane. ADP counts the strikers as still employed while the government doesn’t for Friday’s number.
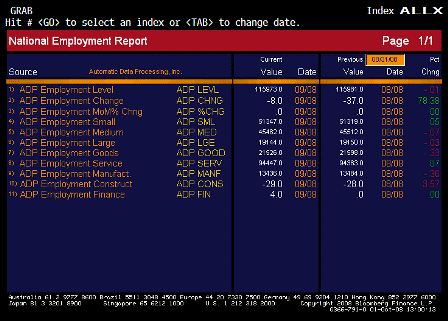
ADP ALLX (Sep)
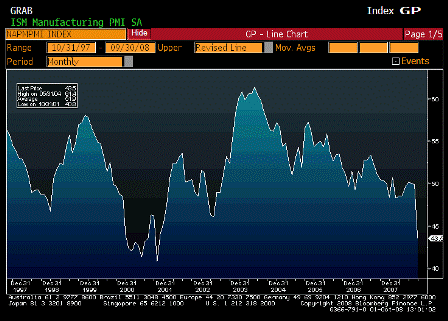
ISM Manufacturing (Sep)
| Survey | 49.5 |
| Actual | 43.5 |
| Prior | 49.9 |
| Revised | n/a |
Serious nose dive here. Talk of buyers waiting for price reductions due to commodity price drops.
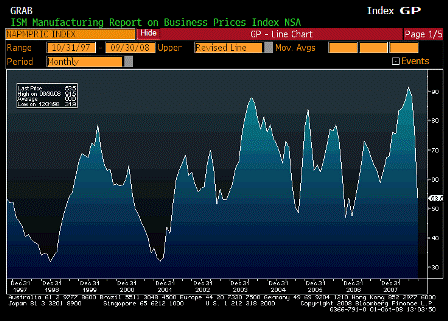
ISM Prices Paid (Sep)
| Survey | 73.0 |
| Actual | 53.5 |
| Prior | 77.0 |
| Revised | n/a |
Down, lower than expected, but more than half still paying higher prices. No deflation yet.
ISM TABLE 1 (Sep)
ISM TABLE 2 (Sep)
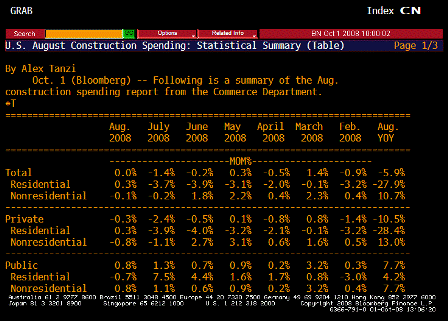
Construction Spending MoM (Aug)
| Survey | -0.5% |
| Actual | 0.0% |
| Prior | -0.6% |
| Revised | -1.4% |
Flat, better than expected, but prior month revised down by .8%.
Residential rose .3% for the first increase in a long time.
Construction Spending YoY (Sep)
| Survey | n/a |
| Actual | -5.9% |
| Prior | -5.9% |
| Revised | n/a |
The rate of decline has stabilized, and there will soon be easier comps.
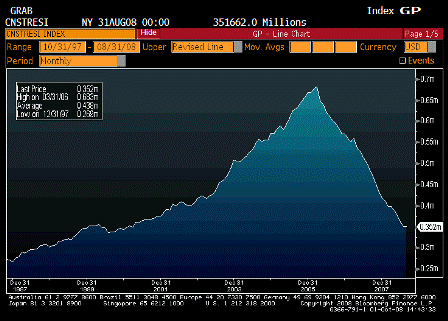
Construction Spending Residential (Sep)
| Survey | n/a |
| Actual | 351662.0 |
| Prior | 350563.0 |
| Revised | n/a |
Construction Spending TABLE 1 (Sep)
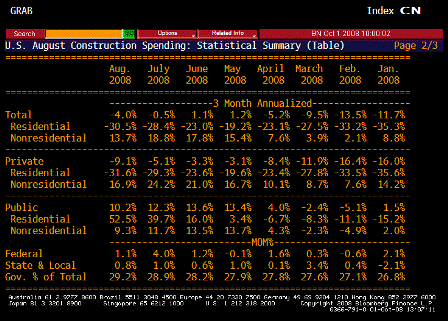
Construction Spending TABLE 2 (Sep)
[top]


