- Personal Income MoM (Released 8:30 EST)
- Personal Income YoY (Released 8:30 EST)
- Personal Income TABLE 1 (Released 8:30 EST)
- Personal Income TABLE 2 (Released 8:30 EST)
- Personal Spending MoM (Released 8:30 EST)
- Personal Spending YoY (Released 8:30 EST)
- PCE Deflator YOY (Released 8:30 EST)
- PCE Core MoM (Released 8:30 EST)
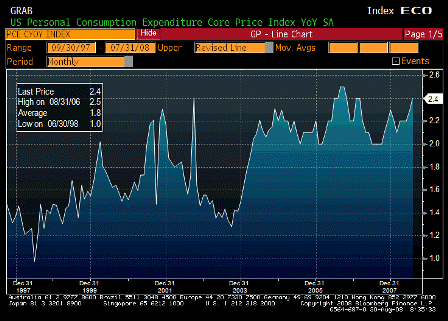
- PCE Core YoY (Released 8:30 EST)
- PCE ALLX 1 (Released 8:30 EST)
- PCE ALLX 2 (Released 8:30 EST)
- RPX Composite 28dy Index (Released 9:00 EST)
- RPX Composite 28dy YoY (Released 9:00 EST)
- Chicago Purchasing Manager (Released 9:45 EST)
- Chicago Purchasing Manager TABLE 1 (Released 9:45 EST)
- Chicago Purchasing Manager TABLE 2 (Released 9:45 EST)
- U of Michigan Confidence (Released 10:00 EST)
- U of Michigan Consumer Attitudes TABLE (Released 10:00 EST)
- Inflation Expectations 1yr Fwd (Released 10:00 EST)
- Inflation Expectations 5yr Fwd (Released 10:00 EST)
- NAPM-Milwaukee (Released 10:00 EST)
- NAPM-Milwaukee ALLX (Released 10:00 EST)
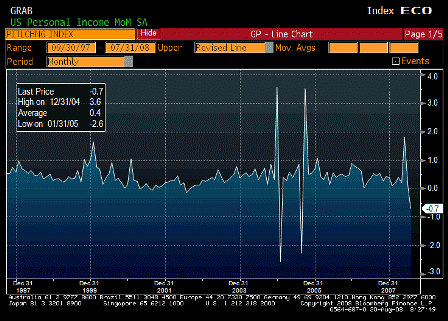
Personal Income MoM (Jul)
| Survey | -0.2% |
| Actual | -0.7% |
| Prior | 0.1% |
| Revised | n/a |
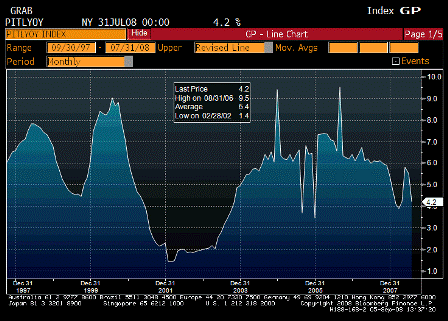
Personal Income YoY (Jul)
| Survey | n/a |
| Actual | 4.2% |
| Prior | 5.5% |
| Revised | n/a |
Still at higher levels than before the rebates and far from a consumer collapse.
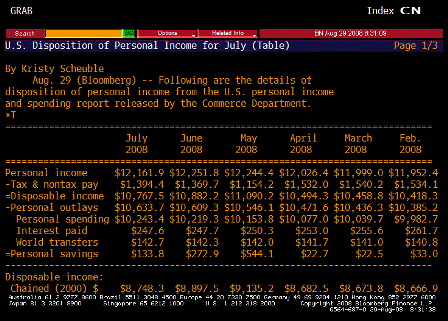
Personal Income TABLE 1 (Jul)
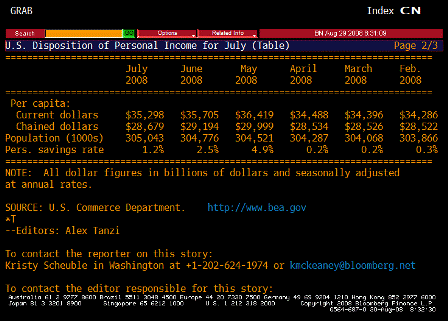
Personal Income TABLE 2 (Jul)
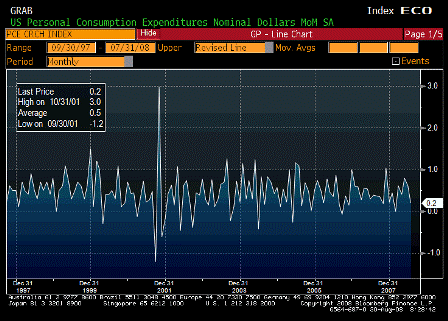
Personal Spending MoM (Jul)
| Survey | 0.2% |
| Actual | 0.2% |
| Prior | 0.6% |
| Revised | n/a |
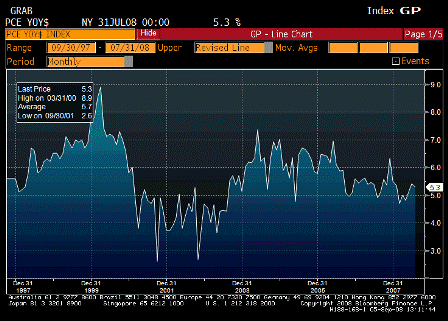
Personal Spending YoY (Jul)
| Survey | 0.2% |
| Actual | 0.2% |
| Prior | 0.6% |
| Revised | n/a |
Doesn’t look all that bad to me.
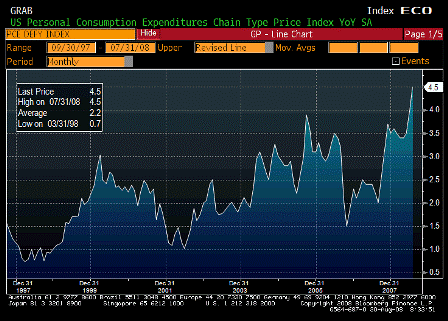
PCE Deflator YOY (Jul)
| Survey | 4.5% |
| Actual | 4.5% |
| Prior | 4.1% |
| Revised | 4.0% |
This is not the kind of chart the Fed wants to see.
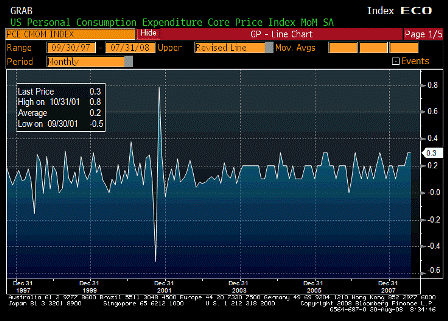
PCE Core MoM (Jul)
| Survey | 0.3% |
| Actual | 0.3% |
| Prior | 0.3% |
| Revised | n/a |
PCE Core YoY (Jul)
| Survey | 2.4% |
| Actual | 2.4% |
| Prior | 2.3% |
| Revised | n/a |
Neither is this.
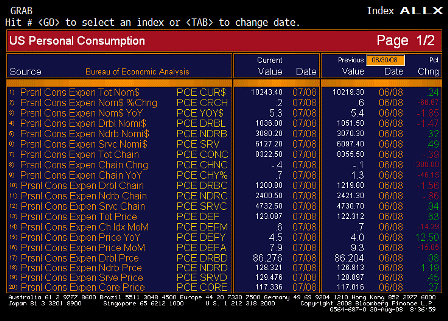
PCE ALLX 1 (Jul)
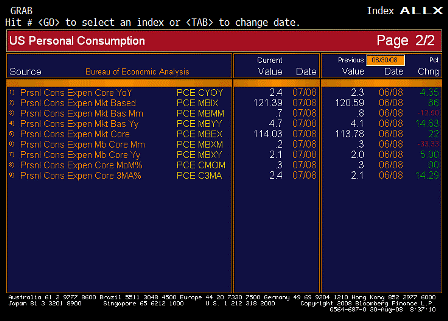
PCE ALLX 2 (Jul)
Karim writes:
- Not much to alter Fed’s view or likely course with this data
- Real PCE down -0.3% m/m for July, in line with expectations. Nominal PCE up 0.2%.
- Personal income down 0.7%, again as expected, and due to drop in government transfers (fiscal package ended)
- Core PCE deflator up 0.3% m/m and 2.4% y/y. At Jackson Hole, Bernanke stated he expected inflation to ‘moderate later this year and next’, meaning he still sees a few more months of possible upward pressure.
Yes, and he has been saying he expects headline inflation to moderate at every speaking event for the last few years.
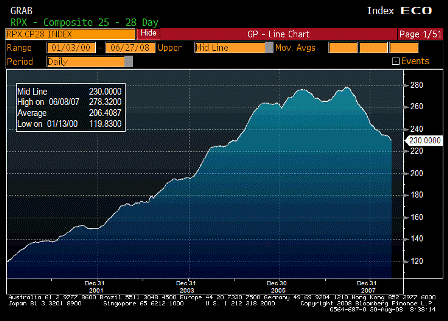
RPX Composite 28dy Index (Jun)
| Survey | n/a |
| Actual | 230.00 |
| Prior | 233.37 |
| Revised | n/a |
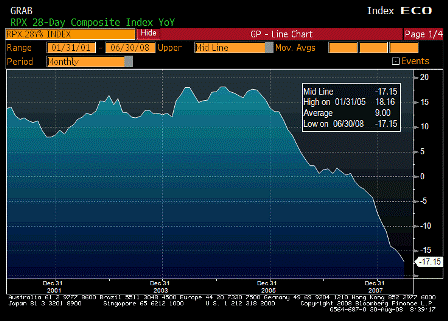
RPX Composite 28dy YoY (Jun)
| Survey | n/a |
| Actual | -17.15% |
| Prior | -15.60% |
| Revised | n/a |
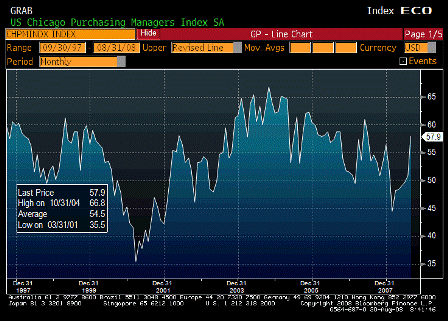
Chicago Purchasing Manager (Aug)
| Survey | 50.0 |
| Actual | 57.9 |
| Prior | 50.8 |
| Revised | n/a |
Upside surprise here.
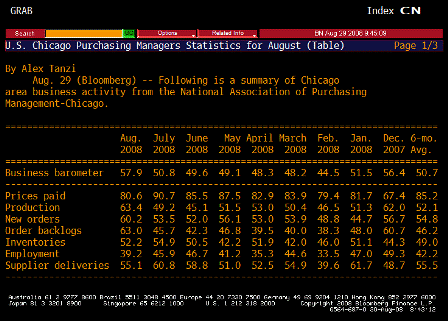
Chicago Purchasing Manager TABLE 1 (Aug)
Prices paid still way high; big dip in employment.
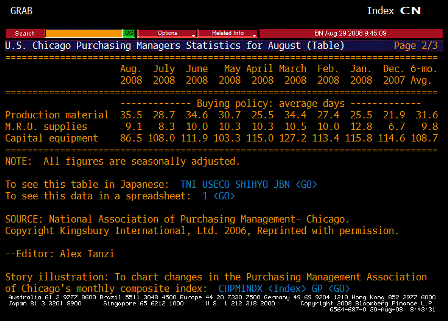
Chicago Purchasing Manager TABLE 2 (Aug)
Karim writes:
- Chicago PMI rises from 50.8 to 57.9; but orders and production components (each up sharply) at odds with employment component (down sharply), so report to be taken with a grain of salt.
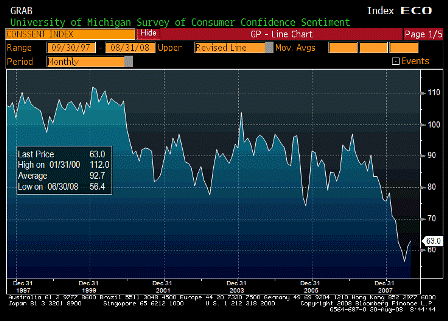
U of Michigan Confidence (Aug F)
| Survey | 62.0 |
| Actual | 63.0 |
| Prior | 61.7 |
| Revised | n/a |
Karim writes:
- Final UMICH survey for August shows minor improvement in confidence (61.7 to 63.0) and no change in inflation expectations components.
- ISM and payrolls next week to weigh more heavily
Confidence turning up with the rebates.
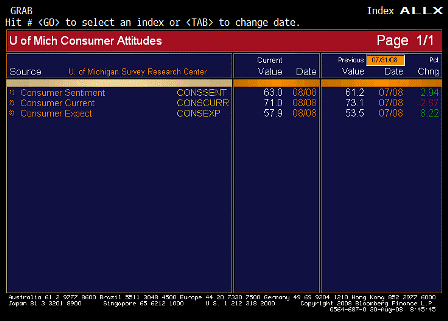
U of Michigan Consumer Attitudes TABLE (Aug F)
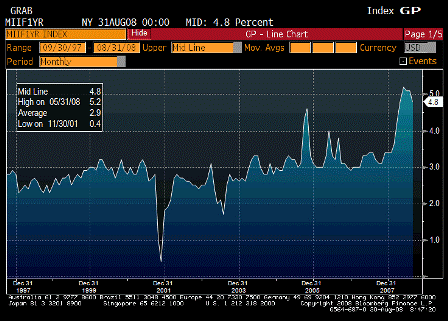
Inflation Expectations 1yr Fwd (Aug F)
| Survey | n/a |
| Actual | 4.8% |
| Prior | 5.1% |
| Revised | n/a |
The Fed worries these will get embedded.
Personally, I don’t see inflation as a function of expectations but they do.
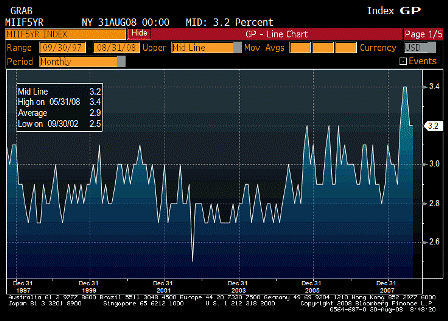
Inflation Expectations 5yr Fwd (Aug 5)
| Survey | n/a |
| Actual | 3.2% |
| Prior | 3.2% |
| Revised | n/a |
Too high still.
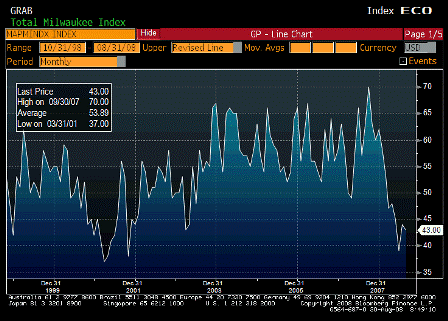
NAPM-Milwaukee (Aug)
| Survey | 44.0 |
| Actual | 43.0 |
| Prior | 44.0 |
| Revised | n/a |
A bit worse than expected but still off the bottom.
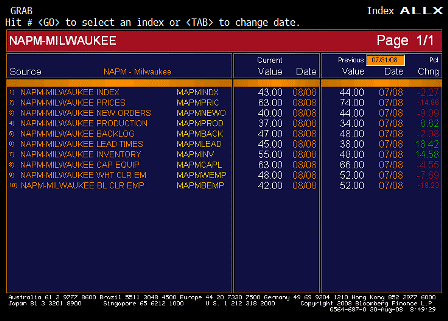
NAPM-Milwaukee ALLX (Aug)
[top]


