
BEA Reports 2nd Quarter 2015 GDP Growing at 2.32%:
By Rick Davis
July 30 (Consumer Metrics)Real annualized per capita disposable income was reported to be $37,846, some -$364 per year less than the previously reported $38,210 per annum. All of that downside came as a result of revisions to the prior quarter’s data, which was revised downward by -$437 (over a full percent). Meanwhile, the household savings rate plunged to 4.8% — down -0.7% from the previously reported 5.5%.
For this revision the BEA assumed an annualized deflator of 2.04%. During the same quarter (April 2015 through June 2015) the inflation recorded by BLS in their CPI-U index was 3.52%. Under estimating inflation results in optimistic growth rates, and if the BEA’s “nominal” data was deflated using CPI-U inflation information the headline number would show a more modest +0.89% growth rate.
Especially hard hit in the revisions were the real per-capita disposable income numbers. The cumulative compound annualized growth rate for real disposable income has been only +0.45% since the second quarter of 2008. And these figures represent mean incomes that are skewed by disproportionate growth at the upper end. According to Sentier Research, median incomes during the same time span have contracted by roughly 4%.
And household savings rates have been weaker than previously suspected, confirming the lower incomes.
Demand for Saudi oil firm and up a bit:
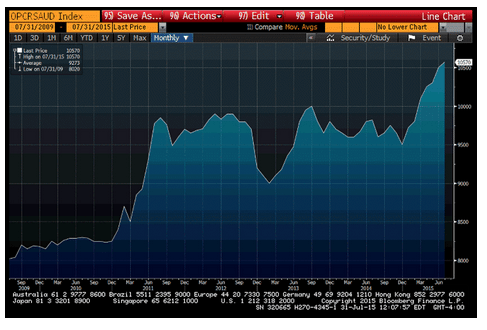
Even this is sagging:
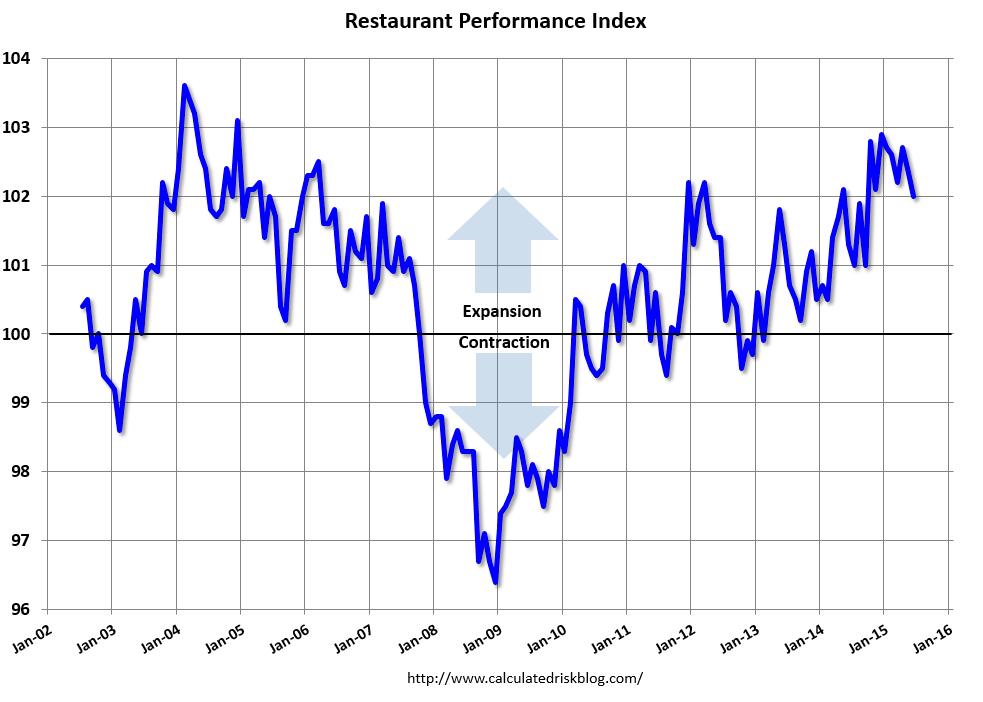
Restaurant Performance Index declined in June
By Bill McBride
July 31 (Calculated Risk Blog)
Here is a minor indicator I follow from the National Restaurant Association: Dampened Outlook Causes Restaurant Performance Index Decline in June
As a result of a somewhat dampened outlook among restaurant operators, the National Restaurant Association’s Restaurant Performance Index (RPI) declined in June for the second consecutive month. The RPI – a monthly composite index that tracks the health of and outlook for the U.S. restaurant industry – stood at 102.0 in June, down 0.4 percent from May and its lowest level in nine months. Despite the decline, June represented the 28th consecutive month in which the RPI stood above 100, which signifies continued expansion in the index of key industry indicators.
“Although same-store sales and customer traffic levels remained positive in June, the overall RPI declined as a result of dampened optimism among restaurant operators,” said Hudson Riehle, Senior Vice President of the Research and Knowledge Group for the Association. “The proportion of restaurant operators expecting sales growth fell to its lowest level in nine months, while operators’ outlook for the economy turned negative for the first time in nearly two years.”
The index decreased to 102.0 in June, down from 102.4 in May. (above 100 indicates expansion).
Restaurant spending is discretionary, so even though this is “D-list” data, I like to check it every month. Even with the decline in the index, this is a solid reading.
Read more at Calculated Risk Blog